Quality Determination And Control Contents IntroductionQuality and Control


 Operator level Operators measure important characteristics of materials or")
 Management level Finally, management has to make improvements possible, for instance by organizing")


: • For example, let's assume that Company XYZ makes widgets.")


")


 is the term used to describe the set")


 ØQuality control charts introduced in 1820 ØThe father of")


 : this chart is constructed for")


 This chart is constructed to measure the")


 Ø This chart is constructed for controlling")


 Ø C-chart helps to ascertain")


- Slides: 95
Quality Determination And Control
Contents • • • Introduction-Quality and Control Quality Control How Quality Control works Objects of Quality Control Levels of Quality Control Importance of Quality Control Steps of Quality Control When does Quality Control occur Problems of Quality Control Quality Assurance Difference between Quality Control and Assurance
Contents • • • • Advantages of Quality Control Methods of Quality Control Inspection Sampling versus Total Inspection Necessity of Inspection Categories of Inspection Objectives of Inspection Cost of Inspection Methods of Inspection Techniques of Inspection Organization of the Inspection Department Functions of Inspection Department References
Introduction • The quality of a product may be defined as the sum of a number of related characteristics such as shape, dimension, composition, strength, workmanship, adjustment, finish and color”. • There are two main elements in this definition of quality. • First, the commitment may be explicit such as a written contract or it may be implied in terms of the expectations of the average consumer of the product.
• Second, the performance of the product relates to the ultimate functions and services which the final product must give to the final consumer. • For example, a watch should show accurate time or a ball point pen should write legibly on a piece of paper.
Control • Control is the process of checking to determine whether or not, proper progress is being made towards the objectives and goals and acting if necessary to correct any deviation.
Quality Control Quality control means the recognition and removal of identifiable causes and defects, and variables from the set standards. Quality control is a technique of scientific management which has the object of improving industrial efficiency by concentrating on better standards of quality and on controls to ensure that these standards are always maintained. It is not intended to show what is wrong with current technology, but rather to establish what can be achieved with existing methods when they are operated correctly.
Objects of Quality Control • • • Establishing Quality Standards Ensure Smooth Production To Find Deviations In Production Process Find out causes in low Productivity Help in Segregation of Defective Products
Essentials of Quality Control • There should be clear cut standards against which the quality is to be measured. • Responsibility for quality of products to be manufactured should be given to competent personnel. • There should be specific routines to see that the standards are applied uniformly. • Proper records of quality should be maintained.
Levels of Quality Control 1) Operator level Operators measure important characteristics of materials or the production process to determine if the process is still ‘under control’, which means that variation is no more than expected and allowed. 2) Engineering level The responsible process engineer will analyze the manufacturing process regularly and based on the outcome of this analysis initiate improvement activities.
3) Management level Finally, management has to make improvements possible, for instance by organizing and facilitating training, or providing better measurement equipment.
Steps of Quality Control Standards of Quality Control over Raw Material Control Over Production Operations Inspection of Machinery and Equipment
Contd…… Quality Consciousness Application of Statistical Methods of Quality Control
When does Quality Control occur? • When Raw Material is received prior to production • When products are going through production process • Finished goods through inspection that takes place before goods are dispatched for customers • Evaluating People
Importance of Quality Control Encourages quality consciousness Satisfaction of consumers Competiveness Most effective utilization of resources Increased goodwill
Contd…. . Improved employer-employee relations Improved techniques and methods of production Effective advertisement Facilitates price fixation Increased sales Higher morale of employees
How it works (Example): • For example, let's assume that Company XYZ makes widgets. The widgets come in blue and pink. • To ensure that all the widgets are of same color pink and that the dye department is making the color consistently, it might create a quality control team that takes random samples of widgets and compares them for color consistency. • If the team finds any variation , it has the authority to stop the production line until the process is corrected.
Quality Assurance • Quality Assurance is known as QA and focuses on preventing defect. Quality Assurance ensures that the approaches, techniques, methods and processes are designed for the projects are implemented correctly. • Quality assurance is process of preventing mistakes in products and services. Quality Assurance is a proactive process and is Prevention in nature
Quality Assurance vs Quality Control § QA makes sure you are doing the right things. QC makes sure the results of what you’ve done are what you expected. § Quality assurance focuses on defect prevention and quality control focuses on defect identification. § Quality assurance is a proactive process while quality control is a reactive process.
• QA Everyone on the team involved in developing the product is responsible while in Quality control is usually the responsibility of a specific team that tests the product for defects. • In QA we establish a good quality management system and assess its adequacy whereas in QC we Find & eliminate sources of quality problems through tools & equipment so that customer's requirements are continually met. • QA is process oriented whereas QC is product oriented.
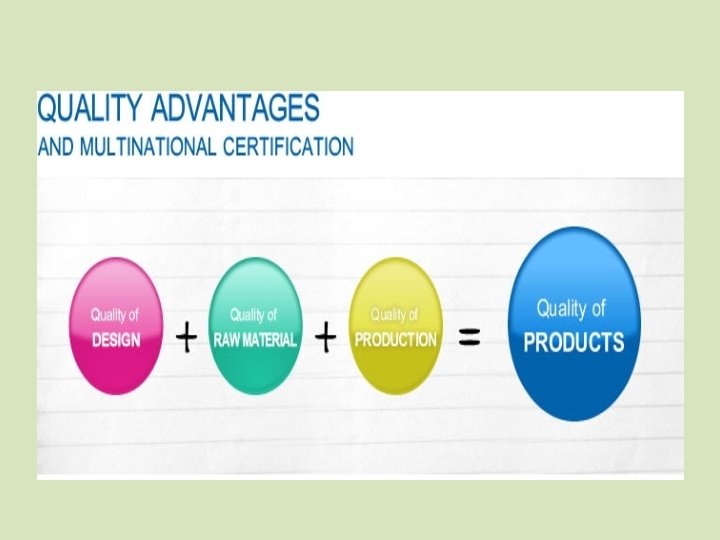
Factors Affecting Quality of Goods • • • Cost of Production Requirement of customers Equipment and Tools used Utility of Products Attitude of Workers Scale of Operations
Problems with Quality Control Costly If at the end of Production process – too late Inconsistent Inspections Done by Inspectors rather than workers themselves
Example • A luggage manufacturer has a quality assurance and quality control team. The quality control team detects that the wheels on a particular product don't roll very easily and appear to stick. The quality assurance team investigates by engaging reliability engineering experts and operational teams.
Solution • They discover that a supplier has changed the materials in a part in the wheel assembly. Quality assurance escalates to management who push the supplier to fix the problem. The quality assurance team implements a process whereby supplied parts are inspected after delivery by quality control to ensure they conform to specifications.
Advantages of quality control Increased sales Most effective utilization of resources Satisfaction of consumers Encourages quality consciousness Better methods of production Reduction in production cost
Improved employer-employee relations Uniform Products Increased goodwill Reduction in inspection costs Effective advertisement Higher morale of employees
Methods Of Quality Control Inspection Statistical Quality Control(SQC)
INSPECTION • Inspection is the commonly used method of quality control. • The quality of a product or service is measured against the predetermined standards. • The items which are comparable to the standards are accepted and others are rejected. According to Kimball, “Inspection is the process of measuring the qualities of a product or service in terms of established standards. ”
Sampling Inspection Versus Total Inspection 100 per cent inspection gives more protection against defective items being passed on to customers than partial or sampling inspection. In certain cases every part is inspected called 100% inspection, when it is less than 100% it is called partial or sampling inspection. Parts with high value and those having tendency to run in to large no. of rejects are normally subject to 100% inspection. Sampling inspection is justified when the lot size is very high. In sampling inspection the sampling method & sampling size are important decisions.
Necessity of Inspection is required because of the fact that whatever may be the care exercised, some defects are bound to occur. It is concerned with four qualities of the product, i. e. , (i) functional efficiency (ii) dimensions (iii) appearance (iv) durability.
CONT. Its important purposes, therefore, are: § Establishment of standards & ensuring conformity with such standards. § Identification of factors contributing to deviations like faulty design, machine malfunction, bad workmanship, faulty materials, etc. § Determination of ‘tolerance’ – i. e. permitted deviations, if any. § To distinguish good lots from bad lots. § Providing mgt data about costs of deviation, the effect on deliveries, etc.
Categories Of Inspection Ø Inspection of raw materials Ø Inspection of WIP Ø Inspection of finished goods
Objectives of inspection • The major objective of inspection is the prevention of defects. • To segregate those products which do not conform to the standards. • It helps in finding out the reasons for low quality or rejection of goods. This allows the management to take corrective measures to reduce the defective goods in future. • The quality standards of manufacturing processes, raw material and work- in- progress are also controlled. • To ensure economic production of products of uniform quality acceptable to the customer.
Cost Of Inspection is a very expensive process. As such it must be planned so as to keep its costs to a minimum while giving maximum inspection coverage. To achieve this mgt has to: Plan the inspection to suit each job. Supply proper and correct measuring devices. Carefully choose and train properly the personnel required. Ensure that specifications and drawings are correct and up-to -date. Provide each inspector with copies of drawings and specifications. Ensure that tolerances are decided to be as generous as possible. Employ most useful statistical quality control techniques.
Methods Of Inspection q Centralized and Floor Inspection: In floor inspection the inspector is required to move about the manufacturing shops, inspecting parts at the workstations where they are produced. In centralized inspection , several inspectors and their equipments are grouped together in a particular area where the inspection takes place. The parts are inspected and if acceptable, are sent to production area for the next operation. q Central inspection can be preferred in case a high degree of accuracy is not required for the goods produced by the enterprise. To secure maximum economies of inspection central inspection is preferred. q If the product is too heavy or in the case of flow-line production floor inspection is preferred.
Techniques Of Inspection Ø Inspection Policy: Gives a clear -cut picture of the extent of testing of a sample required i. e. whether cent percent or otherwise. Ø Established Standards of Quality: Gives a clear- cut idea regarding dimension, quality, color, etc. Ø Inspection Coverage: Setting out the no. of workers to be covered by each inspector. Ø Methods of Inspection: Chosen by the management. Ø Inspection Records & Reports: Which are to be properly maintained at regular intervals to correctly communicate and document the findings of an inspection.
Organisation Of The Inspection Department • A separate inspection department should be set up. The executive incharge of the inspection department , who may be called Chief Quality Engineer, should be a senior person. • Inspection department should be divided into various sections, (i) process inspection section (ii) completed parts inspection section (iii) incoming goods inspection section (iv) clerical section and (v) statistical section.
Functions Of Inspection Department To ensure that raw materials procured pertain to specific quality standards. The different stages of production process are checked regularly to see that defective parts do not pass on to other stages of manufacturing. To ensure that tools, equipments & machines are of a good quality. The finished product is also checked to see whether these conform to pre-determined standards or not. This will ensure that defective products are not sent for marketing.
CONTENTS • • • Introduction Definition of SQC Characteristics of SQC Causes of variations in SQC Tools of SQC Introduction of quality control charts Methods of quality control charts Quality control charts Acceptance sampling Advantages of SQC References
Introduction • Statistical Quality Control (SQC) is the term used to describe the set of statistical tools used by quality professionals. SQC is used to analyze the quality problems and solve them. • Statistical quality control refers to the use of statistical methods in the monitoring and maintaining of the quality of products & services
Definition “Statistical quality control can be simply defined as an economic and effective system of maintaining and improving the quality of outputs throughout the whole operating process of specification, production and inspection based on continuous testing with random samples. ” YA LUN CHOU
Characteristics of SQC • It is designed to control quality standard of goods produced for marketing. • It is exercised by the producers during the production process to assess the quality of the goods. • Carried out with the help of certain statistical tools like mean chart, range chart , etc. • Designed to determine the variations in quality of the goods and limits of tolerance.
Causes of variations in quality • Assignable causes - causes can be identified and eliminated. For example - defective materials , defective labour , defective machines , etc. • Chance causes - takes place as per chance , unavoidable. For example - slight differences in process variables like diameter , weight , service , time , temperature.
Tools of statistical quality control SQC QUALITY CONTROL CHARTS ACCEPTANCE SAMPLING
Quality control charts Ø Quality control refers to the ways and means by which quality standards are maintained. Ø And the aim of quality control is to improve the quality of the products and eliminate bad quality of products. Ø Control chart helps to interpret and tell the production manager at a glance whether or not the process is in control i. e. , within tolerance limit.
Walter A. Shewhart (1891 -1967) ØQuality control charts introduced in 1820 ØThe father of statistical quality control. ØThe originator of the control charts.
• It is a graphic presentation of expected variations in quality. • There are two lines on each graph which indicate the tolerance limits within which the variations of quality will be permitted. • Centre line known as average line is drawn on a chart • Two lines one called upper control limit(UCL) and the other called lower control limit, (LCL) are drawn above and below the average line resp.
Control charts
Types of quality control charts Quality control charts variables Ẍ chart attributes R chart P chart Np chart C chart
Quality Control charts for variables • These charts are used when the quality or characteristics of a product is capable of being measured such as : • weight , diameter, thickness and temperature.
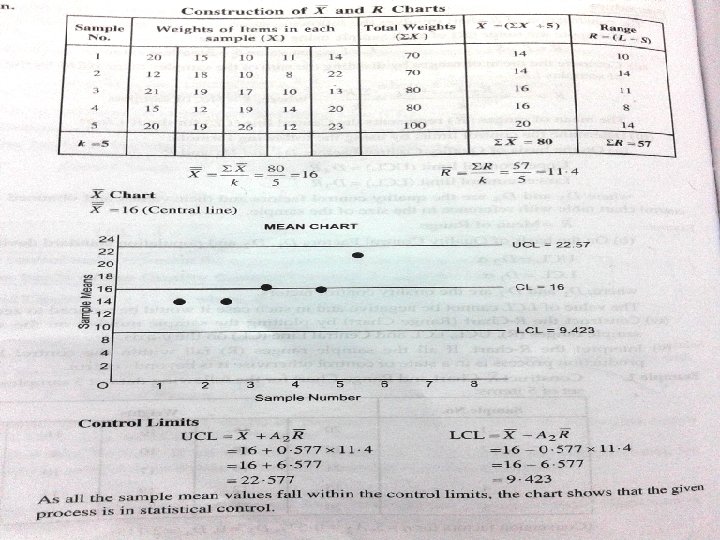
Mean chart • X bar-Chart (or Mean Chart) : this chart is constructed for controlling the variations in the average quality standard of the products in production process.
Formula
QUESTION
Range chart • The range chart is constructed for controlling the variation in the dispersion or variability of the quality standard of the products in a production process.
Formula
Range chart
Quality Control charts for attributes Ø These charts are used when the quality or characteristics of a product cannot be measured in quantitative form and the data is studied on the basis of totality of attributes like defective and non – defective. P chart Attributes Np chart C chart
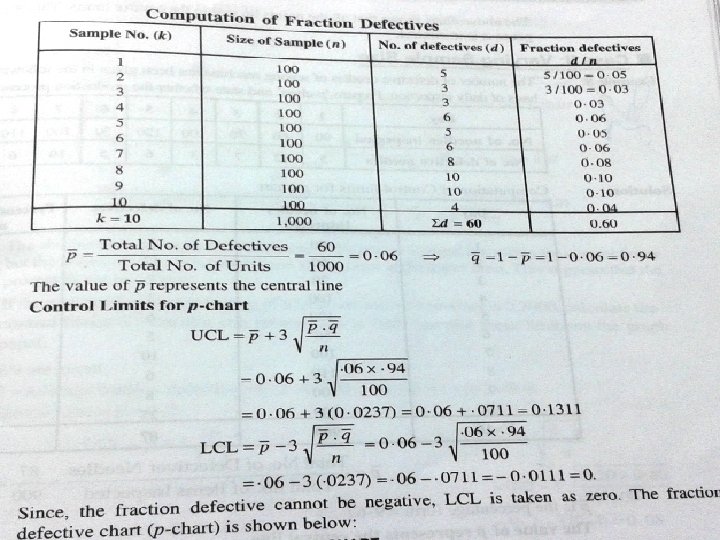
P - chart (or Fraction defective chart) This chart is constructed to measure the proportion of items in a sample that are defective.
Formula
Question
P chart
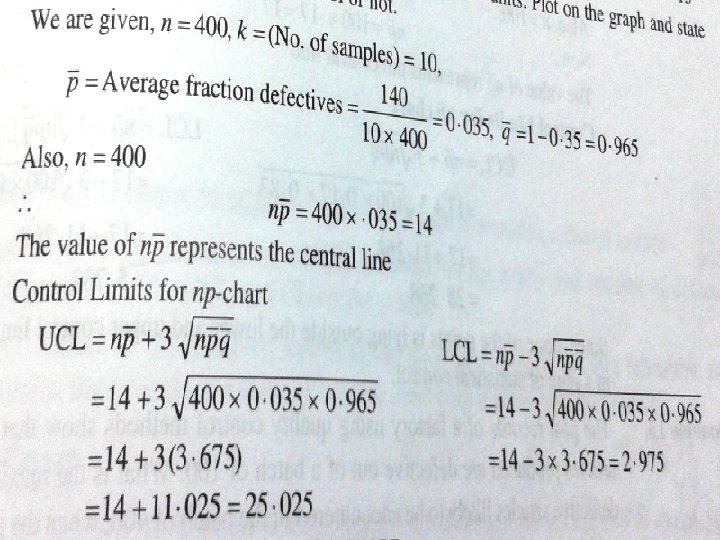
Np- chart (or number of defective chart) Ø This chart is constructed for controlling the quality standard of attributes in a process where the sample size is equal and it is required to plot the number of defective (Np) in samples instead of fraction defective (p).
Formula • np= Total no. of defectives= Ʃd Total no. of samples k
Question
Np chart
C -chart (or number of defects per unit chart) Ø C-chart helps to ascertain the number of defects in the sample. If the number of such defects are within specified limit, the product is accepted otherwise rejected.
Formula
Question
C-chart
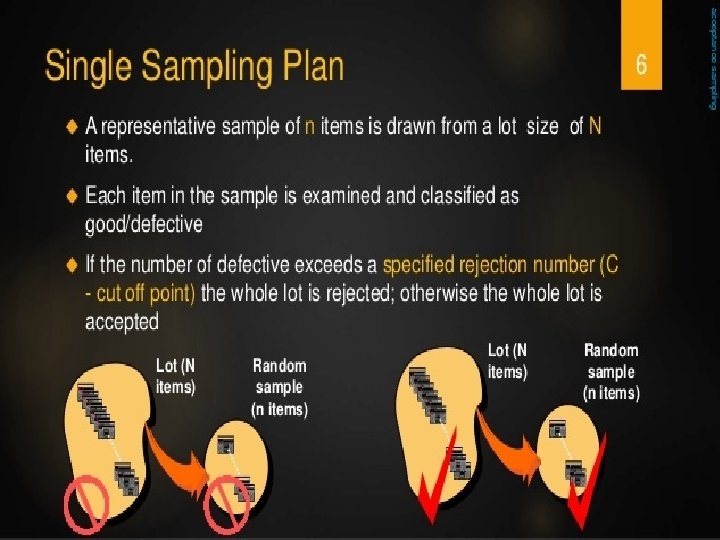
Acceptance sampling • The process of randomly inspecting a certain number of items from a lot or batch in order to decide whether to accept or reject the entire batch.
Cont. . • Acceptance sampling is performed either before or after the process rather than during. -Sampling before typically is done to supplier material -Sampling after involves sampling finished items before shipment or finished components prior to assembly
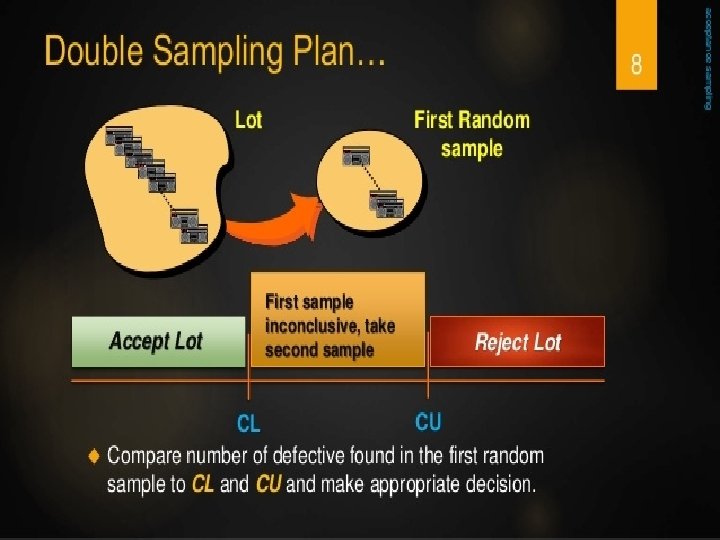
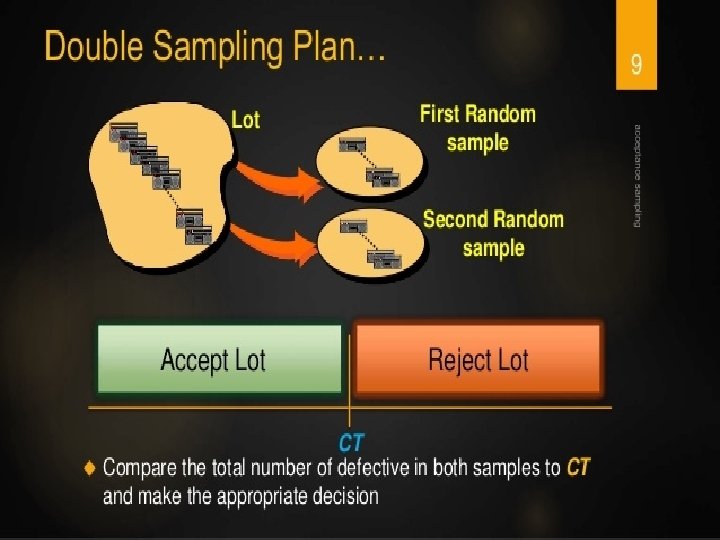
Sampling plans • Sampling plans specify sample size lot size number of samples and acceptance/rejection criteria. Single sampling plan Double sampling plan Multiple sampling plan