
Quality Control Using Easy QC MetaAnalysis in METAL


- Slides: 24
Quality Control Using Easy. QC & Meta-Analysis in METAL Meike Bartels & Bart Baselmans
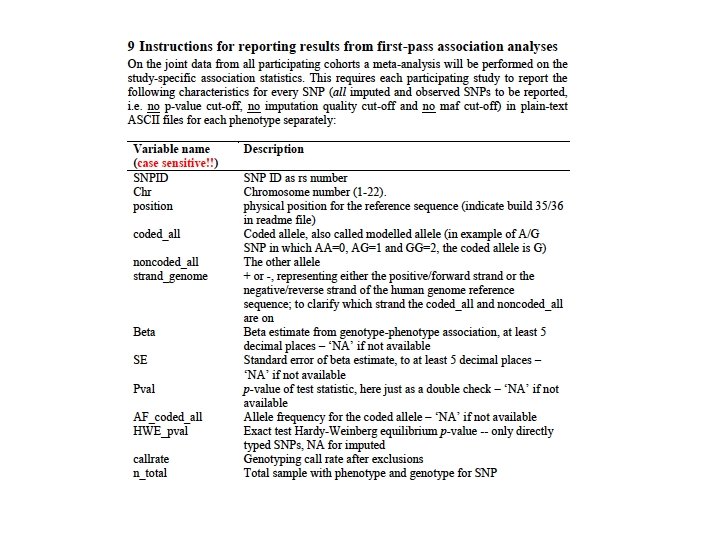
GWAMA • Large Collaborative Studies to increase sample size • Different Cohorts run their own GWA and upload summary statistics • To make these projects successful and trustworthy, we need rigorous organisation AND quality control (QC)
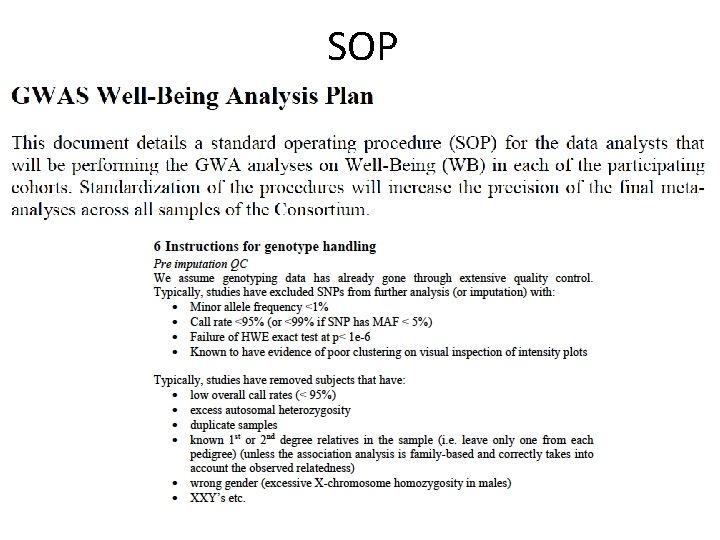
SOP
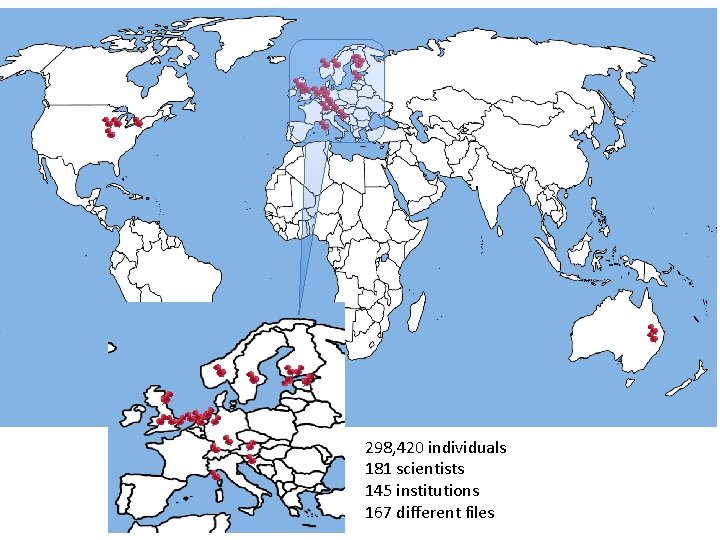
298, 420 individuals 181 scientists 145 institutions 167 different files
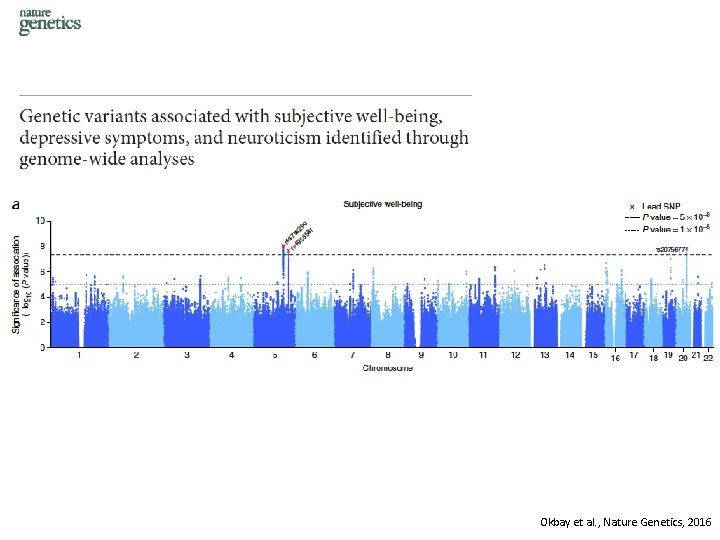
Okbay et al. , Nature Genetics, 2016
Easy. QC • For the well-being GWAMA, we used Easy. QC for QC-ing the GWAS summary statistics • Positive experience because it provides guidelines how to perform QC at the: – At the study file level – The meta-file level – And the meta-analysis OUTPUT level
What needs to be detected • File name errors -> sounds simple doesn’t it, but with 167 files it is essentiel that all files can be traced back to a specific cohort • Incorrect specification of the Phenotype • Flipped alleles • Duplicated SNPs • Bad imputation quality • Association issues from incorrect analysis models – Population stratification – Improper model adjustments – Unaccounted relatedness of individuals
These errors • Limit the contribution of a specific cohort to the meta-analysis or • Inflate the number of type I errors <- DANGER!!
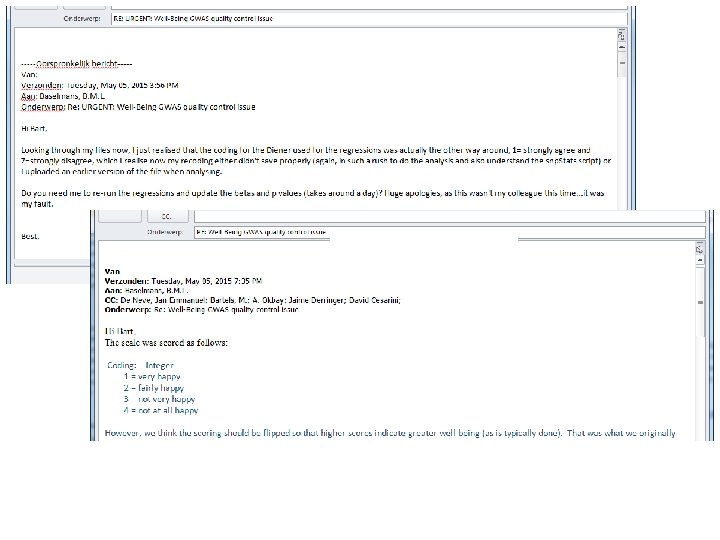
Descriptive Summary Statistics • Participating cohorts were asked to complete a descriptive statistics summary file for their sample – 8 cohorts did not specify their question, or did not report the distribution of the question (no categories specified) – 3 cohorts that actually gave lower values to higher wellbeing (reversed coding) – 8 cohorts that did not map the categories to numeric values, but where the first option was higher wellbeing (suspicious reversed coding)
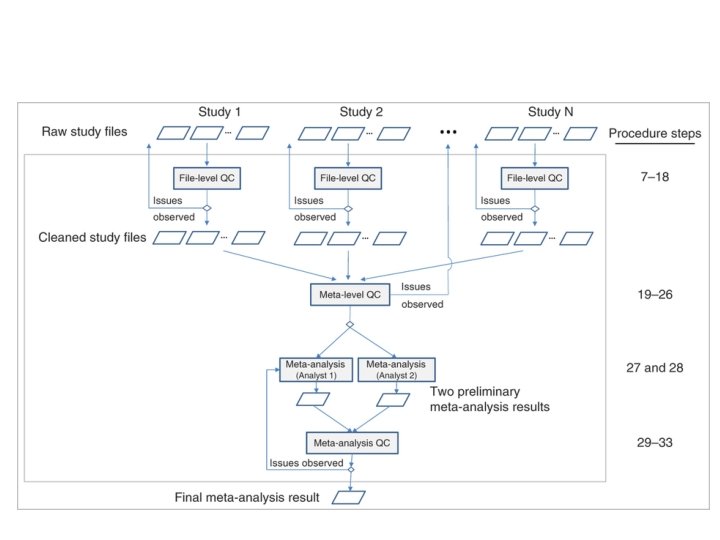
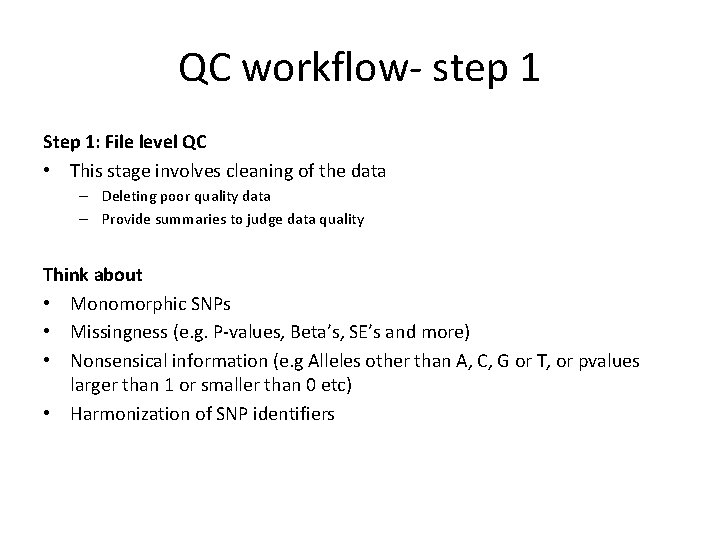
QC workflow- step 1 Step 1: File level QC • This stage involves cleaning of the data – Deleting poor quality data – Provide summaries to judge data quality Think about • Monomorphic SNPs • Missingness (e. g. P-values, Beta’s, SE’s and more) • Nonsensical information (e. g Alleles other than A, C, G or T, or pvalues larger than 1 or smaller than 0 etc) • Harmonization of SNP identifiers
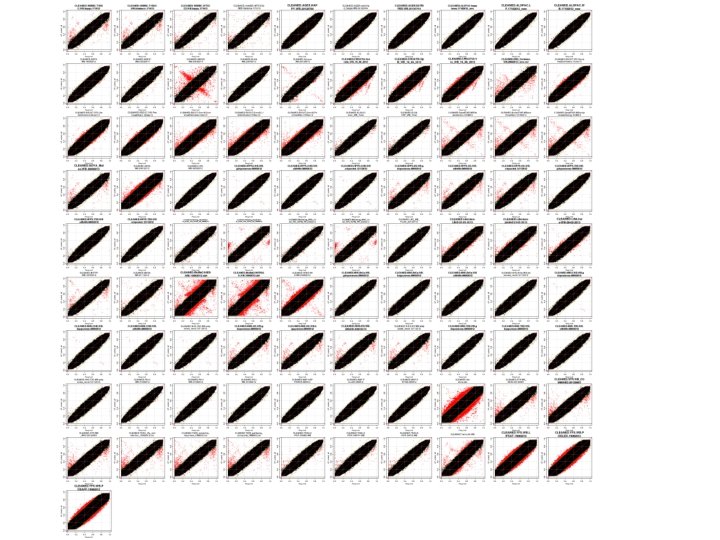
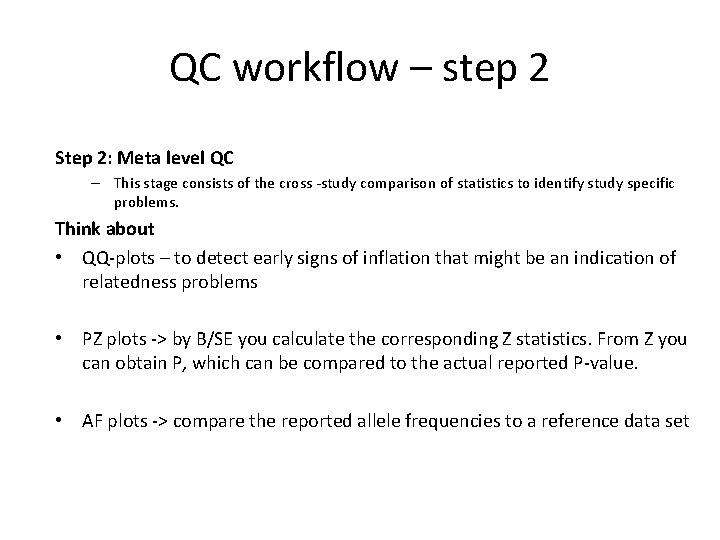
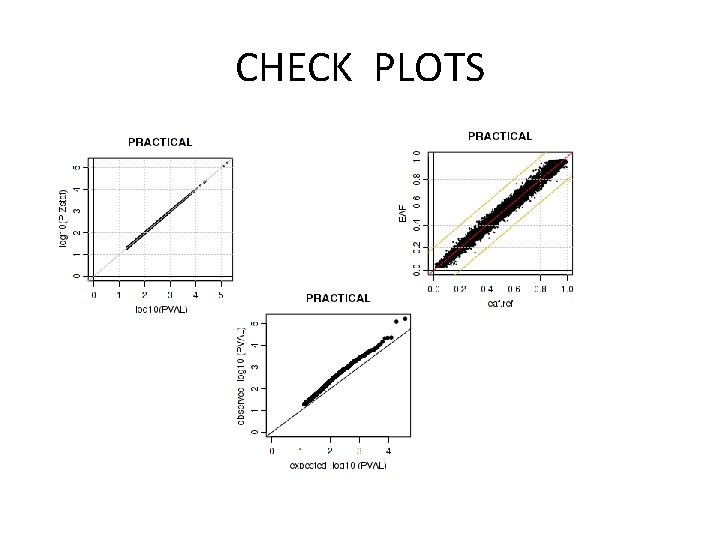
QC workflow – step 2 Step 2: Meta level QC – This stage consists of the cross -study comparison of statistics to identify study specific problems. Think about • QQ-plots – to detect early signs of inflation that might be an indication of relatedness problems • PZ plots -> by B/SE you calculate the corresponding Z statistics. From Z you can obtain P, which can be compared to the actual reported P-value. • AF plots -> compare the reported allele frequencies to a reference data set
QC workflow – step 3 Compare results with the other data-analyst and resolve any issues remaining
Practical today Focus on Step 1 and Step 2
faculty/meike/2017/Easy. QC faculty/meike/2017/Metal
EASY QC Practical Write down on the whiteboard • • Number of removed indels Number of removed badly imputed SNPS How many SNPs not in reference set? How many SNPs with MAF below threshold?
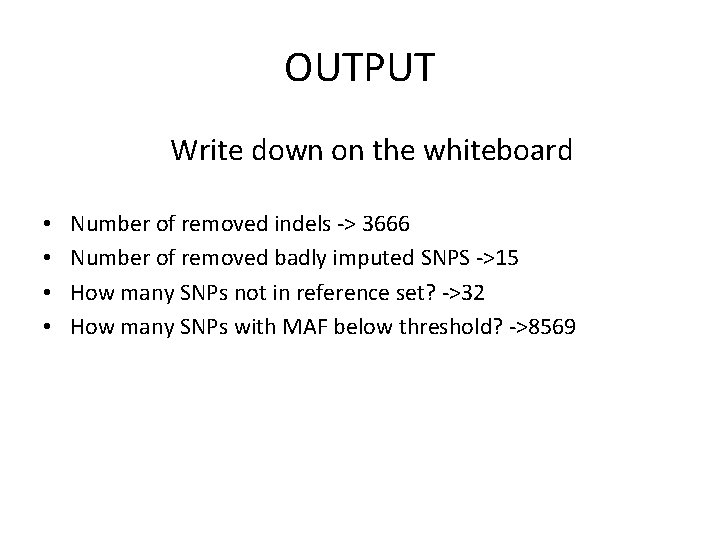
OUTPUT Write down on the whiteboard • • Number of removed indels -> 3666 Number of removed badly imputed SNPS ->15 How many SNPs not in reference set? ->32 How many SNPs with MAF below threshold? ->8569
CHECK FINAL DATA The cleaned file Zless CLEANED. PRATICAL. gz | head | column -t
CHECK PLOTS
CHECK OUTPUT SUMMARY • • • Check. rep file You open this file in excel-like programms Import second and third column 2 nd: number of SNPs in input file 3 rd: number of SNPs that survived your QC Check also other columns