Quality Control Quality control Appraisal Prevention Inspection Statistical
 Control charts -")


 Control charts -")


 Control charts -")


 Control charts -")


- Slides: 50
Quality Control Quality control Appraisal Prevention Inspection Statistical Process Control (SPC) Control charts - Variables charts (x-chart, R-chart) - Attributes charts (p-chart, c-chart) Run tests - Median test - Up/down test
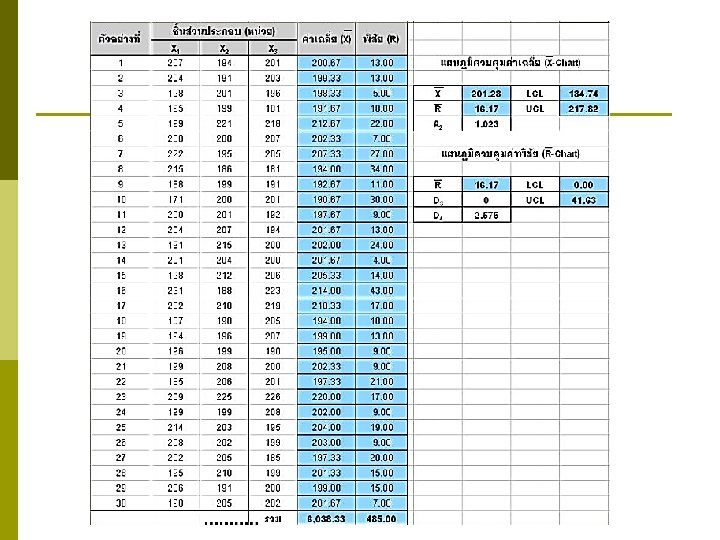
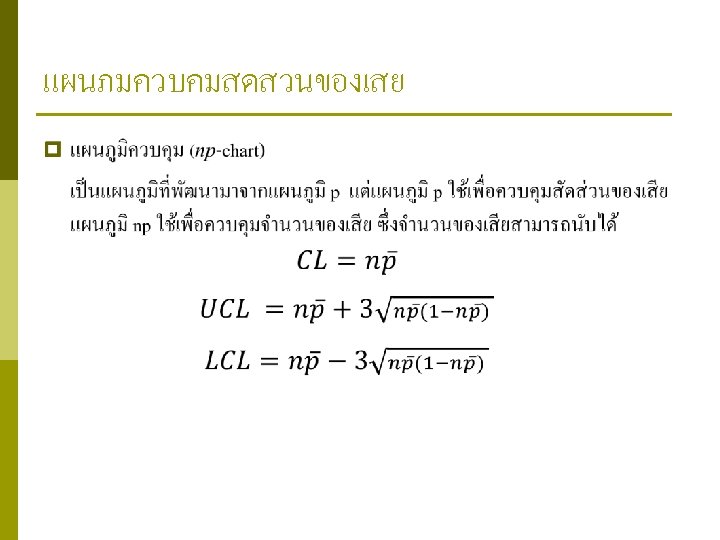
ร Control Chart for Variable p
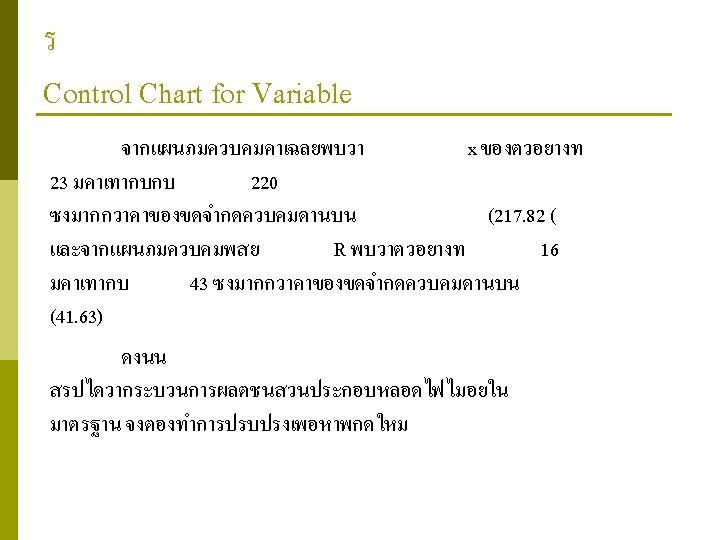
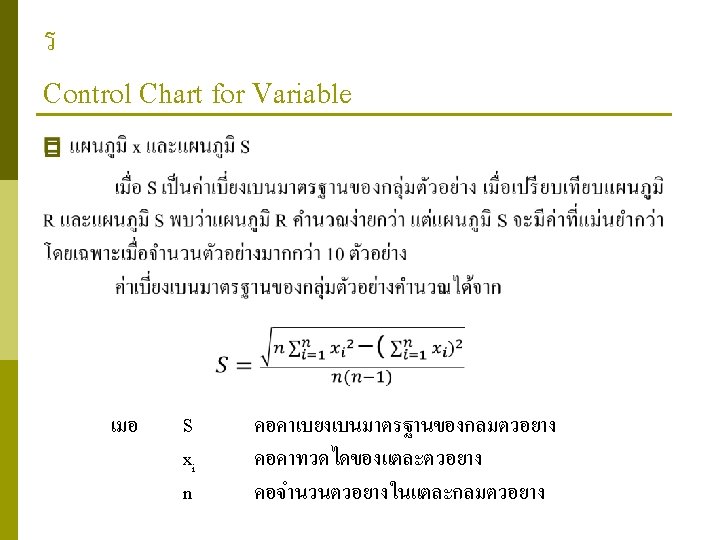
ร Control Chart for Variable
ร Control Chart for Variable
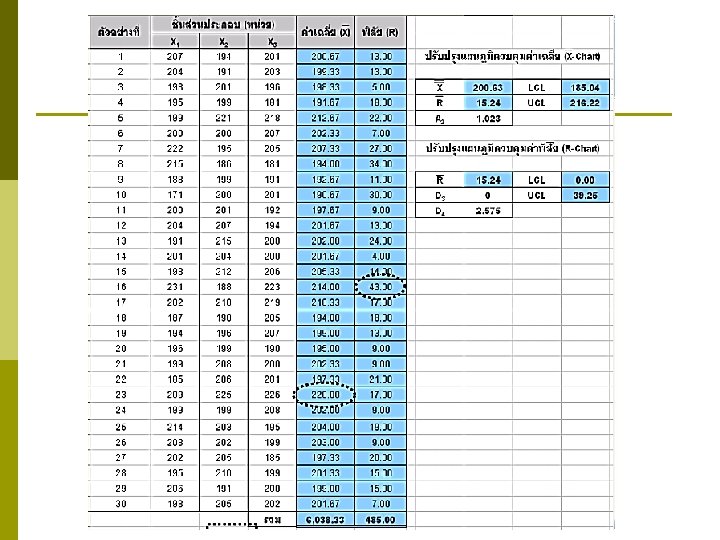
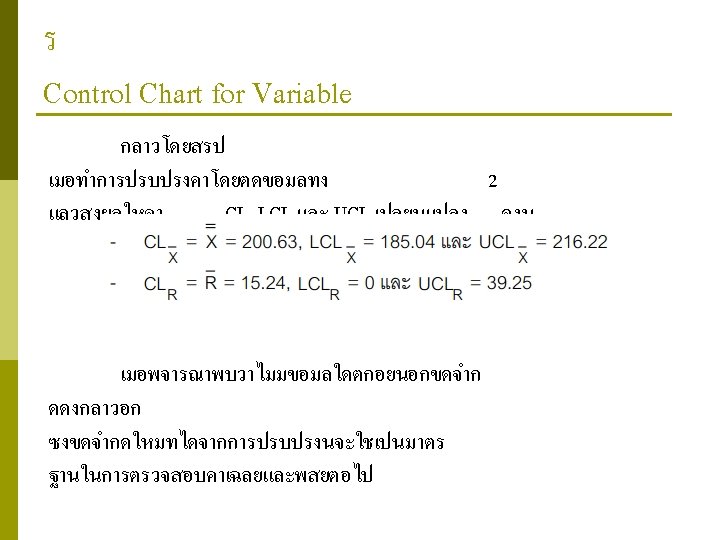
ร Control Chart for Variable
ร Control Chart for Variable
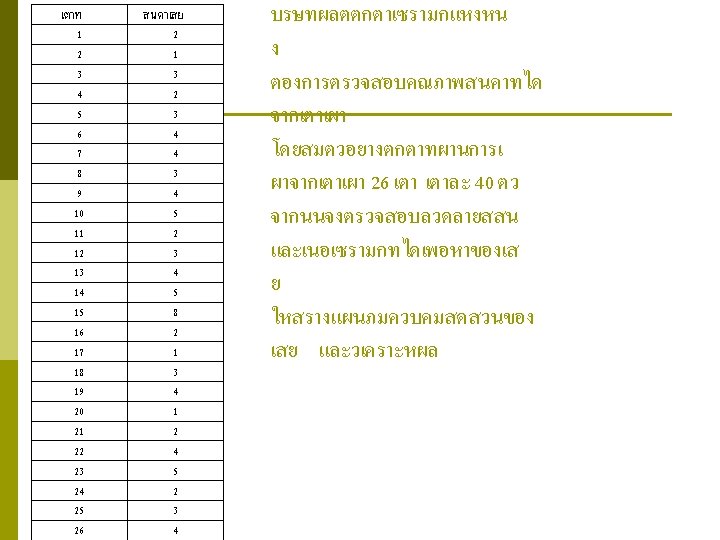
Exercise จากขอมลของความหนาจานเบรกทเกบจากสายการผลตวนละ ครงคอตอนเชาและตอนบาย สำหรบ 12 วนทำงาน แสดงดงน 1 1. 028 1. 030 1. 025 9 1. 025 1. 033 1. 020 1. 024 17 1. 036 1. 038 1. 034 2 1. 026 1. 019 1. 030 10 1. 025 1. 031 1. 020 1. 021 18 1. 039 1. 041 1. 043 1. 039 3 1. 027 1. 028 1. 025 1. 026 11 1. 016 1. 020 1. 034 0. 997 19 1. 037 1. 021 1. 024 4 1. 028 1. 030 12 0. 998 1. 022 1. 018 1. 036 20 1. 031 1. 028 1. 038 1. 023 5 1. 015 1. 028 1. 043 1. 020 13 1. 025 1. 031 1. 025 21 1. 014 1. 021 1. 024 6 1. 013 1. 029 1. 037 14 1. 039 1. 025 1. 031 1. 027 22 0. 988 1. 013 0. 997 0. 988 7 1. 027 1. 039 1. 028 1. 029 15 1. 036 1. 024 1. 031 1. 026 23 1. 024 1. 012 1. 013 1. 010 8 1. 020 1. 029 1. 012 1. 025 16 1. 029 1. 032 1. 020 24 1. 013 1. 018 1. 022 1. 019 2 N = 4 A 2 = 0. 729 D 3 = 0 D 4 = 2. 282 จงสรางแผนภมควบคม X-chart และ R-chart พรอมทงปรบปรงแผนภมควบคม โดยถอวาจดทออกนอกแผนภมควบคมสามารถหาสาเหตไดทงหมด
1. 05 Xbar-chart 1. 04 1. 03 1. 02 1. 01 1 0. 99 0. 98 0. 97 1 2 3 4 5 6 7 8 9 10111213141516171819202122232425 0. 04 0. 035 R-chart 0. 03 0. 025 0. 02 0. 015 0. 01 0. 005 0 1 2 3 4 5 6 7 8 9 10111213141516171819202122232425 UCL 1. 036 CL 1. 025 LCL 1. 014 UCL 0. 042 R CL 0. 015 LCL 0 x
กลมตวอย าง 1 2 3 4 5 6 7 8 9 10 11 12 13 14 15 16 17 18 19 20 21 22 23 24 25 คาทวดได 1 35 46 34 69 38 42 44 33 48 47 38 37 40 38 50 33 41 38 33 56 38 39 42 43 39 2 40 37 40 64 34 41 41 41 52 43 41 37 38 39 42 35 40 44 32 55 40 42 39 36 38 3 32 36 34 68 44 43 41 38 49 36 39 41 47 45 43 29 29 28 37 45 45 35 39 35 43 4 33 41 36 59 40 34 46 36 51 42 38 37 35 42 45 39 34 58 38 48 37 40 36 38 44 ขอมลเสนผานศนยกลางก านวาลว x R A 2 0. 729 D 3 0 D 4 2. 282 CL UCL LCL 41 47. 38604 34. 61396 8. 76 19. 99032 0
70 65 Xbar-chart 60 55 50 45 40 35 30 1 2 3 4 5 6 7 8 9 10111213141516171819202122232425 35 30 R-chart 25 20 15 10 5 0 1 2 3 4 5 6 7 8 9 10111213141516171819202122232425 x R CL UCL LCL 41 47. 38604 34. 61396 8. 76 19. 99032 0
Quality Control Quality control Appraisal Prevention Inspection Statistical Process Control (SPC) Control charts - Variables charts (x-chart, S-chart) - Attributes charts (p-chart, c-chart) Run tests - Median test - Up/down test
ร Control Chart for Variable p
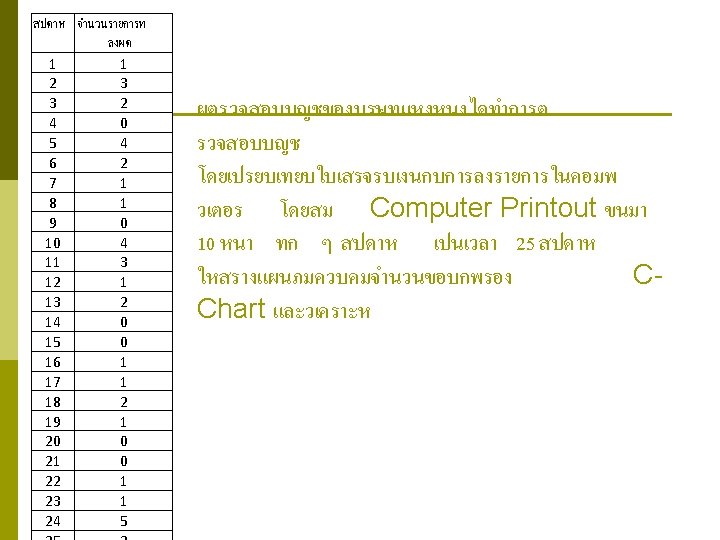
วนท 23 -ธ. ค. 27 -ธ. ค. 28 -ธ. ค. 29 -ธ. ค. 30 -ธ. ค. กลมตวอยาง 1 2 3 4 5 6 7 8 9 10 11 12 13 14 15 16 17 18 19 20 21 22 23 24 25 1 6. 35 6. 46 6. 34 6. 69 6. 38 6. 42 6. 44 6. 33 6. 48 6. 47 6. 38 6. 37 6. 4 6. 38 6. 5 6. 33 6. 41 6. 38 6. 33 6. 56 6. 38 6. 39 6. 42 6. 43 6. 39 คาทวดได 2 6. 4 6. 37 6. 4 6. 64 6. 34 6. 41 6. 52 6. 43 6. 41 6. 37 6. 38 6. 39 6. 42 6. 35 6. 44 6. 32 6. 55 6. 42 6. 39 6. 36 6. 38 3 6. 32 6. 36 6. 34 6. 68 6. 44 6. 43 6. 41 6. 38 6. 49 6. 36 6. 39 6. 41 6. 47 6. 45 6. 43 6. 29 6. 28 6. 37 6. 45 6. 35 6. 39 6. 35 6. 43 4 6. 33 6. 41 6. 36 6. 59 6. 4 6. 34 6. 46 6. 36 6. 51 6. 42 6. 38 6. 37 6. 35 6. 42 6. 45 6. 39 6. 34 6. 58 6. 38 6. 48 6. 37 6. 4 6. 36 6. 38 6. 44 ขอมลเสนผานศนยกลางกานวาลว ท n=4 A 3 B 4 1. 628 0 2. 266
วนท 23 -ธ. ค. 27 -ธ. ค. 28 -ธ. ค. 29 -ธ. ค. 30 -ธ. ค. กลมตวอ ยาง 1 2 3 4 5 6 7 8 9 10 11 12 13 14 15 16 17 18 19 20 21 22 23 24 25 1 6. 35 6. 46 6. 34 6. 69 6. 38 6. 42 6. 44 6. 33 6. 48 6. 47 6. 38 6. 37 6. 4 6. 38 6. 5 6. 33 6. 41 6. 38 6. 33 6. 56 6. 38 6. 39 6. 42 6. 43 6. 39 คาทวดได 2 6. 4 6. 37 6. 4 6. 64 6. 34 6. 41 6. 52 6. 43 6. 41 6. 37 6. 38 6. 39 6. 42 6. 35 6. 44 6. 32 6. 55 6. 42 6. 39 6. 36 6. 38 3 6. 32 6. 36 6. 34 6. 68 6. 44 6. 43 6. 41 6. 38 6. 49 6. 36 6. 39 6. 41 6. 47 6. 45 6. 43 6. 29 6. 28 6. 37 6. 45 6. 35 6. 39 6. 35 6. 43 4 6. 33 6. 41 6. 36 6. 59 6. 4 6. 34 6. 46 6. 36 6. 51 6. 42 6. 38 6. 37 6. 35 6. 42 6. 45 6. 39 6. 34 6. 58 6. 38 6. 48 6. 37 6. 4 6. 36 6. 38 6. 44 คาเฉล ย 6. 35 6. 40 6. 36 6. 65 6. 39 6. 40 6. 43 6. 37 6. 50 6. 42 6. 39 6. 38 6. 40 6. 41 6. 45 6. 34 6. 36 6. 42 6. 35 6. 51 6. 40 6. 39 6. 38 6. 41 คาเบยงเบ น 0. 036 0. 045 0. 028 0. 045 0. 042 0. 041 0. 024 0. 034 0. 018 0. 045 0. 014 0. 020 0. 051 0. 032 0. 036 0. 042 0. 056 0. 125 0. 029 0. 054 0. 036 0. 029 0. 024 0. 036 0. 029
6. 75 6. 65 6. 55 6. 45 6. 35 6. 25 6. 15 1 2 3 4 5 6 7 8 9 10111213141516171819202122232425 x 0. 14 S 0. 12 0. 1 0. 08 0. 06 0. 04 0. 02 0 1 2 3 4 5 6 7 8 9 10111213141516171819202122232425 UCL 6. 47 CL 6. 41 LCL 6. 35 UCL 0. 089 CL 0. 039 LCL 0
Quality Control Quality control Appraisal Prevention Inspection Statistical Process Control (SPC) Control charts - Variables charts (x-chart, R-chart) - Attributes charts (p-chart, c-chart) Run tests - Median test - Up/down test
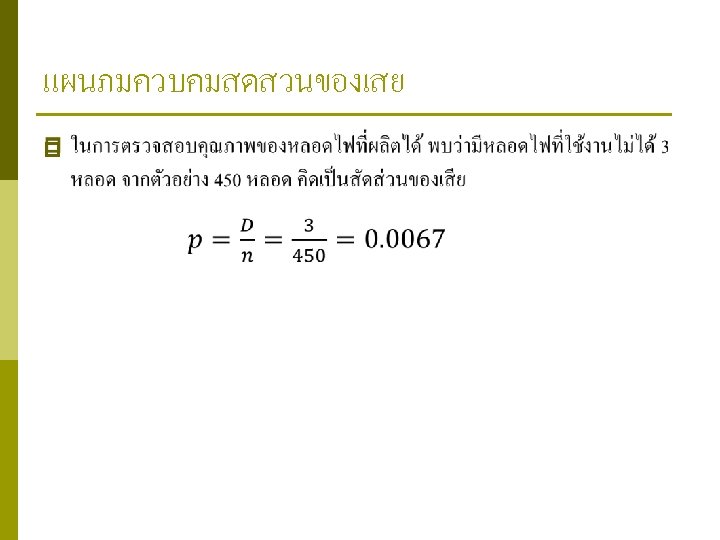
กลมตวอย างท 1 2 3 4 5 6 7 8 9 10 11 12 13 14 15 16 17 18 19 20 21 22 23 24 25 จำนวนตวอย าง 300 300 300 300 300 300 300 จำนวนของเส สดสวนของเ ย สย 12 0. 040 3 0. 010 9 0. 030 4 0. 013 0 0. 000 6 0. 020 1 0. 003 8 0. 027 11 0. 037 2 0. 007 10 0. 033 9 0. 030 3 0. 010 0 0. 000 5 0. 017 7 0. 023 8 0. 027 16 0. 053 2 0. 007 5 0. 017 6 0. 020 0 0. 000 3 0. 010 2 0. 007 ผลการตรวจสอบไอซของคนงานกะ 1 แผนกผลตระหวางวนท 1 -31 มกราคม
แผนภมควบคมสดสวนของเสย UCLp = 0. 041 CLp = 0. 018 LCLp = -0. 005 = 0 0. 06 0. 05 0. 04 0. 03 0. 02 0. 01 0 1 2 3 4 5 6 7 8 9 10111213141516171819202122232425
ขอมลผลการตรวจสอบกระทะลอรถยนตทผลตได กลมตวอย จำนวนตวอยา าง ง จำนวนของเสย 1 2385 47 2 1451 18 3 1935 74 4 2450 42 5 1997 39 6 2168 52 7 1941 47 8 1962 34 9 2244 29 10 1238 39 11 2289 45 12 1464 26 13 2061 47 14 1667 34 15 2350 31 16 2354 38 17 1509 28 18 2190 30 19 2678 113 20 2252 58 21 1641 52 22 1782 19 23 1993 30 24 2382 17 สดสวนของเส ย 0. 020 0. 012 0. 038 0. 017 0. 020 0. 024 0. 017 0. 013 0. 032 0. 020 0. 018 0. 023 0. 020 0. 013 0. 016 0. 019 0. 014 0. 042 0. 026 0. 032 0. 011 0. 015 0. 007 p การสรางแผนภม p เมอจำนวนตวอยางไม คงท
กลมต วอยาง 1 2 3 4 5 6 7 8 9 10 11 12 13 14 15 16 17 18 19 20 21 22 23 24 25 จำนวนต วอยาง 2385 1451 1935 2450 1997 2168 1941 1962 2244 1238 2289 1464 2061 1667 2350 2354 1509 2190 2678 2252 1641 1782 1993 2382 2132 จำนวนของเ สดสวน สย ของเสย 47 0. 020 18 0. 012 74 0. 038 42 0. 017 39 0. 020 52 0. 024 47 0. 024 34 0. 017 29 0. 013 39 0. 032 45 0. 020 26 0. 018 47 0. 023 34 0. 020 31 0. 013 38 0. 016 28 0. 019 30 0. 014 113 0. 042 58 0. 026 52 0. 032 19 0. 011 30 0. 015 17 0. 007 46 0. 022 UCL 0. 029 0. 031 0. 030 0. 028 0. 029 0. 030 0. 029 0. 032 0. 029 0. 031 0. 029 0. 030 0. 029 0. 031 0. 029 0. 028 0. 029 0. 030 0. 029 LCL 0. 011 0. 009 0. 010 0. 012 0. 011 0. 010 0. 011 0. 008 0. 011 0. 009 0. 011 0. 010 0. 011 0. 009 0. 011 0. 012 0. 011 0. 010 0. 011
0. 045 0. 04 0. 035 0. 03 0. 025 0. 02 0. 015 0. 01 0. 005 0 กลมต วอยาง 1 2 3 4 5 6 7 8 9 10 11 12 13 14 15 16 17 18 1 2 3 4 5 6 7 8 9 10111213141516171819202122232425 19 20 21 22 23 24 25 สดสวน ของเสย 0. 020 0. 012 0. 038 0. 017 0. 020 0. 024 0. 017 0. 013 0. 032 0. 020 0. 018 0. 023 0. 020 0. 013 0. 016 0. 019 0. 014 0. 042 0. 026 0. 032 0. 011 0. 015 0. 007 0. 022 UCL 0. 029 0. 031 0. 030 0. 028 0. 029 0. 030 0. 029 0. 032 0. 029 0. 031 0. 029 0. 030 0. 029 0. 031 0. 029 0. 028 0. 029 0. 030 0. 029 LCL 0. 011 0. 009 0. 010 0. 012 0. 011 0. 010 0. 011 0. 008 0. 011 0. 009 0. 011 0. 010 0. 011 0. 009 0. 011 0. 012 0. 011 0. 010 0. 011
วนท 1 3 4 5 6 7 8 10 11 12 13 14 15 17 18 19 20 21 22 24 25 26 27 28 29 จำนวนรอยต ำหน 7 6 6 3 22 8 6 1 0 5 14 3 1 3 2 7 5 7 2 8 0 4 14 4 3 แผนภมควบคมรอยตำหน c จำนวนรอยตำหนทพบบนแผนกระเบองเคลอบ 25 20 15 10 5 0 1 2 3 4 5 6 7 8 9 10 11 12 13 14 15 16 17 18 19 20 21 22 23 24 25 26 27 28 29 30 CLc UCLc LCLc 5. 64 12. 76 1. 48 -= 0
วนท 13 14 15 16 17 20 21 22 23 24 27 28 29 30 1 4 5 6 7 8 11 12 13 14 จำนวนของเส จำนวนรอยตำ ย หน 45 36 45 48 45 45 45 68 45 77 45 56 45 58 45 67 45 38 45 74 45 69 45 54 45 56 45 52 45 47 45 64 45 61 45 66 45 37 45 59 45 38 45 41 45 68 จำนวนรอยตำหนต อหนวย 0. 80 1. 07 1. 00 1. 51 1. 71 1. 24 1. 29 1. 49 0. 84 1. 64 1. 53 1. 20 1. 24 1. 16 0. 93 1. 04 1. 42 1. 36 1. 47 0. 82 1. 31 0. 84 0. 91 1. 51 สอบเครองรบวทยจากการผล ต โดยสมตวอยางวนละ เครอง CLu UCLu LCLu 1. 24 1. 74 0. 74 45
CLu UCLu LCLu 1. 24 1. 74 0. 74 1. 9 1. 7 1. 5 1. 3 1. 1 0. 9 0. 7 0. 5 1 2 3 4 5 6 7 8 9 101112131415161718192021222324252627282930
Quality Control Quality control Appraisal Prevention Inspection Statistical Process Control (SPC) Control charts - Variables charts (x-chart, R-chart) - Attributes charts (p-chart, c-chart) Run tests - Median test - Up/down test
Run-test: Median test คาเฉล ย UCL = 5. 307 CL = 4. 991 LCL = 4. 675 A A B B A B A A B A p
Run-test: Up/down test คาเฉล ย UCL = 5. 307 CL = 4. 991 LCL = 4. 675 D D U U D U U D U D D U
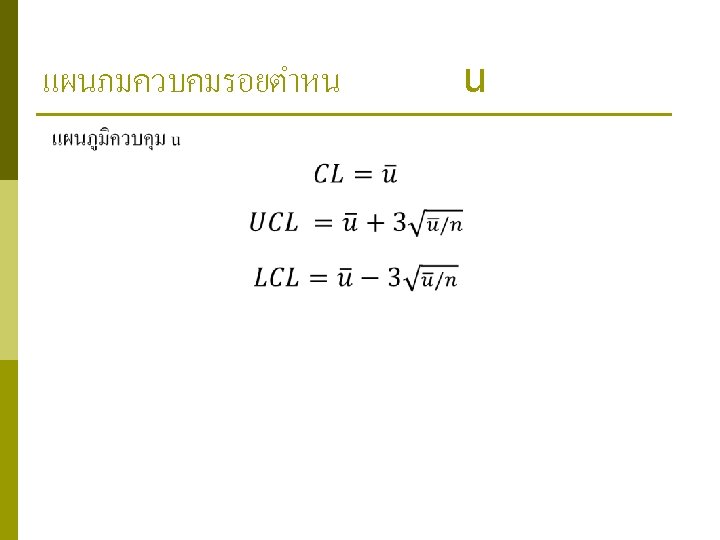
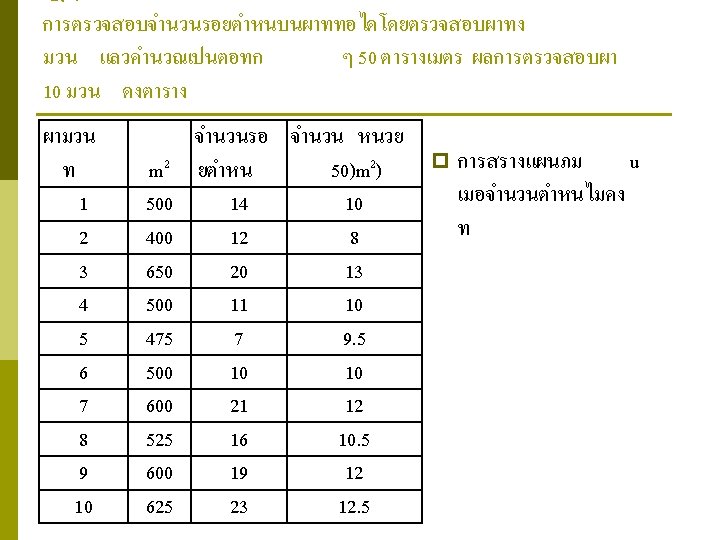
ผามวนท 1 2 3 4 5 6 7 8 9 10 m 2 500 400 650 500 475 500 600 525 600 625 จำนวนรอยตำหน จำนวนหนวย 50)m 2) 10 8 13 10 9. 5 10 12 10. 5 12 12. 5 14 12 20 11 7 10 21 16 19 23 u 1. 40 1. 54 1. 10 0. 74 1. 00 1. 75 1. 52 1. 58 1. 84 UCLu 2. 56 2. 69 2. 42 2. 56 2. 58 2. 56 2. 46 2. 53 2. 46 2. 44 3. 00 2. 50 2. 00 u 1. 50 UCL LCL 1. 00 0. 50 0. 00 0 2 4 6 8 10 12 LCLu 0. 29 0. 16 0. 43 0. 29 0. 26 0. 29 0. 32 0. 39 0. 41