Quality Control Internal QC External QC Internal quality


 CV = (S/X )100% Coefficient of variation describes the standard")


 but")


- Slides: 28
Quality Control Internal QC External QC
▪Internal quality control: -Monitors a test's method precision and analytical bias. -Preparation of quality control samples and their interpretation which is handled within the laboratory.
External quality control: Involves the estimation of the test methods accuracy by the analysis of unknown samples sent to the laboratory from outside sources. the samples are sent to the laboratory where thy analyzed and returned to the agency that supplied the results.
control material: § Specimen or solution which is analyzed for quality control purposes § This specimen is treated as if it was were a patient sample by being exposed to the same conditions as the patient sample, as incubation time, temperature, …etc. § the range of values for the control specimen is usually predetermined, and any deviation from the range indicates a loss of the test method accuracy and/ or precision
Characteristics of control material Control materials should have § The composition should be as similar to the patient sample. § The analyte concentration should be at medically significant level. § The concentration should be stable under storage for long period of time. § Material should be low vial-to- vial variability. § After vial has been opened and material prepared, it should remain stable for the period of use. § The material should be reasonably priced (Not expensive).
Standard specimen § A substance that can be accurately weighed or measured to produce a solution of an exactly known concentration. § Primary standard: A reference material that is of fixed and known composition and capable of being prepared in essentially pure form; also, any certified reference material that is generally accepted or officially recognized as the unique standard for the assay, regardless of it is level of purity. § Secondary standard: A reference material in which the analyte concentration has been ascertained by reference to a primary standard.
What statistics need to be calculated to establish my own control limits? 1 -Mean. 2 -Standard deviation. 3 -Coffecient of variation.
x is the mean xi is an individual measurement ∑ is the operation of summation n is the number of xi values in the group.
What does the mean tell me about method performance? Any change in accuracy, such as a systematic shift or drift, would be reflected in a change in the mean value of the control. Always keep in mind that the mean is related to accuracy or systematic error.
standard deviation or
What does the standard deviation tell about method performance?
standard deviation is a measure of the width of the distribution and is related to imprecision or random error. The bigger the standard deviation, the wider the distribution, the greater the random error, and the poorer the precision of the method.
coefficient of variation (CV) CV = (S/X )100% Coefficient of variation describes the standard deviation as a percentage of the mean.
Why is a CV useful? Because the CV reflects a ratio of the standard deviation to the concentration, it is often provides a better estimate of method performance over a range of concentrations.
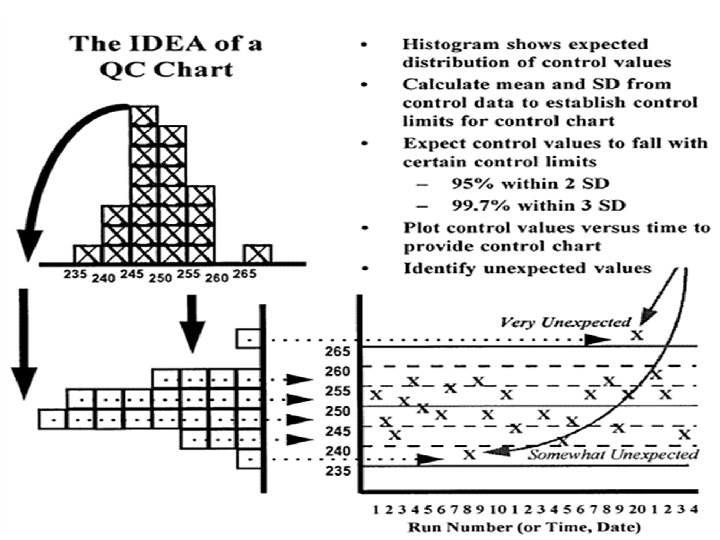
How do you calculate control limits? control limits are calculated: X ± 2 SD For cholesterol where a control material has a mean of 200 mg/d. L and a standard deviation of 4 mg/d. L, the 2 s control limits would be 192 and 208 mg/d. L,
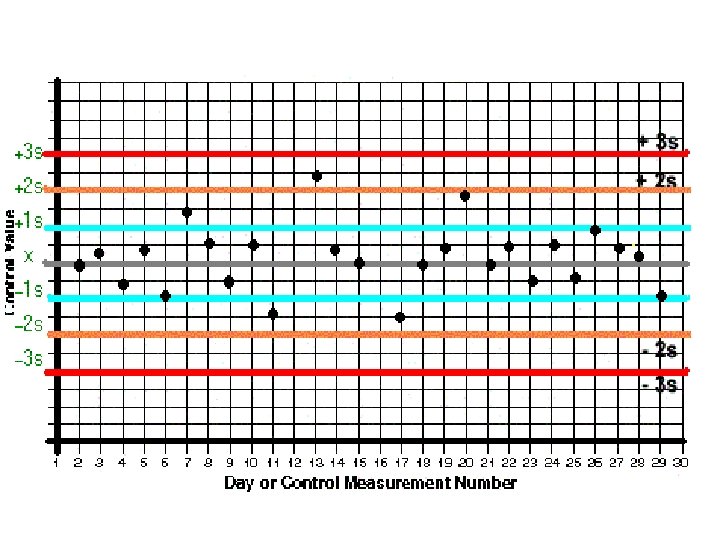
Quality control charts Control charts are used to routinely monitor quality
Shewart or Levey Jenings charts: Is the most reliable type of QC. Chart, now we will show to use it: A- selected appropriate control materials B- analyzed those materials to characterize method performance by collecting a minimum of 20 measurements over at least 10 days C- calculated the mean and standard deviation of those data
Shift Is defined as a drift of values from one level of the control chart to another, which may be sudden or gradual and may be due to failure to recalibrate when changing lot numbers of reagent during an analytical process.
Shift
Trend Is the continuous movements in one direction over six or more consecutive values. Trends are difficult to detect without continual charting, and may start on one side of the mean and move across it or it can occur entirely on one side of the mean this problem is usually due to deterioration of reagents or light source of the instrumentations.
Trend
Dispersion Values may be within the acceptable range (2 s and 3 s) but are unevenly distributed outside the ± 1 s limits. This is indicating a loss of precision and due to random error. A precision problem, or increase in random error, would cause the standard deviation to increase, therefore widening the expected distribution of control
Dispersion
Definition terms § Sensitivity: method sensitivity refers simply to the lowest level of analyte that can be detected by a given method with low CVs. § Specificity: refers to how specific a test is for a certain substance without interferences. §
§ Assay: to analyze a sample of a specimen to determine the amount, activity, or potency of a specific analyte or substance. § Out of control: indicates that the analysis of patient samples is unreliable.
§ Run: a period to time or series of measurements within which accuracy and precision of the measuring system are expected to be stable. § Range: the difference between the largest and smallest observed value of a quantitative characteristic or statistical limits.