Quality Assurance Audits Internal External Reviews Quality Control


 Discuss on quality measures between Service and Manufacturing industry 2) TVS –")


 VOC (Voice of Customer) Affinity Diagram FMEA (Failure")
- Slides: 19
Quality Assurance Audits Internal External Reviews
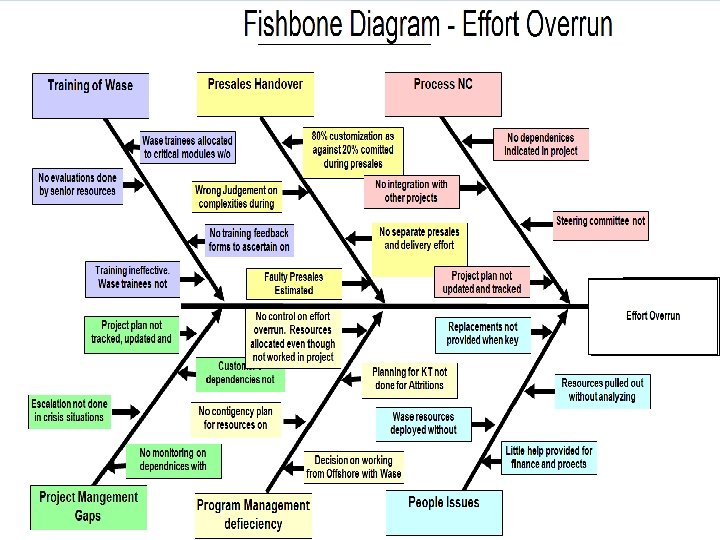
Quality Control Tools and Techniques 1. Cause & Effect Diagram / Fishbone Diagram / Ishikawa Diagram (Finding various sub-causes of each potential cause in effort to find Root Cause of the defect). 2. Histograms 3. Pareto Charts 4. Control Charts 5. Flow Charts 6. Scatter Chart 7. Run Chart
Sample Quality Metrics Metric Name Metric value Root Cause (In Actions taken/ to be (Actual Vs Norms) case of taken Deviation) Remarks Effort Deviation RCA done Schedule Deviation RCA done Requirement Volatility Phase Containment Review Effort Rework Effort PM Effort Testing Effort Defect Density Post Delivery Defects
Acceptance Sampling Definition: the third branch of SQC refers to the process of randomly inspecting a certain number of items from a lot or batch in order to decide whether to accept or reject the entire batch Different from SPC because acceptance sampling is performed either before or after the process rather than during Sampling before typically is done to supplier material Sampling after involves sampling finished items before shipment or finished components prior to assembly Used where inspection is expensive, volume is high, or inspection is destructive Sample Universe
Quality Control Tools and Techniques 1. Control Charts ( X chart, R chart, P chart): This will check defects falling outside LCL or UCL. There will CL (mean) and calculate LCL & UCL. 2. Cause & Effect Diagram / Fishbone Diagram / Ishikawa Diagram (Finding various sub-causes of each potential cause in effort to find Root Cause of the defect).
Control Charts show sample data plotted on a graph with CL, UCL, and LCL Control chart for variables are used to monitor characteristics that can be measured, e. g. length, weight, diameter, time Control charts for attributes are used to monitor characteristics that have discrete values and can be counted, e. g. % defective, number of flaws in a shirt, number of broken eggs in a box © Wiley 2007
Types of Control Charts X chart X & R chart P chart
X-Bar Control Chart
Exercise 1) Discuss on quality measures between Service and Manufacturing industry 2) TVS – TQM case study
Teller Processes Sequence of activities Fatigue Training Too many steps Control functions Attitude Processing Delays Too much downtime Not user friendly Slow response time Computers
Quality Scenarios Sr Scenarios Technique/ Tool 1 Looking at the Project Practice of comparable Projects Benchmarking 2 Measuring 4 doors produced rather than all 400 Statistical Sampling 3 Identifying the factors that influence particular variables of product DOE 4 Analyzing the chart of problems to find the most frequent one in order to determine if processes need to be improved Pareto Chart 5 Comparing the expenses of quality efforts to the return on that investment CB analysis 6 Determine what will be acceptable upper and lower thresholds of variance Control Chart 7 Comparing what was done to what was documented as needing to be done Checklists 8 Selecting 3 projects to refer to out of 12 projects Statistical Sampling 9 Graphically representing a process to determine where a process that is low quality results might be failing Flowcharting 10 Taking measurements & Comparing them to upper & Lower thresholds variance Control Chart 11 Analyzing a graphic with an organized series of lines displaying issues that might have led to defect to examine if proper process was followed Cause and Effect Diagram 12 Showing the data in form of bars to measure & plot how frequently a problem occur Histogram 13 Collecting many data points to look at the pattern of relationships correlation between 2 variables Scatter Diagram 14 Using bar chart to show many problems occurred for each cause & arranging them according to frequency at which problems occurred Pareto Chart 15 Creating list of items to be checked during inspection Checklist 16 Reviewing graphic with an organized series of lines displaying issues or potential Cause and Effect
The COE § Build Proof of concepts § Demonstrate existing frameworks and solutions Customers § Evaluate tools & solutions § Setup demo within the COE § Evangelize frameworks and solutions by way of newsletters, workshops § Assist in creating battle cards for GTM initiatives 3 rd ISV / party Delivery Assurance § Evangelize standards and best practices § Identify frameworks jointly with practice & principals COE Sales & Marketing team § Engage domain team for vertical frameworks § Jointly engage for identifying ISV solutions Practice & Pre sales Domain team Principals § Building Po. C as part of presales § Identify frameworks jointly with practice & principals § Evangelize industry standards and best practices § Engage in early technology adoption § Work closely with Partner Architects on Po. Cs, frameworks & solutions § Engage with Alliance, attend tech events etc
DA Objectives Ø To Ensure Projects deliver as per customer expectation Ø To ensure Project Deliver without GAP Ø To ensure Project delivers as per Best Practices Ø To ensure High quality standards of deliverable Ø To ensure Reusability and Software Engineering Practice followed o
Quality Journey – Case Study Ø Infosys Ø Wipro ØTataquality. com o
Quality Journey – Case Study
Tataquality. com Tata Quality Management Services, a division of Tata Sons, is entrusted with the mandate by Tata Sons to set standards of excellence and partner closely with group companies to help them achieve their business excellence and improvement goals. Tata Quality Management Services is the custodian of the TBEM assessment process and the Tata Code of Conduct training and interventions. Tata Quality Management Services aspires to be a trusted partner in the sphere of Business Excellence to all companies in the Tata group. It aims to offer value to group companies for enhancing their performance and global competitiveness. Tata Quality Management Services collaborates with group companies, through long and short-term initiatives, in the following key areas: 1. 2. 3. 4. 5. 6. 7. 8. 9. TBEM Training TBEM Assessment Improvement Services Sustainability Group Innovation Corporate Governance & Ethics Safety Tata Affirmative Action Programme Education Excellence
Need your help You have asked to look into the operation of the company which is in business of repairing and overhauling of automobiles. Current practices have lead to an extreme amount of customer dissatisfaction due to very high waiting time, discourteous behavior of work force with clients, poor quality of workmanship and high cost of repairing automobiles. As a result the customers are started getting their services elsewhere. The owner is very keen to improve the situation but he finds that his people are not motivated by a spirit of service basically because of poor wages and indifferent supervision. This operation is located in an environmentally alert community and they have also been complaining to local municipal authorities that nasty way in which operations are handled and waster water disposed off, is causing lot of inconvenience in the locality. The owner-manager wants your help in improving the quality & effectiveness of systems operations. How will you analyze the situation? What further information you may need ? Prepare a short working paper outlining your suggestions to improve the systems operations.
Further Readings QFD (Quality Function Deployment) VOC (Voice of Customer) Affinity Diagram FMEA (Failure Mode and Effect Analysis) Decision Tree Orthogonal Arrays CTQ (Critical to Quality)