Qualitative Data Analysis Christine Slaughter Social Science Research


 • What are you trying to learn by doing this")
 • Lots of people have studied X phenomenon • Fewer")
 In some disciplines, you need hypotheses that you can prove")


")

")


")

")


- Slides: 37
Qualitative Data Analysis Christine Slaughter, Social Science Research Librarian University of Virginia Library Adapted from the presentation “Codes to Conclusions” by Lindsay Beyer, UC Berkeley D-Lab
What is “Qualitative Data Analysis”? “Qualitative data analysis is the classification and interpretation of linguistic (or visual) material to make statements about implicit and explicit dimensions and structures of meaning-making in the material and what is represented in it. ” (Flick 2014)
Two major strategies of Qualitative Data Analysis • Reducing complexity/the size of the data (Tactic: coding) • Expanding complexity/the material (Tactic: producing detailed interpretations of the data)
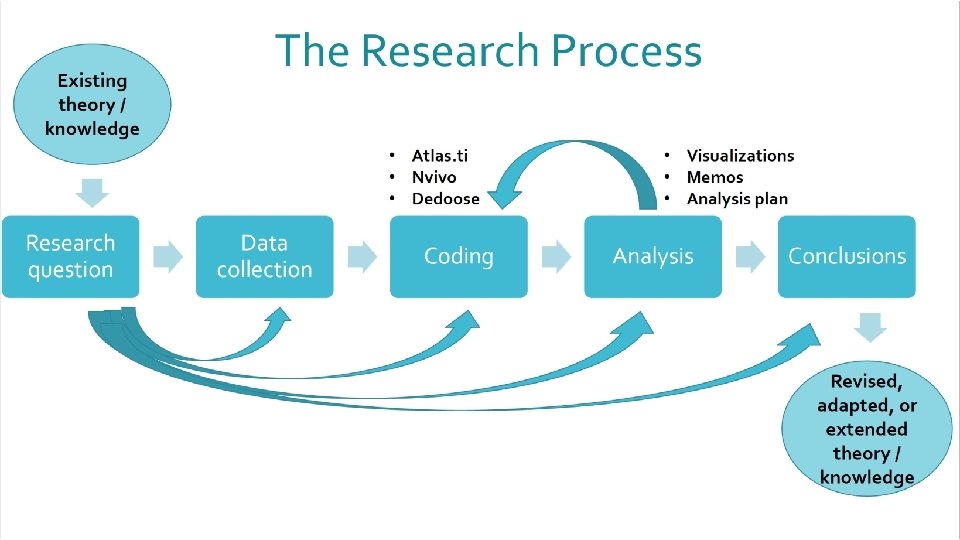
Step 1: Research Question(s) • What are you trying to learn by doing this research? • Research questions can be: • Deductive – testing a defined hypothesis • Inductive – discovering new relationships/categories/phenomena or generating new ideas from the data • In both cases, you build upon existing research
Step 1: Research Question(s) • Lots of people have studied X phenomenon • Fewer people have studied Y aspect of X phenomenon • Almost no one has studied the concept of Z in Y aspect of X phenomenon
Step 1: Research Question(s) In some disciplines, you need hypotheses that you can prove or disprove with data • May be explicit or implicit • What do you expect to find in your research? • What have other researchers found?
Step 2: Collect Qualitative Data • Ethnographic field notes • Interview transcripts • Focus group transcripts • Audio or video recordings • Archival data • Open-ended survey data • Meeting transcripts • Organizational documents • • • Court proceedings Newspapers Magazines Tweets Other digital data
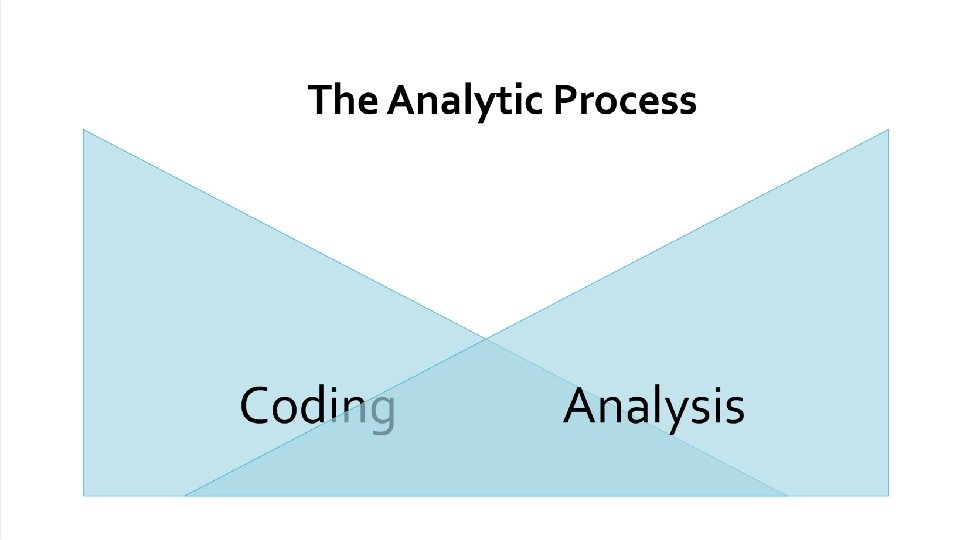
Step 3: Code Your Data What is “coding”? • Categorizing and organizing data: breaking it down into analyzable parts • Identifying ideas and concepts in your data that may apply across your different sources • For a particular passage, you can ask: • What is going on here? (Descriptive) • What is this an example of? What does this represent? (Analytical) • Can be done manually or with computer software • • NVivo Dedoose Atlas. ti Max. QDA
Step 3: Code Your Data • Codes can be deductive or inductive • Deductive codes emerge from the literature • Inductive codes emerge from coding and analysis
Step 3: Code Your Data • Coding is an iterative process • Start with a list of codes and apply them to a portion of your documents (open coding) • As you read further, refine and add codes if you think you’re missing any big ideas or themes • Some codes may be dropped • Some codes may be separated into two, e. g. “religion” -> “Christianity” and “Islam” • Some codes may be consolidated, e. g. “inhibiting the social presence of self, ” “believing social invisibility prevents bullying, ” “becoming silent” -> ”self-inhibiting” • You will often move from descriptive to conceptual/theoretical codes as you go • Keep track of your codes
Step 3: Code Your Data • Open/initial coding • Compare data with data • Stay close to and remain open to exploring what you interpret is happening in the data • Construct and keep your codes short, simple, precise and active • Move quickly but carefully through the data (Thornberg and Charmaz 2014)
Step 3: Code Your Data • Questions to ask during open coding (Thornberg and Charmaz 2014): What is this data a study of? What category does this incident indicate? What is actually happening in the data? What is the participant's main concern? What do the actions and statements in the data take for granted? What process(es) is at issue here? How can I define it? How does this process develop? How does the research participant(s) act and profess to think and feel while involved in this process? • What might his or her observed behavior indicate? • When, why, and how does the process change and what are its consequences? • •
(Thornberg and Charmaz 2014)
Step 3: Code Your Data • Focused/selective coding • By engaging with your data, you will discover the most frequent or significant initial codes that make the most analytical sense • These codes, your focused codes, will be use to sift through large amounts of data • More directed, selective and conceptual than initial codes
Step 3: Code Your Data (Thornberg and Charmaz 2014)
Step 3: Code Your Data • Categories • As you conduct your focused coding, codes will emerge that best capture what you see in the data • You can raise these codes up to conceptual categories: give them conceptual definitions and assess their relationship to each other • These categories can also be thought of as theoretical codes
Step 3: Code Your Data • Generating and refining categories – constant comparative method: • comparing and grouping codes, and comparing codes with emerging categories • comparing different incidents (e. g. social situations, actions, social processes, or interaction patterns) • comparing data from the same or similar phenomenon, action or process in different situations and contexts • comparing different people (their beliefs, situations, accounts or experiences) • comparing data from the same individuals at different points in time • comparing specific data with the criteria for the category • comparing categories in the analysis with other categories
Step 4: Analyze Your Data What is “analysis”? • Analyzing means interpreting, synthesizing, and looking for patterns in data in order to draw a conclusion • Which aspects of your data will best answer your research question? • You will never use all of your data • Identify which units of analysis, codes, and comparisons or relationships are most important in an analysis plan
Step 4: Analyze Your Data • What is your unit of analysis? • Documents • Individuals • Includes attributes like age, race, gender, job, attitudes and beliefs • • Organizations Locations Time Periods “Cases”
Step 4: Analyze Your Data • You may have “sub-units”: relevant groupings of data that facilitate comparison and analysis • Can be both deductive and inductive • “Sub-groups” are groupings that emerge from prior research • E. g. “gender” or “socioeconomic status” • “Typologies” are theoretical groupings that emerge from data itself, and may cut across sub-groups.
Step 4: Analyze Your Data • Sub-groups facilitate comparisons • Helps you see forces at work in your data • Look for similarities and differences, and connections between categories • Which codes and categories frequently co-occur? Which codes and categories never co-occur? • You may look for particular relationships between codes and categories • Relationships of time (A precedes B) • Relationships of similarity (A and B both say X) • Relationships of difference (A says X but B says Y)
Step 4: Analyze Your Data • As you code, write down the thoughts and questions you have about your codes and the relationships between them. These analytic/conceptual notes are called memos.
Step 4: Analyze Your Data • Memos can include: working definitions of codes or categories comparisons between data and between codes and categories identified gaps or vagueness in categories hunches, questions, or conjectures to be checked out and further investigated in the empirical research • fresh ideas and newly created concepts • comparisons between categories and a range of theoretical codes, and the use of theoretical codes to suggest and investigate possible relations between categories and how categories might be integrated into a modifiable GT • comparisons with and links to relevant literature (Thornberg and Charmaz 2014) • •
(Thornberg and Charmaz 2014)
Step 4: Analyze Your Data • The further along in the analytic process, the longer, more conceptualized, and more like written findings your memos become • During focused coding, you use memos to raise focused codes into tentative conceptual categories • During theoretical coding, “researchers further compare, sort and integrate their memos. Through memo sorting, they explore, create and refine theoretical relationships. ” (Thornberg and Charmaz 2014)
(Thornberg and Charmaz 2014)
Step 4: Analyze Your Data • How do you know when you’re finished? • A good analytical rule of thumb is when you’ve reached theoretical saturation—that is, when gathering fresh data no longer sparks new theoretical insights, nor reveals new properties of your generated theory and its categories or concepts • Are there any gaps in your analytic framework or its categories? • Are there any vague or underdeveloped definitions? • Are you missing some data? • Are the findings coherent?
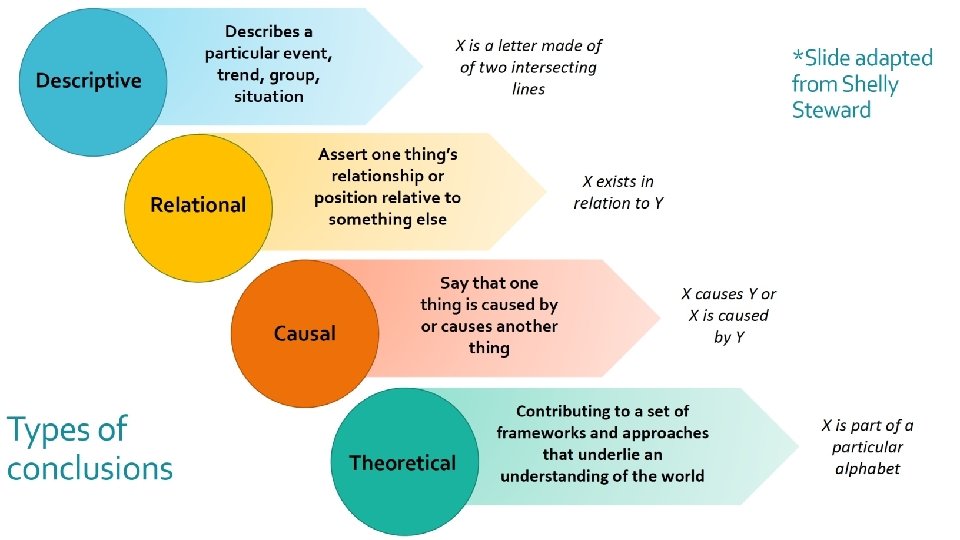
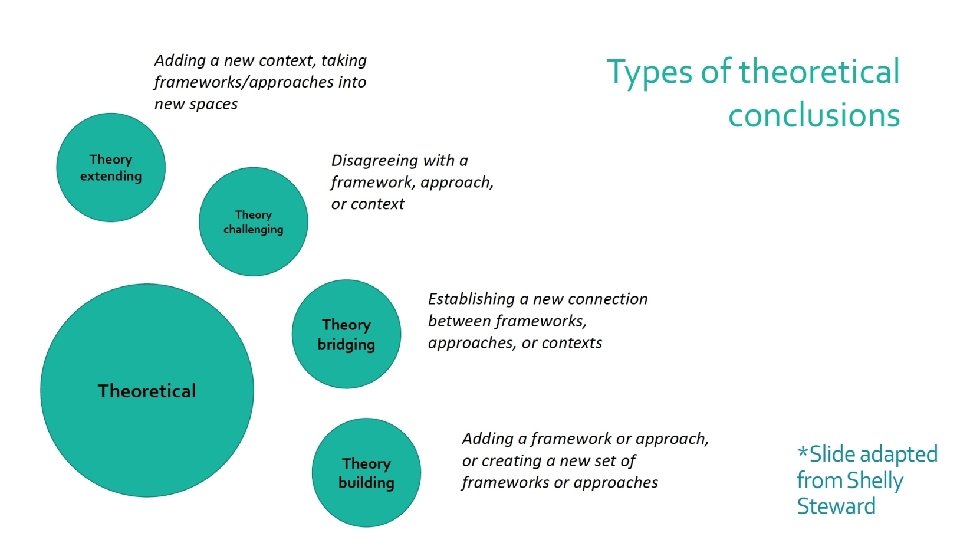
Step 5: Draw Conclusions • What is the “big picture” of your research question, data, and findings? • What kind of story are you trying to tell?
How Do We Evaluate the Quality of Analysis? • How applicable/useful are the findings for policy and practice? • Do the findings inform concepts or themes rather than remain uninterpreted? • Are concepts situated in their contexts and thus allow the reader to understand evaluate them? • Does the analysis demonstrate a logical flow of ideas or does it contain gaps? • Are the concepts given depth and complexity and show variation in findings through providing rich descriptive details and specifying the links between these concepts? • Does the study offer a creative contribution? (Corbin and Strauss 2008, summarized in Thornberg and Charmaz 2014)
A note on “objectivity” • Don’t think of making your data analysis “objective, ” but rather transparent: allow other researchers to see how you reached your conclusions • Some journals now request or require that researchers submit examples of coded documents to indicate how they interpreted their data
Works cited • Beyer, Lindsay. 2008. “From Codes to Conclusions: Analyzing Qualitative Data. ” Accessed 20 October 2018. http: //dlab. berkeley. edu/sites/default/files/training_materials/From%20 Codes% 20 to%20 Conclusions--May%202018. pdf. • Flick, Uwe. 2014. “Mapping the Field. ” In The SAGE Handbook of Qualitative Data Analysis, ed. Uwe Flick. Accessed 22 October 2018. doi: http: //dx. doi. org/10. 4135/9781446282243. n 1. • Thornberg, Robert and Kathy Charmaz. 2014. “Grounded Theory and Theoretical Coding. ” In The SAGE Handbook of Qualitative Data Analysis, ed. Uwe Flick. Accessed 23 October 2018. doi: http: //dx. doi. org/10. 4135/9781446282243. n 11.
On to Dedoose! • www. dedoose. com • We will be using the files from the Dropbox folder sent to you in yesterday’s email
Thank you Contact me: christine. slaughter@virginia. edu