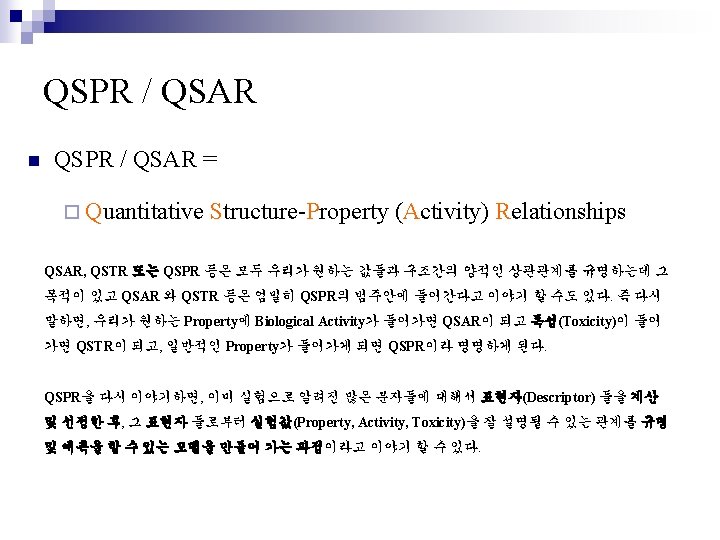
QSPRQSAR Methodology Computational Systems Biology YoungMook Kang QSPR

QSPR/QSAR Methodology Computational Systems Biology Young-Mook Kang
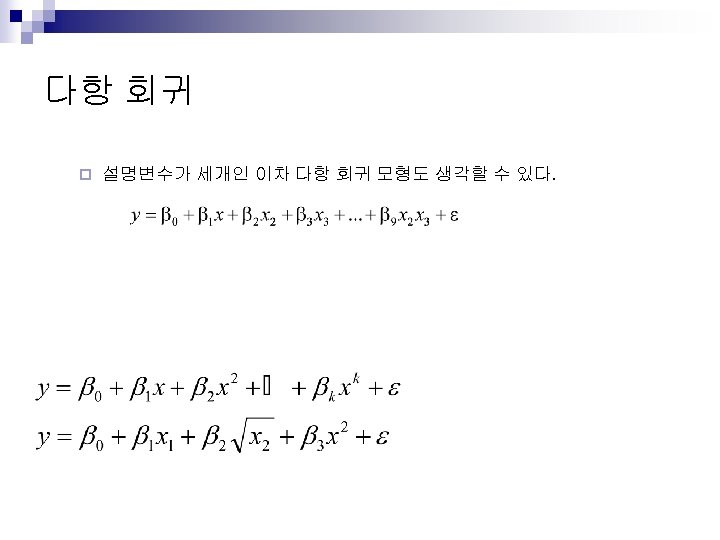
 Calculation of Descriptors Discovery Studio Descriptor Selection Generation of")
QSPR / QSAR Progress (Description) Calculation of Descriptors Discovery Studio Descriptor Selection Generation of Prediction Models Pre-ADME/T Topological Descriptors Model Validation Success Electronic, Thermodynamic , Spatial , Shape …
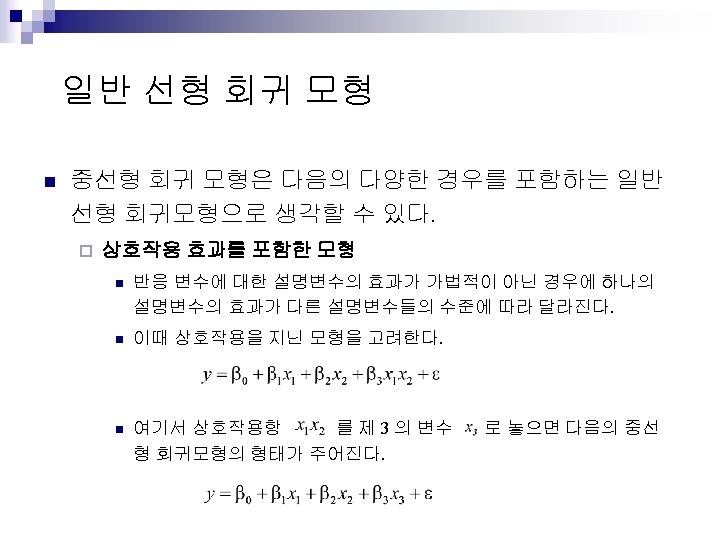
 Calculation of Descriptors Forward Selection Backward Elimination Descriptor Selection")
QSPR / QSAR Progress (Selection) Calculation of Descriptors Forward Selection Backward Elimination Descriptor Selection Generation of Prediction Models Stepwise Selection Genetic Algorithm Principal Components Analysis Model Validation Success Partial Least Squares
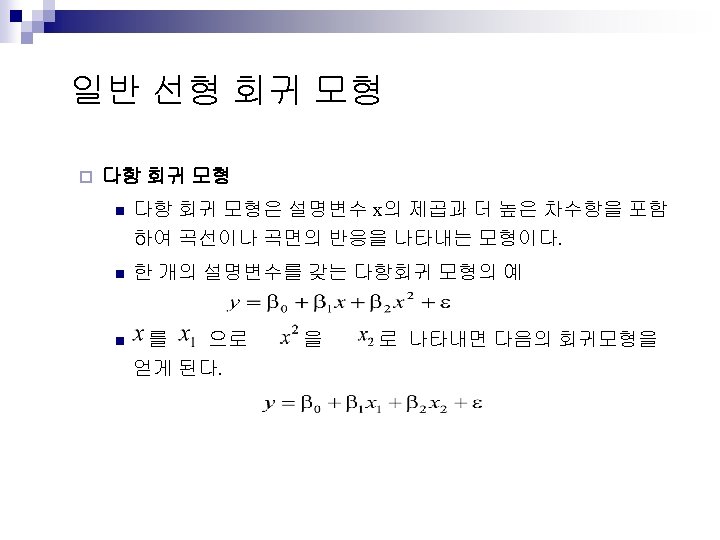
 Calculation of Descriptors Regression Analysis Linear Model Polynomial Model")
QSPR / QSAR Progress (Learning) Calculation of Descriptors Regression Analysis Linear Model Polynomial Model Extension Model Descriptor Selection Machine Learning Methods Generation of Prediction Models Model Validation Success Artificial Neural Network Support Vector Machine Decision Tree Models
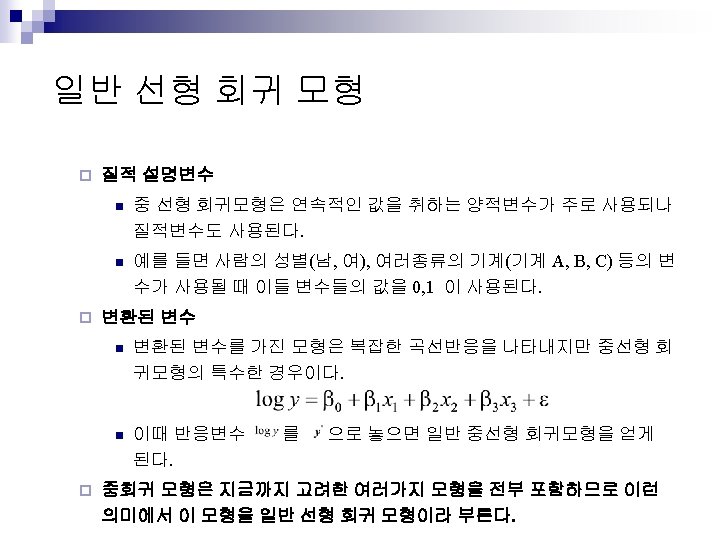
 Calculation of Descriptors Mean Variance Covariance Distributions Descriptor Selection")
QSPR / QSAR Progress (Validation) Calculation of Descriptors Mean Variance Covariance Distributions Descriptor Selection t Normal F Estimators Generation of Prediction Models MLE LSE Error Variances Model Validation Success SSR 결정계수

QSPR / QSAR Descriptor 1 Genetic Algorithm MLR Selection 2 Learning 2 Selection 3 Learning 3 … … Descriptor 2 Descriptor 3 … Descriptor N
 Descriptor 1 Selection 1 Learning 1 Selection 2 Learning")
QSPR / QSAR (Several Cases) Descriptor 1 Selection 1 Learning 1 Selection 2 Learning 2 Selection 3 Learning 3 … … Descriptor 2 Descriptor 3 … Descriptor N

Total Topics n n Molecular Descriptors Descriptor selection Rules and Methods Forward, Backward, Stepwise Methods ¨ Genetic Algorithm ¨ PCA and PLS ¨ n Several Learning Methods Regression Analysis ¨ Artificial Neural Network ¨ Decision Tree Model ¨ n Validation Analysis

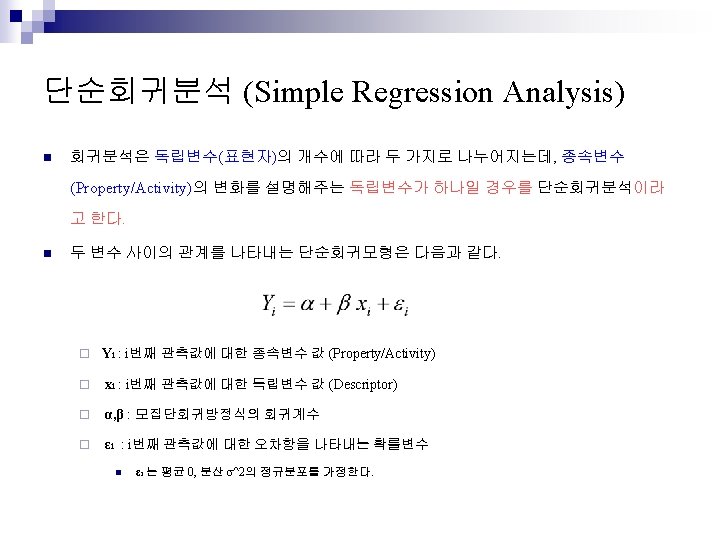
Today Topics n Regression Analysis ¨ n Descriptor selection Rules and Methods ¨ n Simple and Multiple Linear Regression Forward, Backward, Stepwise Methods Validation Analysis

Descriptions of Molecule, Descriptors IUPAC name, CAS no. , 분자식, 분자량 Volume, Surface 밀도, 굴절률, bp, mp 독성, 활성, 참고문헌 소수성(log. P) Dipole moment HOMO, LUMO Connectivity

간단한 예를 들어보면 토마토가 색깔로는 붉은색 차와 비슷하고 모양으로는 둥그런 축구공과 비슷하다. 즉 토마토를 가장 정확하게 표현하기 위해서는 색깔이나 모양만으로는 표현이 부족하다. 즉 QSAR/QSPR을 할 때 activity나 property를 가장 적절하게 표현하기 위한 표현자(descriptor)선정이 그 만큼 중요하다는 의미이다. 일련의 표현자를 선택하게 되면 통계학적인 방법은 컴퓨터상에서 계산되기 때문에 적절한 표현자를 잘 선택하는 것이 중요하다. 가능한 적은 수의 표현자를 이용하여 그 분자가 가지는 activity나 property를 잘 설명하는 것이 가장 좋은 QSAR/QSPR이 되는 것이다. n Electronic descriptor ¨ n Shape descriptor ¨ n Volume, Overlap volume, Non overlap volume Surface area, Density, Molecular weight, Moment of inertia Thermodynamic descriptor ¨ n Shape Spatial descriptor ¨ n Polarizability, Dipole, HOMO, LUMO Conformational energy, Desolvation free E, Log of the partition coefficient, Heat of formation Topological descriptor ¨ Molecular connectivity Indices, Distance matrix Color Descriptors

Quantitative and Qualitative Property Quantitative Property Log. P Water Solubility Available Most QSAR Methods Melting Point, Boiling Point p. EC 50, p. IC 50, EC 3 Activation Energy Several Quantitative Exp. Values …

Quantitative and Qualitative Property Active or Non-Active Binder or Non-Binder Restrictive Available Agonist or Antagonist H-Bond Acceptor or H-Bond Donor Specific Molecule class Several Qualitative Exp. Values …
 n Multiple-regression is used to express a matrix of dependent variables,")
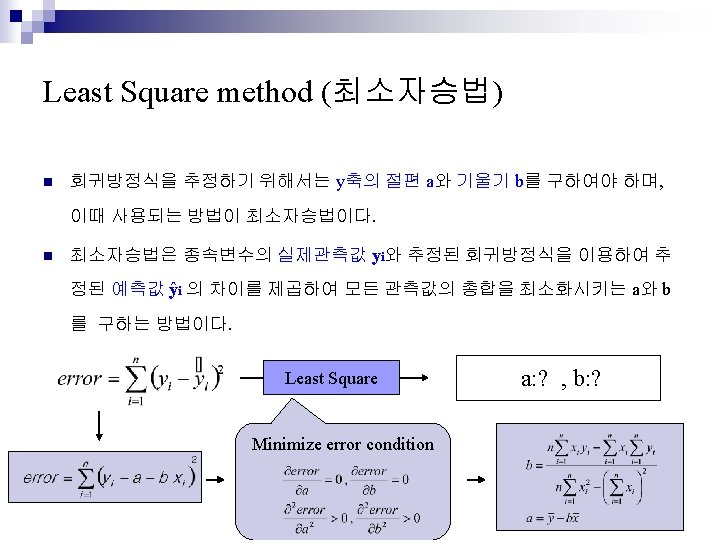
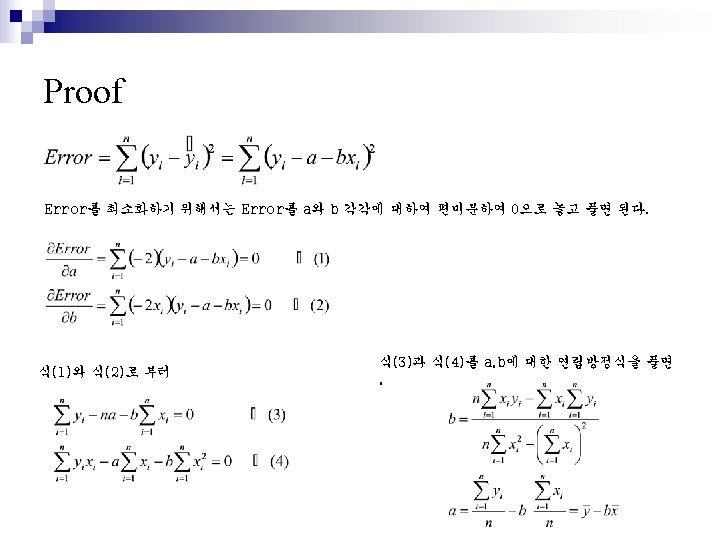
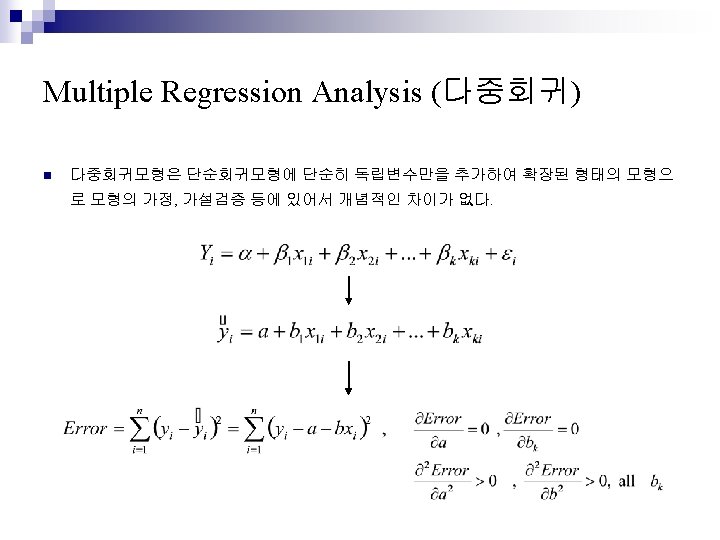
Multiple-Linear Regression (MLR) n Multiple-regression is used to express a matrix of dependent variables, Y, as a linear sum of independent variables, X. ¨ n In B is the set of linear coefficient that minimizes E, the error matrix. The sum of squares of the errors (SSE) in E is minimized by setting the derivative of SSE with respect to B equal to zero as shown in the derivation below:

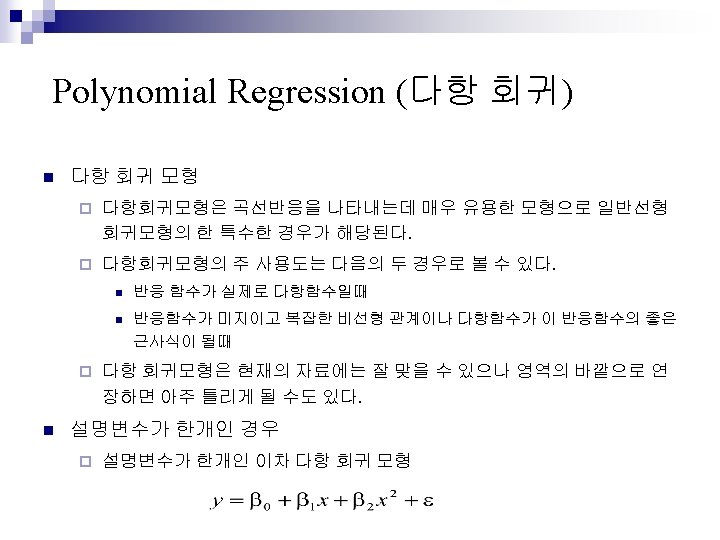
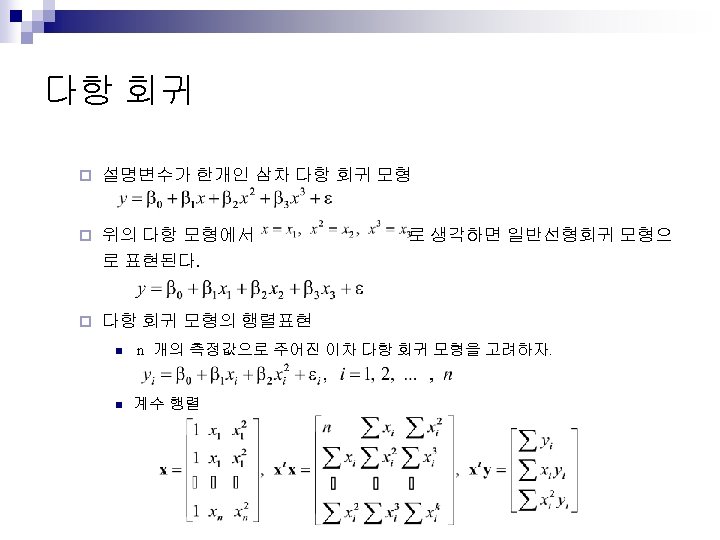
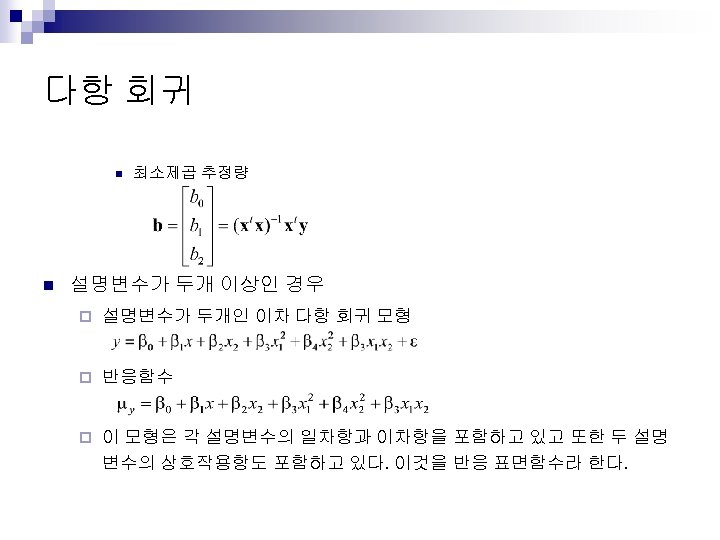
Non-Linear Regression Models

Taylor’s Series

Taylor’s Series

The Representation of MLR in 2 D Space. Regression Plot in 2 D

The Representation of MLR in 3 D Space. Regression Plot in 3 D
 ¨ Adjusted R-square (adjusted")
Variable Selection - Criterion n Criteria ¨ R-square (R 2) ¨ Adjusted R-square (adjusted R 2) ¨ Mean Square Error (MSE) ¨ Cp Statistic n definition: n When there is no bias in the regression model with (p-1) X variables, the expected value of Cp is approximately p. MSE is for the full model
 Full model R-square Adjusted R-square/ MSE")
Variable Selection - Criterion Reduced model (p-term model) Full model R-square Adjusted R-square/ MSE Cp Statistic MSE p Cp p

Variable Selection – All Possible All possible regression n identifies the best fitting regression models that can be constructed with the predictor variables that user specifies. Cp vs models

Variable Selection Methods ¨ Stepwise Regression n purpose: to identify a useful subset of the variables from a large list of candidate variables in a semi-automatic way. n forward selection ¨ adds variables to the regression model. ¨ Once added, a variable is never removed. ¨ The forward selection procedure ends when none of the candidate variables have a pvalue smaller than Alpha to enter. . n backward elimination ¨ starts with the model that contains all the predictors and then removes variables, one at a time. ¨ No variable can re-enter the model. ¨ The backward elimination procedure ends when none of the variables included in the model have a p-value greater than Alpha to remove.

Variable Selection Methods ¨ Stepwise n Method The stepwise method employs a combination of the procedures used in the forward selection and backward elimination methods. At Step 1 the procedures forward selection are performed. ¨ At any subsequent step where 2 or more effects have been selected for entry into the model, forward selection is performed if possible, and backward elimination is performed if possible, until neither procedure can be performed and stepping is terminated. Stepping is also terminated if the maximum number of steps is reached.

Variable Selection Methods Model 1 Model 2 • partial F-value • partial R-square

Variable Selection Methods • type II sum of squares for variable Xi

Variable Selection Methods n forward selection ¨ Step 1: start from the null model. ¨ Step 2: select Xj if SSR(Xj) is the largest and SSR(Xi)/s 2 is larger than Fvalue. ¨ Step 3: select Xnew if otherwise stop. n stepwise ¨ Step 1: start from null model. ¨ Step 2: add Xi if SSR(Xi) is the largest and SSR(Xi)/s 2 is larger than Fvalue. ¨ Step 3: add Xj if SSR(Xj|Xi’s) is the largest and partial F larger than Fin. ¨ Step 4: remove Xi if partial F < Fout ¨ continue.
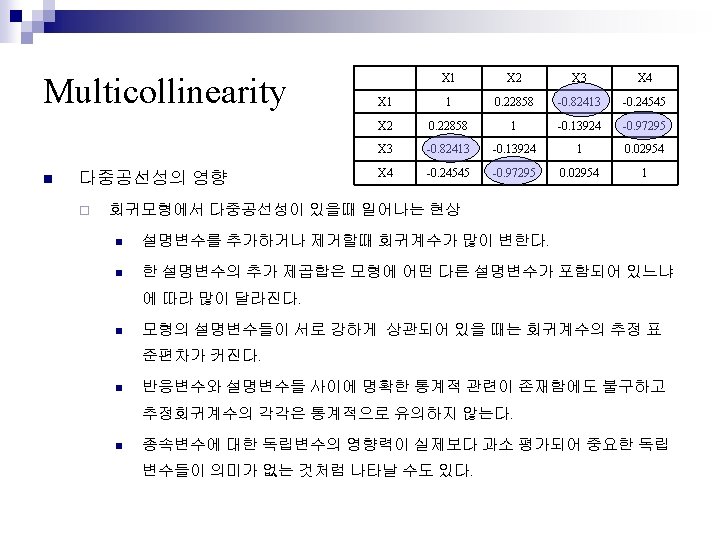
 ¨ 다중공선성이랑 독립변수간의 상호의존성을 나타내는 정도이다. ¨ 다중 공선성이")
Multicollinearity n 다중 공선성 (multicollinearity) ¨ 다중공선성이랑 독립변수간의 상호의존성을 나타내는 정도이다. ¨ 다중 공선성이 크게 존재하면 최소 제곱 적합식이 부적절한 경우가 일어 난다. X 1 X 2 X 3 X 4 Y 1 78. 5 7 26 6 60 2 74. 3 1 29 15 52 3 104. 3 11 56 8 20 4 87. 6 11 31 8 47 5 95. 9 7 52 6 33 6 109. 2 11 55 9 22 7 102. 7 3 71 17 8 72. 5 1 31 9 93. 1 2 10 115. 9 11 X 2 X 3 X 4 X 1 1 0. 22858 -0. 82413 -0. 24545 X 2 0. 22858 1 -0. 13924 -0. 97295 6 X 3 -0. 82413 -0. 13924 1 0. 02954 22 44 X 4 -0. 24545 -0. 97295 0. 02954 18 22 21 47 4 26 83. 8 1 40 23 34 12 113. 3 11 66 9 12 13 109. 4 10 68 8 12

Validation Process Training Set MLR or ANN Model Building Determination Coefficient or RMSE Model Selection Validation Set Test Set (Blind Test)
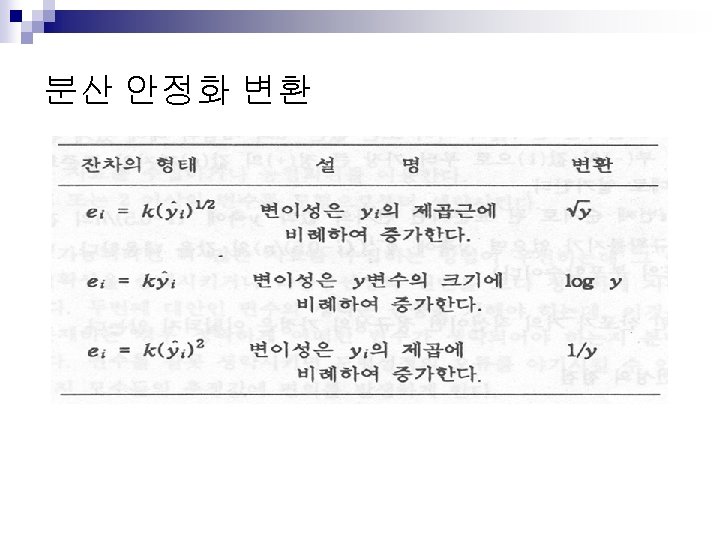

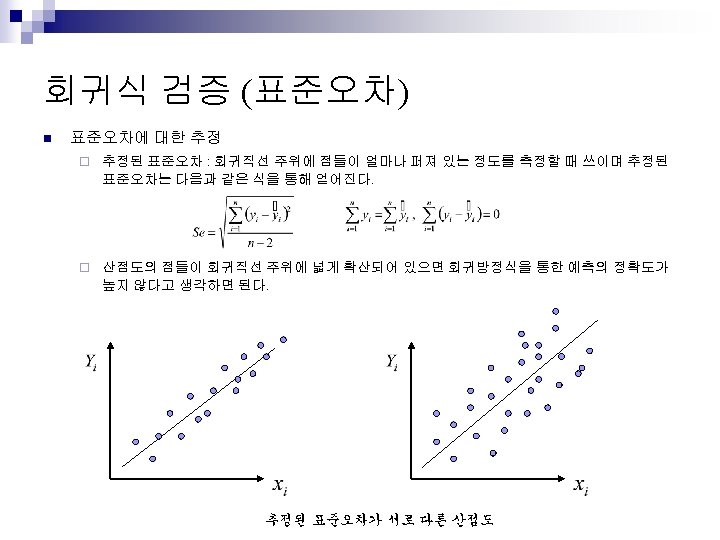
RMSE n 표준편차 n Root Mean Square Error
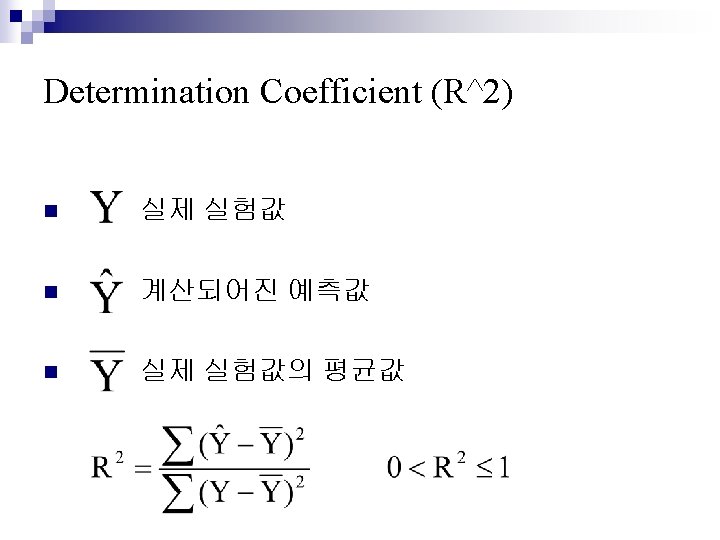

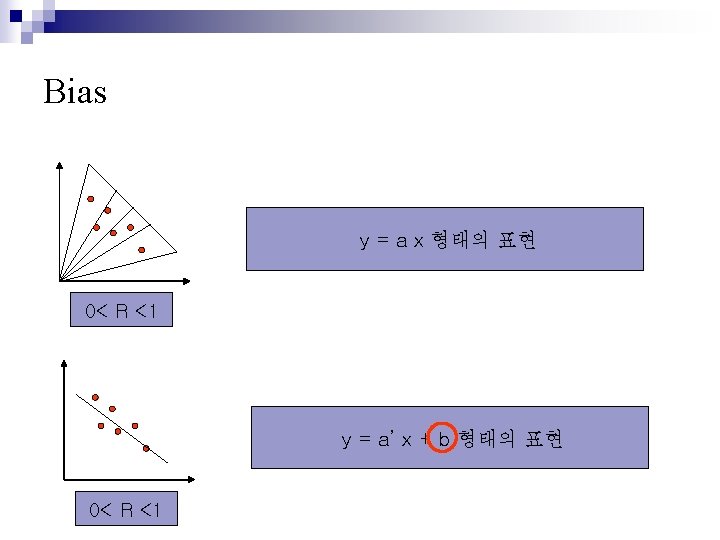
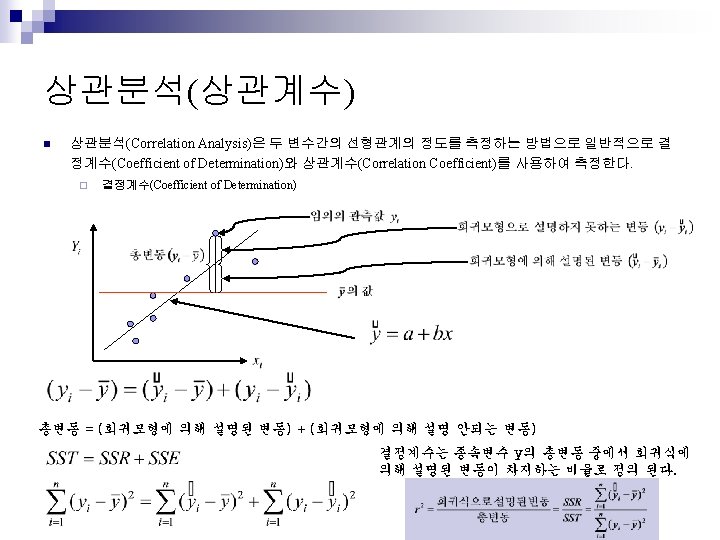
Determination Coefficient 0<R<1 R=0 -1 < R < 0 R = -1 R=0
 1. 00 = Perfect prediction")
Cross-validated n analysis Cross-validated r 2 cv (q 2) 1. 00 = Perfect prediction Significant statistical results 0. 50 Use results only with care when q 2 > 0. 4) 0. 00 = No Model! Negative values = prediction worse than those based on the mean over all compounds !

- Slides: 64