Q 1 2016 IAB PWC NEW ZEALAND INTERACTIVE

Q 1 2016 IAB / PWC NEW ZEALAND: INTERACTIVE ADVERTISING SPEND

Introduction • • • Census of 35+ major NZ media owners and agencies In conjunction with Pricewaterhouse. Coopers (Pw. C), the IAB has produced quarterly interactive advertising spend figures in NZ since 2007 Data shown by: – General Display split out by Video and Ad Exchange • Banner display by verticals i. e. Finance, Travel and Accommodation, Telecommunication – Search & Directories: paid search is a mixture of actual (agency spend) and estimated data (direct) and includes revenue from online directories – Classifieds: revenue from ads placed to buy or sell an item or service (does not include consumer Trade Me auctions) – Mobile: from general display or search engine listings viewed on mobile devices such as a smartphone or tablet – Social media: Vendor-based agency bookings reported by the Standard Media Index (SMI) for the quarter. – this amount does NOT include advertisements booked directly with social networking websites by advertising brands. www. iab. org. nz representing NZ's fastest growing and exciting industry 2

METHODOLOGY www. iab. org. nz representing NZ's fastest growing and exciting industry

Reported and Estimated Revenue Reported Revenue • Actual revenue data is obtained directly from companies deriving revenue from the sale of interactive advertising • Survey includes revenue submitted by 35+ companies • Aggregate amounts reported are rounded to the nearest $10, 000 • Based on information provided by contributors, approximately 74% of the data in this document is derived from participants whose underlying financial records have been, or will be, audited by an independent auditor • Data submitted by participants is kept completely confidential and figures are only ever reported in an aggregated form • Variance checks are performed on data submitted by participants for reasonableness in light of past submissions and general industry trends • Expenditure is based on gross amounts charged to advertisers and inclusive of any applicable agency commissions • As of Q 3 2015 the IAB/Pw. C Revenue report reflects vendor-based Agency bookings as reported by the Standard Media Index (SMI) for the quarter. The 2014 SMI report has been referenced to ensure consistency in year-on-year comparisons. The value quoted does NOT include advertisements booked directly with social networking websites by advertising brands. www. iab. org. nz representing NZ's fastest growing and exciting industry Estimated Revenue • The methodology used to estimate the Paid Search market was developed in consultation with leading New Zealand-based Search Engine Marketing agencies and data submitted to Pw. C by those companies 4

Adjustments and like-for-like reporting • All growth percentages are “normalised” to exclude the effect of new contributors to percentage measures of industry growth and also to remove the effect of any previous contributors that have not provided figures for the current quarter • For this reason, calculating percentages based on the dollar totals may not result in the same growth percentage figures • This is due to totals including all reported revenues, while “normalised” percentages exclude contributions from new contributors made during the comparison period and/or previous contributions made by contributors not contributing in this quarter • This approach is to ensure we provide both a true picture of industry growth and an accurate measure of total industry spend www. iab. org. nz representing NZ's fastest growing and exciting industry 5

Q 1 2016 Contributors 1. Acquire Online 2. Ad 2 One. Group 3. Adhub Ltd 4. Bauer Media Group 5. Denstu Aegis Network 6. Digital Marketing Initiative 7. Fairfax Media 8. FIRST 9. Grown. Ups Ltd 10. GSL Promotus 11. i. Start 12. Localist/Ora HQ 13. Mediacom 14. Mediaworks Interactive 15. Metservice 16. Mi 9 (MSN, Skype, Outlook, Ticketek, Daily Mail, Bing and Windows 10) 17. Neo@Ogilvy New Zealand 18. NZME www. iab. org. nz representing NZ's fastest growing and exciting industry 19. 20. 21. 22. 23. 24. 25. 26. 27. 28. 39. 30. 31. 32. 33. 34. 35. 36. Realestate. co. nz Search Republic SEEK NZ Sky. TV Network Starcom Sure. Fire Search The Radio Network Ltd Trade Me Ltd TVNZ Uprise Digital Ve. NA View New Zealand Ltd Vivaki Y&R Yahoo Search and Marketing NZ Yahoo! New Zealand Ltd Yellow Pages Zenith. Optimedia 6

Global Trends 2016 - 2018 • Interactive will be the biggest medium in a third of the global ad market by 2017 • Online Video ad spend will grow at 21% through to 2018 • Online Video consumption is growing at 17% per year • Mobile to contribute 92% of ad spend growth • Total Display forecast to reach US$112. 4 b by 2018 • Paid search to grow at an average rate of 14% a year to 2017 Source: Zenith. Optimedia www. iab. org. nz representing NZ's fastest growing and exciting industry 7

2016 Q 1 Executive Summary • • 2016 Q 1 - $203. 50 m 7. 44% YOY growth Mobile revenue – $9. 84 m Social revenue - $11. 49 m Fastest growing channels Q 1 YOY: - Mobile - 132% - Social Media – 66% - Programmatic – 43% Source: IAB/Pw. C Q 1 2016; IABNZ www. iab. org. nz representing NZ's fastest growing and exciting industry 8

Q 1 2016 AT A GLANCE ONLINE VIDEO DISPLAY Yo. Y 5% Dropped 15% Share Yo. Y MOBILE 3% Sharp drop Slowed Yo. Y 132% Ascendant 55% Share SOCIAL MEDIA CLASSIFIEDS Yo. Y 24% 2% Share TOP 5 DISPLAY CATEGORIES SEARCH & DIRECTORIES Yo. Y 7% 66% Rising Ascendant 19% Share 6% Share OTHER TRAVEL GOVT REAL ESTATE FOOD 12% 10% 9% 9% TOTAL MARKET 7% YOY Growth channels: 1 Mobile # 2 Social Media #

NZ INTERACTIVE SPEND Q 1 2016 TOP LINE RESULTS www. iab. org. nz representing NZ's fastest growing and exciting industry

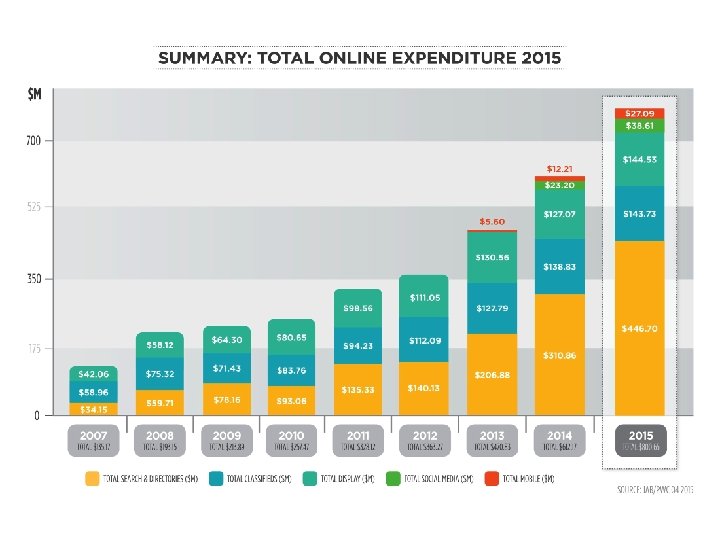
NZ INTERACTIVE Q 1 SPEND 2008 -2016 SOURCE: IAB/PWC Q 1 2016 Q 1

TOTAL ONLINE SPEND FOR Q 1 2016 RECORD: LARGEST Q 1 EVER AN INCREASE OF $203. 50 M 7% YEAR-ON-YEAR IN Q 1 2016 SOURCE: IAB/PWC Q 1 2016

YOY GROWTH Q 1 2016 TOTAL DISPLAY 7% CLASSIFIEDS -5% 7% TOTAL INTERACTIVE AD SPEND Q 1 2016: SEARCH 3% SOCIAL VIDEO -24% 66% $203. 50 M MOBILE 132%

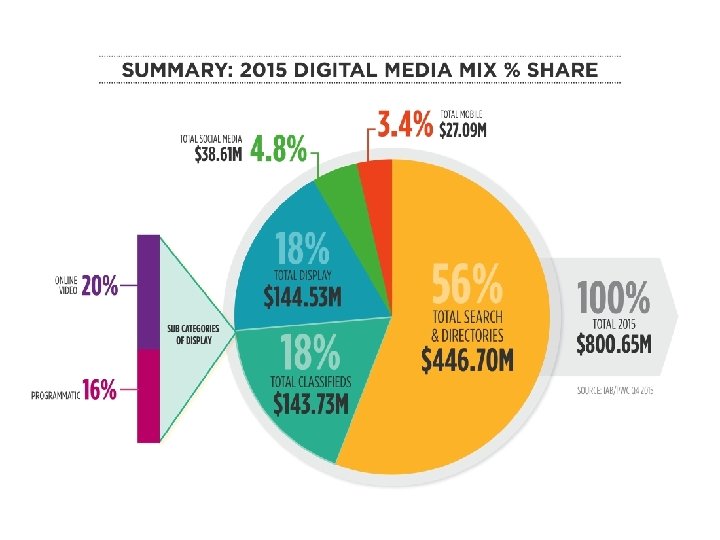
Q 1 2016 DIGITAL MIX % SHARE SOCIAL MEDIA $11. 5 M ONLINE VIDEO $5. 0 M 16% PROGRAMMATIC $6. 9 M 22% 6% 5% MOBILE $9. 8 M 15% TOTAL DISPLAY $31. 4 M 19% TOTAL CLASSIFIED $38. 1 M 55% TOTAL SEARCH & DIRECTORIES $112. 7 M 100% TOTAL Q 1, 2016 $203. 50 M SOURCE: IAB/PWC Q 1 2016

DIGITAL MIX CHANGE Q 1 2015 VS. Q 1 2016 ONLINE VIDEO $3. 8 M 2% MOBILE $6. 9 M 4% SOCIAL MEDIA ONLINE VIDEO 3% $6. 3 M 2% $4. 1 M PROGRAMMATIC $9. 8 M 5% MOBILE SOCIAL MEDIA 2% $5. 0 M 3% $6. 9 M PROGRAMMATIC $11. 5 M 6% 12% GENERAL DISPLAY $21. 6 M 19% CLASSIFIEDS $35. 7 M 58% SEARCH & DIRECTORIES $107. 6 M 55% 10% GENERAL DISPLAY $19. 5 M 19% CLASSIFIEDS SEARCH & DIRECTORIES $112. 7 M $38. 1 M Q 1 2015 Q 1 2016 $186. 26 M $203. 50 M SOURCE: IAB/PWC Q 1 2016

SEARCH & DIRECTORIES $112. 66 M IN Q 1 2016 AN INCREASE OF 3% YEAR-ON-YEAR SOURCE: IAB/PWC Q 1 2016

CLASSIFIEDS $38. 05 M IN Q 1 2016 AN INCREASE OF 7% YEAR-ON-YEAR SOURCE: IAB/PWC Q 1 2016

DISPLAY $31. 45 M IN Q 1 2016 A DECREASE OF 5% YEAR-ON-YEAR SOURCE: IAB/PWC Q 1 2016

DISPLAY ADVERTISING TOTAL SPEND BY SECTOR Q 1 2016 ADVERTISER INDUSTRY CATEGORIES IN Q 1 2016 1 - 5 TOP 5 represent 50% of all DISPLAY SPEND 6 -10 FINANCE drops to 7 th this quarter 11 -15 OTHER 11. 62% AUTO 8. 55% TELCO 4. 14% TRAVEL 10. 12% FINANCE 7. 85% HEALTH 3. 89% GOVT 9. 85% ENTERTAINMENT 7. 84% BUSINESS SERVICES 2. 69% REAL ESTATE 9. 41% RETAIL 6. 54% INSURANCE 2. 13% FOOD & BEVERAGE 9. 08% HOME 5. 34% COMPUTERS 0. 95% SOURCE: IAB/PWC Q 1 2016

& BEVERAGE DISPLAY ADVERTISING TOTAL SPEND BY SECTOR Q 1 2016 SOURCE: IAB/PWC Q 1 2016

VIDEO ADVERTISING $5. 03 M IN Q 1 2016 A DECREASE OF 24% YEAR-ON-YEAR SOURCE: IAB/PWC Q 1 2016

SOCIAL MEDIA $11. 49 M IN Q 1 2016 AN INCREASE OF 66% YEAR-ON-YEAR SOURCE: IAB/PWC Q 1 2016

MOBILE ADVERTISING $9. 84 M IN Q 1 2016 AN INCREASE OF 132% YEAR-ON-YEAR SOURCE: IAB/PWC Q 1 2016

Q 1 2016: TOTAL SMARTPHONE VS. TABLET SOURCE: IAB/PWC Q 1 2016

Summary • $203. 50 m for the Quarter – a new Q 1 record! • Q 1 – 7. 44% Growth • Mobile is fastest growing channel but still lags behind US, UK & Australia • Globally* - Online Video ad spend will grow at 21% through to 2018 - Online Video consumption is growing at 17% per year - Mobile to contribute 92% of ad spend growth - Total Display forecast to reach US$112. 4 b by 2018 - Paid search to grow at an average rate of 14% a year to 2017 *Source: Zenith. Optimedia www. iab. org. nz representing NZ's fastest growing and exciting industry 25

www. iab. org. nz representing NZ's fastest growing and exciting industry

Contacts IABNZ Executive CEO: Adrian Pickstock adrian. pickstock@iab. org. nz Member Services Manager: Chris Ogles chris@iab. org. nz Project Sponsor Chris Perree, Partner Mobile: +64 -21 -358 -004 Email: chris. perree@nz. pwc. com Graphic Designer: Billie Charlton capandshoe@gmail. com Project Manager James Budd, Senior Associate Mobile: +64 -21 -644 -004 Email: james. j. budd@nz. pwc. com Project Analysts Salmaan Khan, Associate Email: salmaan. x. khan@nz. pwc. com Logan Burgess, Associate Email: logan. burgess@nz. pwc. com www. iab. org. nz representing NZ's fastest growing and exciting industry 29
 firms help organisations and individuals")
About Pw. C • Pw. C (www. pwc. com) firms help organisations and individuals create the value they’re looking for. We’re a network of firms in 158 countries with close to 169, 000 people who are committed to delivering quality in assurance, tax and advisory services. • "Pw. C" is the brand under which member firms of Pricewaterhouse. Coopers International Limited (Pw. CIL) operate and provide services. Together, these firms form the Pw. C network. Each firm in the network is a separate legal entity and does not act as agent of Pw. CIL or any other member firm. Pw. CIL does not provide any services to clients. Pw. CIL is not responsible or liable for the acts or omissions of any of its member firms nor can it control the exercise of their professional judgment or bind them in any way. • For more information about Pw. C New Zealand how they may be able to help you please visit www. pwc. co. nz www. iab. org. nz representing NZ's fastest growing and exciting industry 30

Disclaimer • This document has been prepared using information provided by contributing media companies to Pw. C. The firm has relied on the information provided as being complete and accurate at the time it was given. Pw. C’s analysis of the data provided by contributors, walkthroughs conducted and preparation of this document do not constitute an audit performed in accordance with New Zealand Auditing Standards. Accordingly, Pw. C does not express an audit opinion or other form of assurance with respect to the information in this document. • Pw. C does not accept any responsibility for any reliance placed on this document by any person and hereby disclaims any liability for any loss or damage caused by errors or omissions, whether such errors or omissions resulted from negligence, accident or some other causes. Pw. C makes no representations about the analysis or application of the data. • Pw. C has received a fee for the preparation of this document and takes responsibility for the independence of the research and analysis contained in this document. • Please notify Pw. C of any errors or omissions identified in this document. Copyright Notice © Copyright Interactive Advertising Bureau New Zealand Inc. 2016. All rights reserved. • Any companies using tables or charts or other information from this document for any purpose must attribute the source of the information used to this document. Full permission in writing must be sought before publishing parts or the full document. www. iab. org. nz representing NZ's fastest growing and exciting industry 31
- Slides: 31