Python Pandas Data Frame By Mrs Sangeeta M

Python Pandas Data. Frame By : Mrs Sangeeta M Chauhan , Gwalior https: //pythonclassroomdiary. wordpress. com by Sangeeta M Chauhan, Gwalior
 data structure,")
What is Data Frame? A Data frame is a 2 D (two-dimensional) data structure, i. e. , data is arranged in tabular form i. e. In the form of rows and columns. Or we can say that, Pandas Data. Frame is similar to excel sheet Let’s understand it through an example

Create Data. Frame pandas Data. Frame can be created using the following constructor pandas. Data. Frame ( data[, index, columns, dtype, copy]) The parameters of the constructor are as follows Sr. No Parameter & Description 1 Data data takes various forms like ndarray, series, map, lists, dict, constants and also another Data. Frame. 2 Index For the row labels, the Index to be used for the resulting frame is Optional Default np. arrange(n) if no index is passed. 3 Columns For column labels, the optional default syntax is - np. arrange(n). This is only true if no index is passed. 4 5 Dtype Data type of each column. Copy This command is used for copying of data, if the default is False.

ü A pandas Data. Frame can be created using various inputs like 1. Lists 2. dictionary 3. Series 4. Numpy ndarrays 5. Another Data. Frame Creating an Empty Data. Frame >>> import pandas as pd >>> df=pd. Data. Frame() >>> df • Empty Data. Frame • Columns: [] • Index: []
 >>> My. List=[10, 20,")
Create a Data. Frame from Lists Example 1 (Simple List) >>> My. List=[10, 20, 30, 40] >>> My. Frame=pd. Data. Frame(My. List) >>> My. Frame 0 0 10 1 20 2 30 3 40 Example 1 (Simple List) >>> Friends = [['Shraddha', 'Doctor'], ['Shanti', 'Teacher'], ['Monica', 'Engineer']] >>> My. Frame=pd. Data. Frame(Friends, columns=['Name', 'Occupation']) >>> My. Frame Name Occupation 0 Shraddha Doctor 1 Shanti Teacher 2 Monica Engineer

Creation of a Data. Frame from Dictionary of ndarrays / Lists • All the ndarrays must be of same length. • If index is passed, then the length of the index should equal to the length of the arrays. • If no index is passed, then by default, index will be range(n), where n is the array length.
![Example 1 (without index) >>> data = {'Name': ['Shraddha', 'Shanti', 'Monica', 'Yogita'], ‘Age’:](http://slidetodoc.com/presentation_image_h/74926e4be32ddab41434ec7ecc589f42/image-7.jpg "Example 1 (without index) >>> data = {'Name': ['Shraddha', 'Shanti', 'Monica', 'Yogita'], ‘Age’:")
Example 1 (without index) >>> data = {'Name': ['Shraddha', 'Shanti', 'Monica', 'Yogita'], ‘Age’: [28, 34, 29, 39]} >>> df = pd. Data. Frame(data) >>> df Name Age 0 Shraddha 28 1 Shanti 34 2 Monica 29 3 Yogita 39
![Example 1 (With Index) >>> data = {'Name': ['Shraddha', 'Shanti', 'Monica', 'Yogita'], 'Age':](http://slidetodoc.com/presentation_image_h/74926e4be32ddab41434ec7ecc589f42/image-8.jpg "Example 1 (With Index) >>> data = {'Name': ['Shraddha', 'Shanti', 'Monica', 'Yogita'], 'Age':")
Example 1 (With Index) >>> data = {'Name': ['Shraddha', 'Shanti', 'Monica', 'Yogita'], 'Age': [28, 34, 29, 39]} >>> df = pd. Data. Frame(data, index=['Friend 1', 'Friend 2', 'Relative 1', 'Relative 2']) >>> df Name Age Friend 1 Shraddha 28 Friend 2 Shanti 34 Relative 1 Monica 29 Relative 2 Yogita 39

Create a Data. Frame from List of Dictionaries Here we are passing list of dictionary to create a Data. Frame. The dictionary keys are by default taken as column names. Example 1: >>> Mydict= [{'Won': 15, 'Loose': 2}, {'Won': 5, 'Loose': 10} , {'Won': 8, 'Loose': 9}, {'Won': 4}] Loose Won 0 2. 0 15 >>> df = pd. Data. Frame(Mydict) 1 10. 0 5 >>> df 2 9. 0 8 Notice that Missing Value is stored as Na. N (Not a 3 Na. N 4 Number)

Example 2: Changing Index >>> Mydict=[{'Won': 15, 'Loose': 2}, {'Won': 5, 'Loose': 10}, {'Won': 8, 'Loose': 9}] >>> df = pd. Data. Frame(Mydict, index= ['India', 'Pakistan', 'Australia' ]) >>> df Loose Won India 2 15 Pakistan 10 5 Autralia 9 8

Example 3 We can also create a Data. Frame by specifying list of dictionaries, row indices, and column Physics Chemistry Maths indices Student 1 87. 0 78 Student 2 Na. N 70 67 >>> L_dict = [{'Maths': 78, 'Chemistry': 78, 'Physics': 87}, {'Maths': Student 3 77. 0 Na. N 87 67, 'Chemistry': 70}, {'Physics': 77, 'Maths': 87}] >>> df 1 = pd. Data. Frame(L_dict, index=['Student 1', 'Student 2', 'Student 3'], columns=['Physics', 'Chemistry', 'Maths'])
![>>> df 2 = pd. Data. Frame (L_dict, index=['Student 1', 'Student 2', 'Student 3'],](http://slidetodoc.com/presentation_image_h/74926e4be32ddab41434ec7ecc589f42/image-12.jpg ">>> df 2 = pd. Data. Frame (L_dict, index=['Student 1', 'Student 2', 'Student 3'],")
>>> df 2 = pd. Data. Frame (L_dict, index=['Student 1', 'Student 2', 'Student 3'], columns=['Chemistry', 'Maths']) Chemistry Maths Student 1 78. 0 78 Student 2 Na. N 67 Student 3 Na. N 87 df 2 is created with only 2 columns
![>>> df 3 = pd. Data. Frame(L_dict, index=['Student 1', 'Student 2', 'Student 3'], columns=['English',](http://slidetodoc.com/presentation_image_h/74926e4be32ddab41434ec7ecc589f42/image-13.jpg ">>> df 3 = pd. Data. Frame(L_dict, index=['Student 1', 'Student 2', 'Student 3'], columns=['English',")
>>> df 3 = pd. Data. Frame(L_dict, index=['Student 1', 'Student 2', 'Student 3'], columns=['English', 'Chemistry', 'Maths']) Creating df 3 by specifying 3 column name (New Column English) >>> df 3 English Chemistry Maths Student 1 Na. N 78. 0 78 Student 2 Na. N 67 Student 3 Na. N 87

Addition of New Column & Row Column Addition >>> L_dict = [{'Maths': 78, 'Chemistry': 78, 'Physics': 87}, {'Maths': 67, 'Chemistry': 70}, {'Physics': 77, 'Maths': 87, 'Chemistry': 90}] >>> df 3 = pd. Data. Frame(L_dict, index=['Student 1', 'Student 2', 'Student 3'], columns=['English', 'Chemistry', 'Maths']) >>> df 3['Physics']=[45, 56, 65] New Column Physics added English Chemistry Maths Physics Student 1 Na. N 78 45 Student 2 Na. N 70 67 56 Student 3 Na. N 90 87 65
![We can Update column Data also by using same method • >>> df 3['English']=[78,](http://slidetodoc.com/presentation_image_h/74926e4be32ddab41434ec7ecc589f42/image-15.jpg "We can Update column Data also by using same method • >>> df 3['English']=[78,")
We can Update column Data also by using same method • >>> df 3['English']=[78, 98, 89] English Chemistry Maths Physics Student 1 78 45 Student 2 98 70 67 56 Student 3 89 90 87 65 Values of column English (Na. N ) is replaced with new values

We can also add new column using Data , stored in existing Frame df 3['Total']=df 3. English+df 3. Chemistry+df 3. Mat hs+df 3. Physics English Chemistry Maths Physics Total Student 1 78 78 45 279 Student 2 98 70 67 56 291 Student 3 89 90 87 65 331 Look , a new Column Total has been added with total of marks in other subjects

ASSIGNING AND COPYING OF DATAFRAME

Changes reflected in both dataframe s Changes reflected in 2 nd dataframe only

SELECTION AND INDEXING Methods covered in this section are: Ø Selecting data by row numbers (. iloc) Ø Selecting data by label or by a conditional statment (. loc) Ø Selecting data at particular row and column(. at) loc gets rows (or columns) with particular labels from the index. iloc gets rows (or columns) at particular positions in the index (so it only takes integers).

ACCESSING DIFFERENT ROWS/ COLUMNS

Use of iloc Here end index is excluded

Use of at with data. Frame • Access a single value for a row/column label pair. <df>. at[rowname, colname] <df>. loc[rowname]. at[colname] – XI. at['stu 2', 'Name'] – XI. at['stu 2', 'Physics'] – XI. loc['stu 2']. at['Chemistry']

Row Addition • To add a row , by specifying row index • >>> df 3. loc['Student 4']=[45, 67, 45] • >>> df 3 English Chemistry Maths Student 1 78 78 Student 2 98 70 67 Student 3 89 90 87 Student 4 45 67 45
")
Use of iloc()

Deletion of an Existing Column/Row from Data Frame
 English Chemistry Maths Physics Student 1 78")
Row Deletion >>> df 3. drop('Student 3') English Chemistry Maths Physics Student 1 78 45 Student 2 98 70 67 56

Descriptive Statistics with Pandas • Pandas also offer many useful Statistical and Aggregate Functions. • Out of which we are going to discuss following functions
 • Parameters : axis : Align object")
Data. Frame. min (axis=None, skipna=None, numeric_only=None, ) • Parameters : axis : Align object with threshold along the given axis. skipna : Exclude NA/null values when computing the result numeric_only : Include only float, int, boolean columns. If None, will attempt to use everything, then use only numeric data. Not implemented for Series.
")
Use of min()
बहलक (")
Calculating Mode )बहलक (

Compare both Data & Result

Calculating median
 will count element for each column (by default)")
Count () will count element for each column (by default)
 by column")
Sum() by column
![APPLYING FUNCTIONS ON SUBSET OF DATA FRAME <DF>[[<COL NAME 1, COLNAME 2…. >]. <fun_nm>](http://slidetodoc.com/presentation_image_h/74926e4be32ddab41434ec7ecc589f42/image-35.jpg "APPLYING FUNCTIONS ON SUBSET OF DATA FRAME <DF>[[<COL NAME 1, COLNAME 2…. >]. <fun_nm>")
APPLYING FUNCTIONS ON SUBSET OF DATA FRAME <DF>[[<COL NAME 1, COLNAME 2…. >]. <fun_nm> • Example : XI[‘Chemitry’]. min()
![APPLYING FUNCTIONS ON ROW OF DATA FRAME • <DF>. loc[<row_index>, …. ]. <function_name>](http://slidetodoc.com/presentation_image_h/74926e4be32ddab41434ec7ecc589f42/image-36.jpg "APPLYING FUNCTIONS ON ROW OF DATA FRAME • <DF>. loc[<row_index>, …. ]. <function_name>")
APPLYING FUNCTIONS ON ROW OF DATA FRAME • <DF>. loc[<row_index>, …. ]. <function_name>

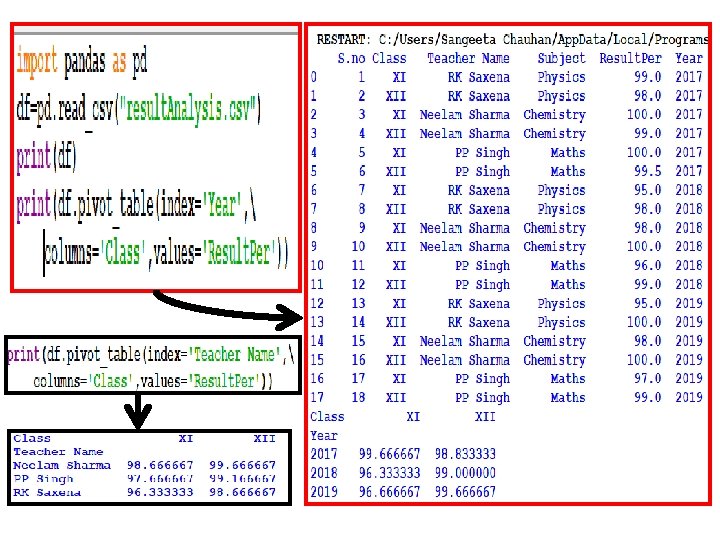
ADVANCED OPERATION ON DATAFRAME • 1. PIVOTTING : In Pandas, the pivot table function takes simple data frame as input, and performs grouped operations that provides a summary of the data. multidimensional
 function pandas. pivot(index, columns, values) Function produces pivot table based on 3 columns")
pivot() function pandas. pivot(index, columns, values) Function produces pivot table based on 3 columns of the Data. Frame. Uses unique values from index / columns and fills with values. • Parameters: index : Labels to use to make new frame’s index columns : Labels to use to make new frame’s columns values : Values to use for populating new frame’s values

Csv file : result. Analyi. Tr S. no Class Teacher Name Subject Result. Per 1 XII RK Saxena Physics 98 2 XII Neelam Sharma Chemistry 100 3 XII PP Singh Maths 99. 5 4 XII Ravita CS 100

What if we have duplicate values in column and index? ? ? Yes we have solution…. . We can use pivot_table() instead of pivot() • pandas. pivot_table(data, values=None, index= None, columns=None, aggfunc='mean', fill_val ue=None, margins=False, dropna=True)
")
Lets consider another table (with duplicate values)

Lets consider modified csv file

pivot. Table. Ex 2. py
 columns : on")
SORTING • Data. Frame. sort_values(columns=None, axis=0, ascending =True, inplace=False, kind='quicksort', na_position='last’) columns : on which data is sorted Parameters: ascending : default True(Ascending) Specify list for multiple sort orders axis : {0 or ‘index’, 1 or ‘columns’}, default 0, Sort index/rows versus columns inplace : boolean, default False, Sort the Data. Frame without creating a new instance kind : {‘quicksort’, ‘mergesort’, ‘heapsort’}, optional This option is only applied when sorting on a single column or label. na_position : {‘first’, ‘last’} (optional, default=’last’) ‘first’ puts Na. Ns at the beginning ‘last’ puts Na. Ns at the end
 Data. Frame df Ascending Order Descending")
Use of df. sort_values() Data. Frame df Ascending Order Descending

Descending order with Nan values at first position
![Sorting on Multiple Columns print("Sorting on Multiple(2) Columns") Ø print(df. sort_values(by=['Class', 'Teacher Name'])) print("Sorting](http://slidetodoc.com/presentation_image_h/74926e4be32ddab41434ec7ecc589f42/image-48.jpg "Sorting on Multiple Columns print(\"Sorting on Multiple(2) Columns\") Ø print(df. sort_values(by=['Class', 'Teacher Name'])) print(\"Sorting")
Sorting on Multiple Columns print("Sorting on Multiple(2) Columns") Ø print(df. sort_values(by=['Class', 'Teacher Name'])) print("Sorting on Multiple(3) Columns") Ø print(df. sort_values(['Class', 'Teacher Name', 'Year']))

Aggregate Functions Function Description count Number of non-null observations sum Sum of values mean Mean of values mad Mean absolute deviation median Arithmetic median of values min Minimum max Maximum mode Mode std Unbiased standard deviation
")
<Df>. <agg_fun_name>()
 can be applied on a dataframe in multipleways")
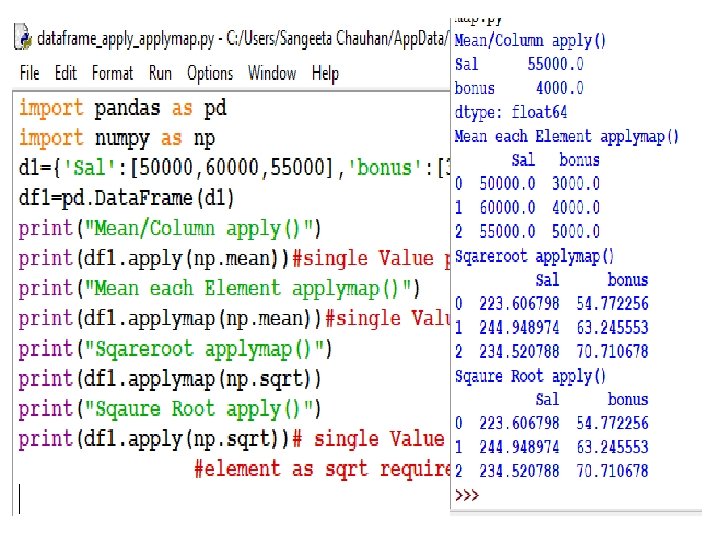
FUNCTION APPLICATION Function (UDF or Library) can be applied on a dataframe in multipleways v. On the whole data frame – pipe() v. Row/column wise - apply() v. On individual element – applymap()
 Data Input Output of previous pipe Input to next pipe")
Pipe() Data Input Output of previous pipe Input to next pipe
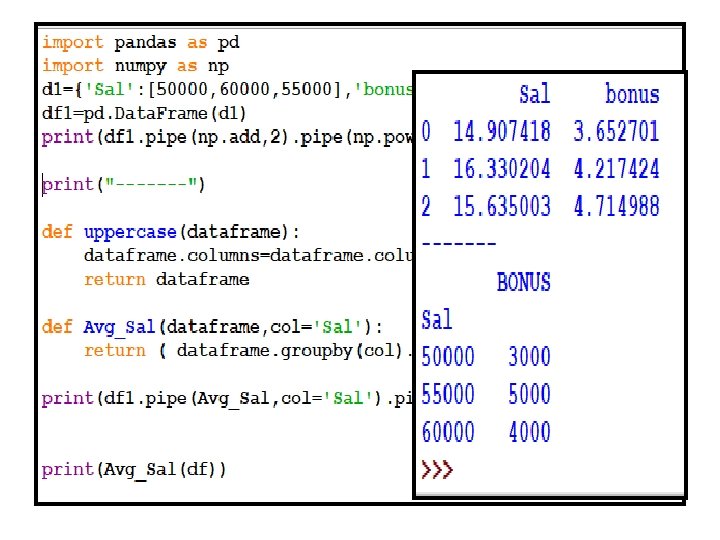
![Pipe(func_name, *args) • d 1={'Sal': [50000, 60000, 55000], 'bonus': [3000, 4000, 5000]} • df](http://slidetodoc.com/presentation_image_h/74926e4be32ddab41434ec7ecc589f42/image-53.jpg "Pipe(func_name, *args) • d 1={'Sal': [50000, 60000, 55000], 'bonus': [3000, 4000, 5000]} • df")
Pipe(func_name, *args) • d 1={'Sal': [50000, 60000, 55000], 'bonus': [3000, 4000, 5000]} • df 1=pd. Data. Frame(d 1) • print(df 1. pipe(np. add, 2). pipe(np. power, 2). pip e(np. divide, 3)) for : divide(power( add(df, 2), 3) • print(df 1. pipe(df 1. add, 2). pipe(df 1. divide, 3))
 function is used to get a concise summary of the")
Pandas. Data. Frame. info() function is used to get a concise summary of the dataframe. Pandas. Data. Frame. describe() Generate descriptive statistics that summarize the central tendency, dispersion and shape of a dataset’s distribution, excluding Na. N values.
 Any groupby operation involves one of the")
Grouping on Dataframe’s Column <DF>. groupby(by=None, axis=0) Any groupby operation involves one of the following operations on the original object. They are − • Splitting the Object • Applying a function • Combining the results In many situations, we split the data into sets and we apply some functionality on each subset. In the apply functionality, we can perform the following operations − • Aggregation − computing a summary statistic • Transformation − perform some group-specific operation • Filtration − discarding the data with some condition
 print(df) print(\"Grouping")
import pandas as pd import numpy as np df=pd. read_csv("result. Analysis. csv") print(df) print("Grouping on Class") grp=df. groupby(by='Teacher Name') print(grp)
")
print(grp. groups)
 print (group)")
for name, group in grp: print (name) print (group)
 method, we can select a single group. print(gp.")
SELECT A GROUP Using the get_group() method, we can select a single group. print(gp. get_group('Namrata'))
![Aggregation • print (grp['Result. Per']. agg(np. mean))](http://slidetodoc.com/presentation_image_h/74926e4be32ddab41434ec7ecc589f42/image-62.jpg "Aggregation • print (grp['Result. Per']. agg(np. mean))")
Aggregation • print (grp['Result. Per']. agg(np. mean))
![Applying Multiple Aggregation Functions at Once print(gp['Result. Per']. agg([np. sum, np. mean, np. std]))](http://slidetodoc.com/presentation_image_h/74926e4be32ddab41434ec7ecc589f42/image-63.jpg "Applying Multiple Aggregation Functions at Once print(gp['Result. Per']. agg([np. sum, np. mean, np. std]))")
Applying Multiple Aggregation Functions at Once print(gp['Result. Per']. agg([np. sum, np. mean, np. std]))
 function •")
To see the size of each group is by applying the size() function • print(gp. agg(np. size))
![Grouping on multiple columns and aggregation gp=df. groupby(by=['Teacher Name', 'Class‘, ’Year’] ). agg(np. mean)](http://slidetodoc.com/presentation_image_h/74926e4be32ddab41434ec7ecc589f42/image-65.jpg "Grouping on multiple columns and aggregation gp=df. groupby(by=['Teacher Name', 'Class‘, ’Year’] ). agg(np. mean)")
Grouping on multiple columns and aggregation gp=df. groupby(by=['Teacher Name', 'Class‘, ’Year’] ). agg(np. mean)
) It transforms the aggregate data by repeating the summary result for each row")
transform()) It transforms the aggregate data by repeating the summary result for each row of the group and makes the result have the same shape as original data

Output before/after transform

Reindexing and Altering Labels
: It simply")
Ch an gin g co lum n l a be ls Rename(): It simply renames the index and/or column labels in a dataframe.

Changing Column label and row index
: It helps to specify new order of by reordering records to be displayed")
Reindex(): It helps to specify new order of by reordering records to be displayed existing indexes and column labels. • <DF>. reindex(index=None, Columns=None, fill_value=nan
 : Used to create indexes/columns labels based on the other dataframe object Observe")
Reindex_like() : Used to create indexes/columns labels based on the other dataframe object Observe that it contains values of common column ‘Physics’

knowledge is of no value unless you put it into practice So, Keep Practicing THANKS
- Slides: 73