
Putting Accessibility to the Test Design of a
Putting Accessibility to the Test: Design of a Multistage Reading Assessment for Accountability Cara Cahalan Laitusis ETS Designing Accessible Reading Assessments
ETS Contributors • • Linda Cook* Kelly Bruce Jennifer Dean Dan Eignor Lois Frankel Gena Gourley Eric Hansen Designing Accessible Reading Assessments • • Branden Hart Teresa King* Skip Livingston Pavan Pillarisetti Kitty Sheehan Elizabeth Stone* Klaus Zechner
DARA Goal 4 • Field test a multi-stage component-based reading assessment. – Reduce number of students performing at “chance level” – Allow students to show what they know – Push instructional to include both comprehension and reading fluently for students with reading-based LD Designing Accessible Reading Assessments
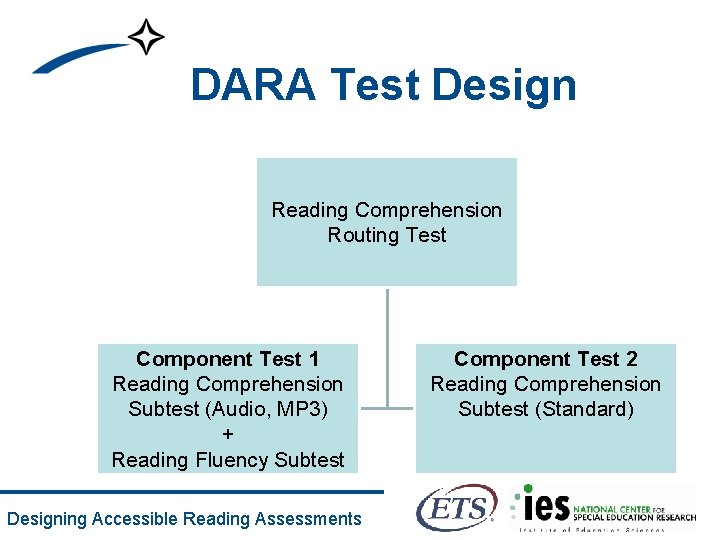
DARA Test Design Reading Comprehension Routing Test Component Test 1 Reading Comprehension Subtest (Audio, MP 3) + Reading Fluency Subtest Designing Accessible Reading Assessments Component Test 2 Reading Comprehension Subtest (Standard)
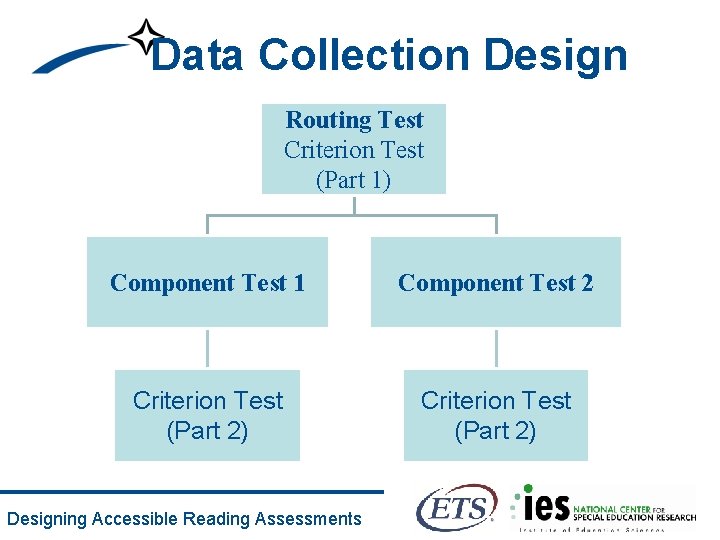
Data Collection Design Routing Test Criterion Test (Part 1) Component Test 1 Component Test 2 Criterion Test (Part 2) Designing Accessible Reading Assessments
Primary Research Questions • For accountability purposes, is it possible to combine scores from the two different routes on the component test (i. e. , average scores from Test 1 and Test 2)? • Is the Component test more accessible than the state assessment – Do RLD students do better on the Component test than the state assessment while students without disabilities (NLD) perform similarly on both assessments? Designing Accessible Reading Assessments
Other Research Questions • Can we reduce the number of students scoring at chance level? • Can we use automated scoring technology (Speech. Rater) to score oral reading fluency measure? • Can we accurately route students based on 7, 14, 21, and 28 items? • What is the best measure of oral reading fluency? • How do we combine fluency and comprehension test scores (50/50, 25/75, 75/25)? Designing Accessible Reading Assessments
Sample • • • 8 th Grade Students 26 Middle Schools 294 RLD (final sample=275) 194 LP (not include in this presentation) 500 Non-Disabled (final sample=486) Designing Accessible Reading Assessments
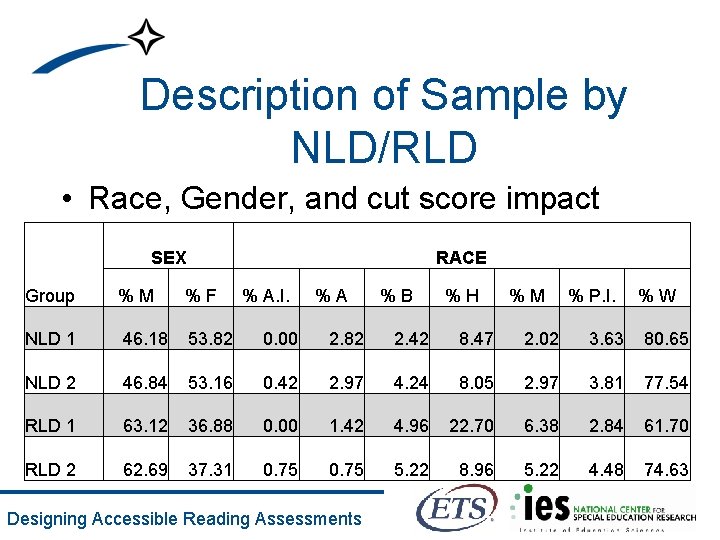
Description of Sample by NLD/RLD • Race, Gender, and cut score impact SEX RACE Group %M %F % A. I. %A NLD 1 46. 18 53. 82 0. 00 2. 82 2. 42 8. 47 2. 02 3. 63 80. 65 NLD 2 46. 84 53. 16 0. 42 2. 97 4. 24 8. 05 2. 97 3. 81 77. 54 RLD 1 63. 12 36. 88 0. 00 1. 42 4. 96 22. 70 6. 38 2. 84 61. 70 RLD 2 62. 69 37. 31 0. 75 5. 22 8. 96 5. 22 4. 48 74. 63 Designing Accessible Reading Assessments %B %H %M % P. I. %W
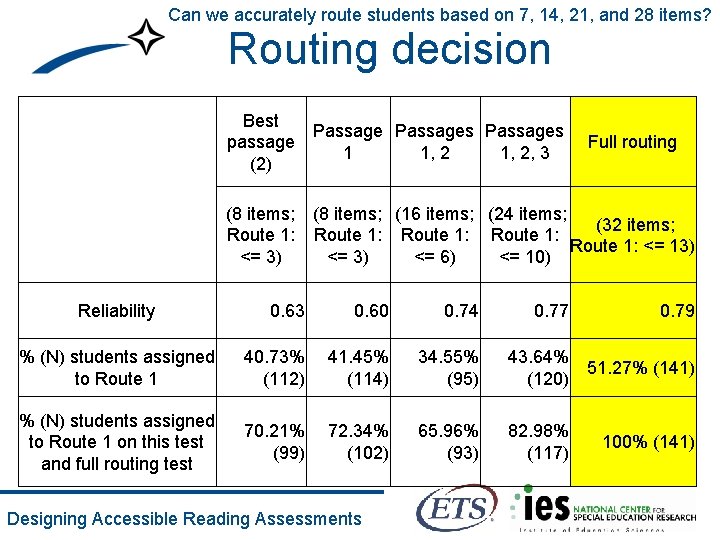
Can we accurately route students based on 7, 14, 21, and 28 items? Routing decision Best Passages passage 1 1, 2, 3 (2) (8 items; Route 1: <= 3) Reliability Full routing (8 items; (16 items; (24 items; (32 items; Route 1: <= 13) <= 6) <= 10) 0. 63 0. 60 0. 74 % (N) students assigned to Route 1 40. 73% (112) 41. 45% (114) 34. 55% (95) 43. 64% 51. 27% (141) (120) % (N) students assigned to Route 1 on this test and full routing test 70. 21% (99) 72. 34% (102) 65. 96% (93) 82. 98% (117) Designing Accessible Reading Assessments 0. 77 0. 79 100% (141)
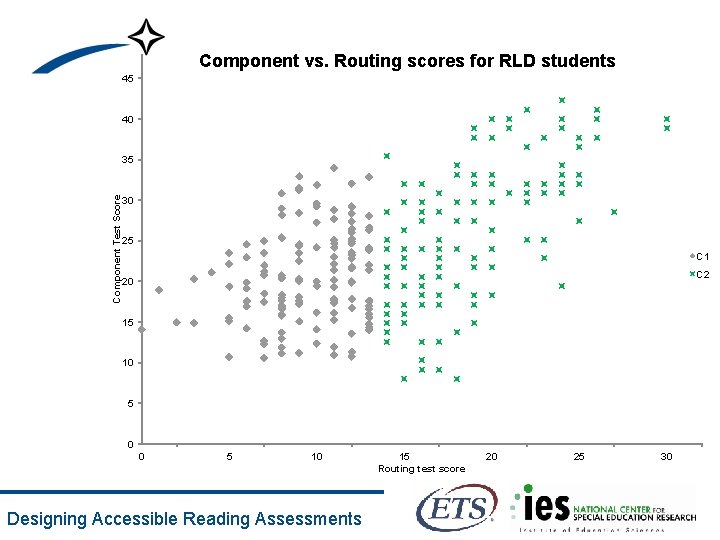
Component vs. Routing scores for RLD students 45 40 Component Test Score 35 30 25 C 1 C 2 20 15 10 5 0 0 5 10 Designing Accessible Reading Assessments 15 Routing test score 20 25 30
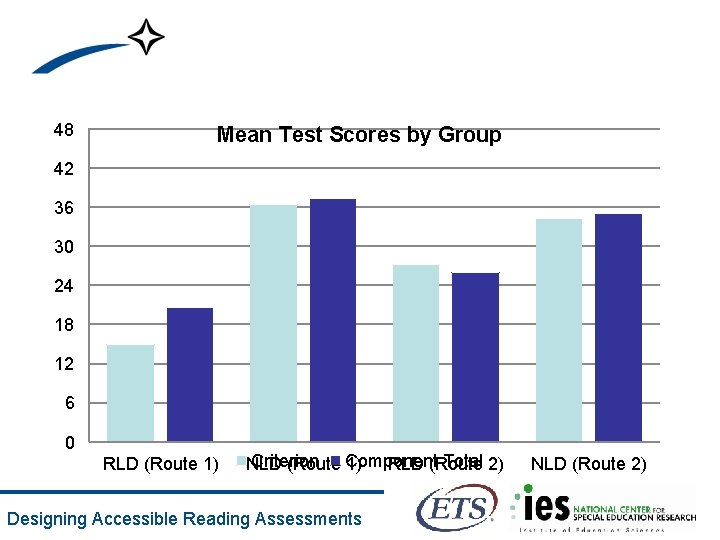
48 Mean Test Scores by Group 42 36 30 24 18 12 6 0 RLD (Route 1) Criterion Total 2) NLD (Route Component 1) RLD (Route Designing Accessible Reading Assessments NLD (Route 2)
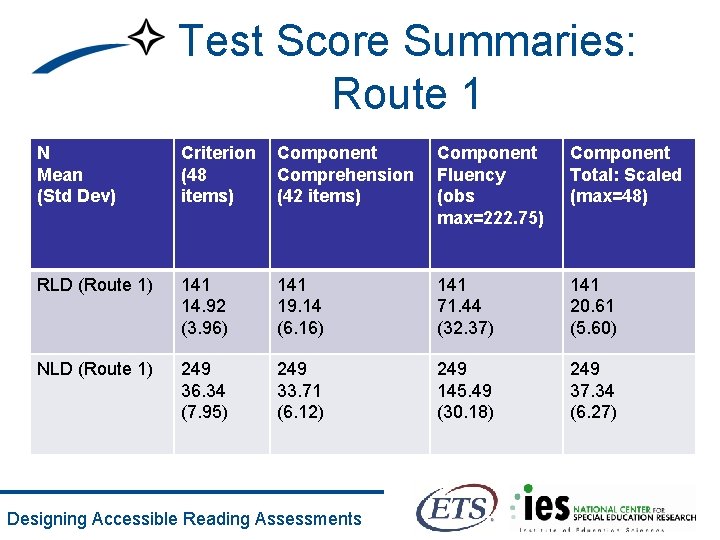
Test Score Summaries: Route 1 N Mean (Std Dev) Criterion (48 items) Component Comprehension (42 items) Component Fluency (obs max=222. 75) Component Total: Scaled (max=48) RLD (Route 1) 141 14. 92 (3. 96) 141 19. 14 (6. 16) 141 71. 44 (32. 37) 141 20. 61 (5. 60) NLD (Route 1) 249 36. 34 (7. 95) 249 33. 71 (6. 12) 249 145. 49 (30. 18) 249 37. 34 (6. 27) Designing Accessible Reading Assessments
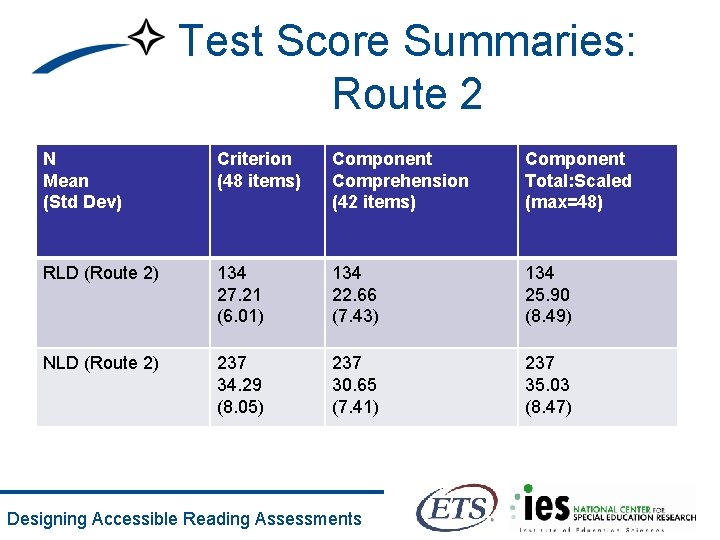
Test Score Summaries: Route 2 N Mean (Std Dev) Criterion (48 items) Component Comprehension (42 items) Component Total: Scaled (max=48) RLD (Route 2) 134 27. 21 (6. 01) 134 22. 66 (7. 43) 134 25. 90 (8. 49) NLD (Route 2) 237 34. 29 (8. 05) 237 30. 65 (7. 41) 237 35. 03 (8. 47) Designing Accessible Reading Assessments
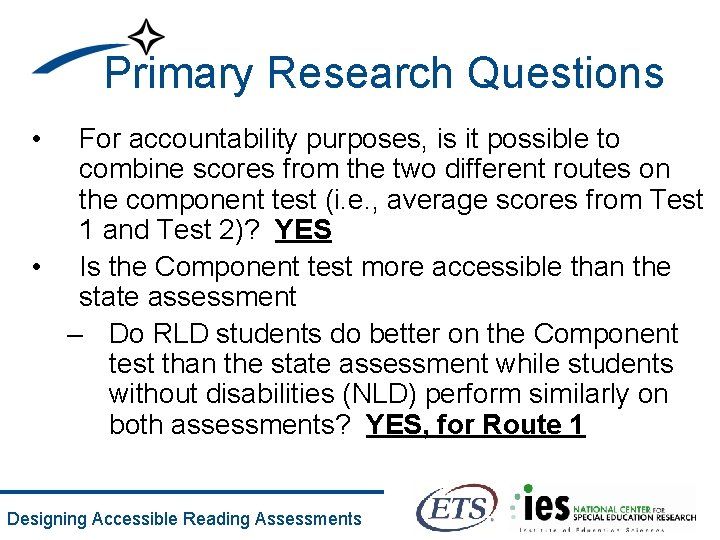
Primary Research Questions • For accountability purposes, is it possible to combine scores from the two different routes on the component test (i. e. , average scores from Test 1 and Test 2)? YES • Is the Component test more accessible than the state assessment – Do RLD students do better on the Component test than the state assessment while students without disabilities (NLD) perform similarly on both assessments? YES, for Route 1 Designing Accessible Reading Assessments
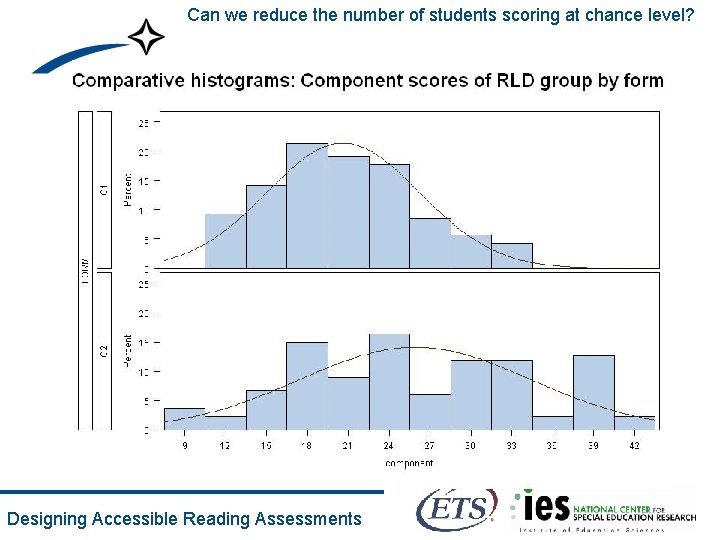
Can we reduce the number of students scoring at chance level? Designing Accessible Reading Assessments
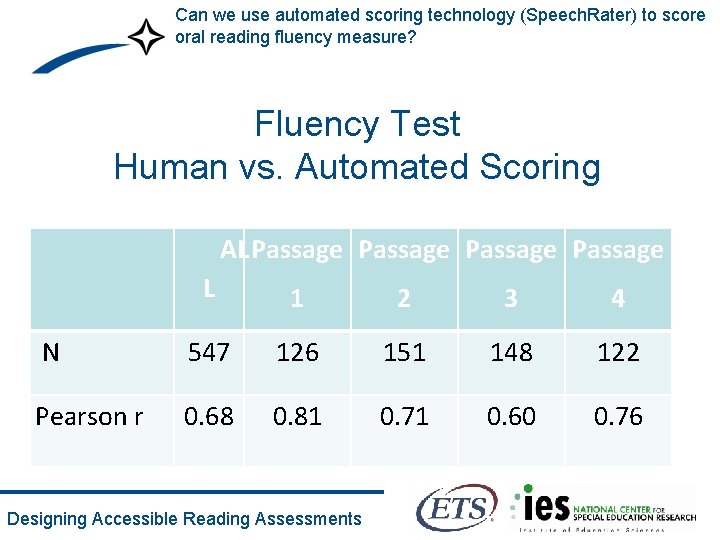
Can we use automated scoring technology (Speech. Rater) to score oral reading fluency measure? Fluency Test Human vs. Automated Scoring AL Passage L 1 2 3 4 N 547 126 151 148 122 Pearson r 0. 68 0. 81 0. 71 0. 60 0. 76 Designing Accessible Reading Assessments
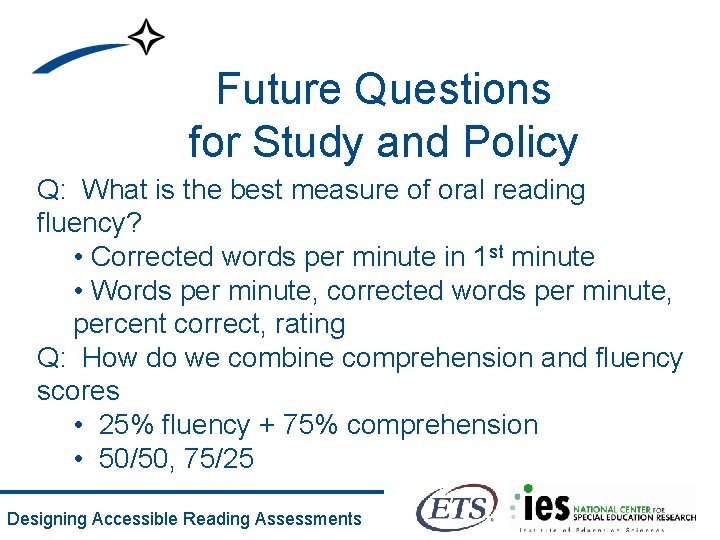
Future Questions for Study and Policy Q: What is the best measure of oral reading fluency? • Corrected words per minute in 1 st minute • Words per minute, corrected words per minute, percent correct, rating Q: How do we combine comprehension and fluency scores • 25% fluency + 75% comprehension • 50/50, 75/25 Designing Accessible Reading Assessments
Extra Slides Designing Accessible Reading Assessments
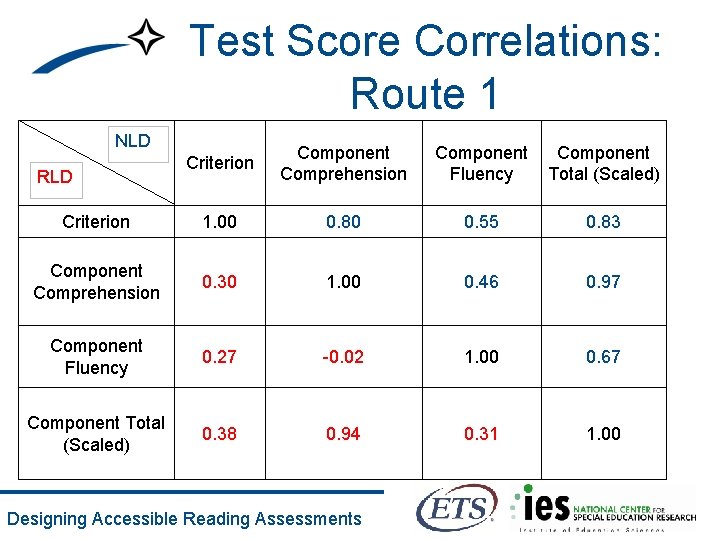
Test Score Correlations: Route 1 NLD Criterion Component Comprehension Component Fluency Component Total (Scaled) Criterion 1. 00 0. 80 0. 55 0. 83 Component Comprehension 0. 30 1. 00 0. 46 0. 97 Component Fluency 0. 27 -0. 02 1. 00 0. 67 Component Total (Scaled) 0. 38 0. 94 0. 31 1. 00 RLD Designing Accessible Reading Assessments
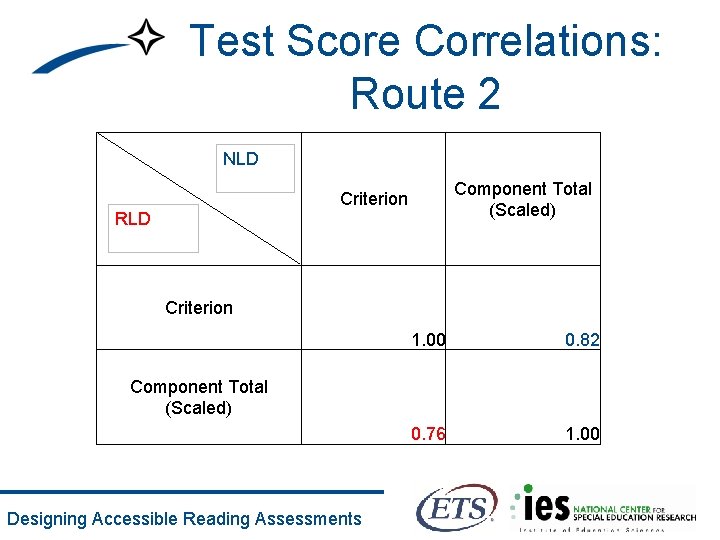
Test Score Correlations: Route 2 NLD Component Total (Scaled) Criterion RLD Criterion 1. 00 0. 82 0. 76 1. 00 Component Total (Scaled) Designing Accessible Reading Assessments
- Slides: 21