PublicPrivate Dialogue Basics of ME 4 th PPD

Public-Private Dialogue Basics of M&E 4 th PPD Workshop April 2009 Vienna Benjamin Herzberg Sr. Private Sector Development Specialist 1
 2")
What do you do in your PPDs? (brainstorming) 2

The Logical Framework 3
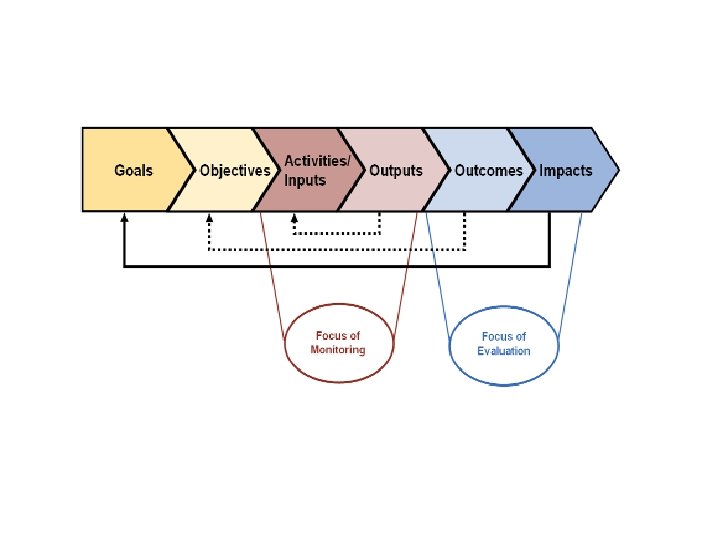

Level of indicat ors Typical examples BEE Examples Inputs / Activit ies Human resources Financial resources Material resources Training for officers Awareness events stakeholders Mapping exercises Outpu ts Products Recommendations/Pl ans Studies/Reports Legislations drafted Mapping reports Press releases Written inspection reports Awareness of various audiences Training for stakeholders Legislative drafting Outco mes Change in knowledge and/or behavior Improved practices Increased services legislation passed Positive client feedback Reduction in number of steps, time and cost in a process Increasing use of mediation center/one-stop shop Impact Increased sales Increased employment Increased profitability for Increased formalization Increased exports/imports Sustainability of

Selecting indicators 6

Indicators used for gathering performance information should be…… SMART S Specific: Reflect what the project intends to change and are able to assess performance M Measurable: Must be precisely defined; measurement and interpretation is unambiguous. Provide objective data, independent of who is collecting data. Be comparable across projects allowing changes to be compared. A Attainable: Achievable by the project and sensitive to change. Feasible time and money to collect data using chosen indicators. Available at a reasonable cost R Relevant: Relevant to the project in question. T Time bound: Describes when a certain change is expected. Indicators used when collecting subjective information should be…. . SPICED S Subjective: Contributors have a special position or experience that gives them unique insights which may yield a high return on the evaluator’s time. What may be seen by others as 'anecdotal' becomes critical data because of the source's value. P Participatory: Indicators should be developed together with those best placed to assess them. This means involving the ultimate beneficiaries, but it can also mean involving local staff and other stakeholders. • I Interpretable: Locally defined indicators may be meaningless to other stakeholders, so they often need to be explained. C Cross-checked: The validity of assessment needs to be cross-checked, by comparing different indicators and progress, and by using different informants, methods, and researchers. E Empowering: The process of setting and assessing indicators should be empowering in itself and allow groups and individuals to reflect critically on their changing situation D Disaggregated: There should be a deliberate effort to seek out different indicators from a range of groups, especially men and women. This information needs to be recorded in such a way that these differences can be assessed over time.

Output indicators Number of entities receiving advisory services Number of media appearances Number of new laws/regulations/amendments/codes drafted or contributed to the drafting Number of participants in workshops, training events, seminars, conferences Number of participants reporting satisfied or very satisfied with workshops, training, seminars, conferences, etc. Number of procedures/policies/practices proposed for improvement or elimination Number of reports (assessments, surveys, manuals) completed Number of women participants in workshops, training events, seminars, conferences, etc. Outcome indicators: Average number of days to comply with business regulation Average official cost to comply with business regulation Number of businesses completing a new/reformed procedure in a given jurisdiction Number of entities that implemented recommended changes Number of recommended laws/regulations/amendments/codes enacted Number of recommended procedures/policies/practices that were improved/eliminated Number of cases successfully settled through ADR Number of days to settle a case through ADR Number of jurisdictions reporting at least one Doing Business reform Number of reforms resulting from advisory service as measured by Doing Business Number of investor inquiries in targeted sectors leading to an investment Score obtained by Investment Promotion Intermediary on IP performance review Impact indicators: Number of formal jobs Value of aggregate private sector savings from recommended changes (US$) Value of investment/financing facilitated by advisory services (US$) Value of funds released through ADR (US$)

PPD Output indicators PPD Outcome indicators PPD Impact indicators Overall score from PPD Process Evaluation Wheel Number of entities receiving in-depth advisory services Number of reports (assessments, surveys, manuals) completed Number of procedures/policies/practices proposed for improvement or elimination Number of new laws/regulations/amendments/codes drafted or contributed to the drafting Number of participants in consultative workshops, training events, seminars, conferences, etc Number of women participants in consultative workshops, training events, seminars, conferences, etc Number of media appearances Overall Reform Process Score from PPD Reform Process Table Number of recommended laws/regulations/amendment s/codes enacted (2) Number of recommended procedures/policies/practices that were approved/eliminated (8) Number of entities that implemented recommended changes Value of aggregate private sector savings from recommend ed changes (US$)
 10")
Getting Baseline Data (exercise, participants go online) 10

Business Environment Snapshots • one-stop guide to business environment indicators, laws, and World Bank Group project information for 151 countries. • Investment Climate indicators • Key Doing Business and Enterprise Survey data • Quantitative data • Legislation http: //rru. worldbank. org/BESnapshots/ • WBG analytical reports • WBG projects

Evaluating results 12

Criteria Definitions Core questions Business registration reform examples Relevance The extent to which the aid activity and strategy is responsive to the priorities and policies of the target group, recipient and donor. Does the intervention address needs? Is it consistent with the policies and priorities of major stakeholders? Is it compatible with other efforts? Does it complement, duplicate or compete? Were regulatory issues correctly identified as the key problem for business registration? Was the type of technical assistance provided appropriate for helping to address the key problems identified? Effectiveness The extent to which an aid activity attains its objectives and the degree to which desired outcomes are achieved through products and services provided. Are the desired objectives being achieved at outcome and impact/goal level? Does it add value to what others are doing? To what extent are partners maximizing their comparative advantage? Has the registration experience improved for enterprises and made it easier to establish a new business? Has the registration experience improved for those institutions implementing these regulations? Efficiency The operational and administrative efficiency of projects and services provided. Are we using the available resources What is the cost benefit analysis of technical wisely and well? assistance inputs against the benefits of: What is the efficiency of communication -cheaper start-up for mechanisms, knowledge management enterprise and time saving on and coordination with other agencies? the process How can we measure outputs – both -lower cost per registration for qualitative and quantitative – in relation to the implementing registration inputs? agency -decrease in time taken to process an application for the agencies Sustainability Measuring whether the benefits of an activity are likely to continue after donor funding has been withdrawn. Will the outcomes and impacts be sustained after external support has ended? Will activities, outputs, structures and processes established be sustained? Have the changes in procedures been ‘formally’ approved and constituted in the system? Have the changes in practices been embedded into operations and review systems? The positive and negative changes produced by a development intervention, directly or indirectly, intended or unintended. What changes, positive or negative have occurred? Are these changes attributable to the initiative? Is it cheaper and easier for businesses to start up? Are more new businesses formally registering? Does easier business registration mean that new businesses are better performing in early stages? Has the reputation and client services of the agencies improved? Impact
 Here the program participants")
Different types of evalutaions 1. Non-experimental Post-program judgment/expert opinion. (PPJ) Here the program participants are consulted after the intervention and asked to estimate the extent to which performance was enhanced as a direct result of the program Before & After assessment (BAA). As the name suggests, this is a way to measure change by consulting with the program participants and measuring program indicators before (baseline data/information) and after receiving the intervention. 2. Quasi-experimental These approaches compare intervention participants and some form of nonintervention control or comparator group both before and after the intervention. Different rationales are used to assign control groups but this is undertaken in a non randomised way. 3. Experimental This approach looks at two groups before and after the intervention. There should be random assignment of the population into the project or treatment group who receive the intervention services and a control group, who do not. 14

Evidence based Any evaluation needs to be evidence-based Exemple of the Mekong PPD evaluation, which required: Record keeping 1034 documents indexed and reviewed 246 companies surveyed (77% of participants vs. 23% non) 71 senior experts interviewed from government, donor community, private sector and civil society 15

Exemple of the Mekong PPD evaluation: Evaluation wheel 1 - Organizational process effectiveness Cambodia Lao PDR Vietnam 16

2 - PPD impact scores for reform process Exemple of the Mekong PPD evaluation: Reform process tables Cambodia 0 The PPD had no impact on step 1 Step benefited from input from PPD 2 PPD was crucial in accelerating step Lao PDR Vietnam 3 PPD was solely responsible for step Cambodia Scanning at Sihanoukville Port VAT Refund on Goods Destined for Export Garment Tax Holiday Extension Banking Sector Ratios and Licensing Siem Reap Ring-Road No. 6 Accommodation Tax Lao Timber for wood-based manufacturing Tourist visas Tourist tax Speedboat controls in Luang Prabang. Vietnam Circular 100 Common Investment Law Dual pricing Personal Income Tax Unified Enterprise Law 17

Exemple of the Mekong PPD evaluation: Putting numbers on results, and trying 3 - Strong, measurable economic impact to compare costs to benefits Time for Export and Import in Cambodia or Employing Workers in Vietnam àSub-indicators positively influenced Annual private sector’s pro bono input = $950, 000; IFC/donors input = US$345, 000 àprivate sector values the PPDs at levels exceeding the donor funding Private sector savings (past 5 years, sample of 15 reforms): US$237. 9 M in Vietnam; US$69. 2 M in Cambodia; US$2. 7 M in Laos US$309. 8 M Based on the direct impact evaluated, Return on Investment or the private sector gains for each dollar invested in the partnerships by the IFC/donors across the three countries is at least US$291. US$1 ROI = US$291 18

Exemple of the Mekong PPD evaluation: Limiting evaluation of private sector 3 - Strong, measurable economic impact savings to reforms where data is available 1 - Reduction of Sihanoukville port entry fees 2 - Toll fee on RN 4 3 - Garment sector tax holiday 4 - Removal of scanners at Sihanoukville port 5 - Phone taxes 6 - Postponement of tax on accommodation 7 - Reduction of the Export Management Fees (EMF) by the Ministry of Commerce 8 - Delivery of permanent licenses to banks and microfinance institutions 9 - Reduction of solvency ratio from 20 to 15% for commercial and specialized banks 19

Exemple of the Mekong PPD evaluation: An example of calculation 3 - Strong, measurable economic impact Removal of scanners at Sihanoukville port $1, 044, 000 In 2005, during the G-PSF, the PM cancelled systematic scanning of containers at the Sihanoukville port. MOC figures report 1. 500 containers scanned per month. At an average price of US$58 per scanning, the total annual savings of the PS equals 1, 044, 000. 2005, ongoing $2, 088, 000 Additionally, because of scanning exporters often had to resort to air freight to meet turnaround times. This was roughly valued at over US$100 M annually by the GMAC Chairman. 20

Cost Benefit Analysis Exercise The “back of the enveloppe” technique 21
- Slides: 21