Publications Report John Vig VP Publications November 2013

Publications Report John Vig VP, Publications November 2013 Baltimore, MD, USA

SJ Ei. C report VP, Pub. report Web Ei. C report Newsletter 2 11/26/2020
 Unique visitors: 2.")
IEEE Xplore® Contains 3. 6 M articles (incl. IET, AIP, IBM…) Unique visitors: 2. 9 M in Aug; Highest: 4. 2 M in Apr IEEE Electronic Library (IEL) § 165 IEEE journals, transactions & mag’s (+63% in 13 yrs) § ~1, 300 conference proceedings § >2, 200 IEEE Standards § Backfile to the late 1800 s § ~20, 000 new articles added each month Most of the usage is in Asia 3

IEEE Article Count Shows Value Placed on High Quality Publications Journal articles = 36, 571 > twice the 17, 400 in 2003 Conference articles = 176, 550 > twice the 87, 300 in 2003

New Xplore Features 5 11/26/2020

~10% growth/y = new sales + price increases 6 11/26/2020
 – started 2001 IEEE Internet")
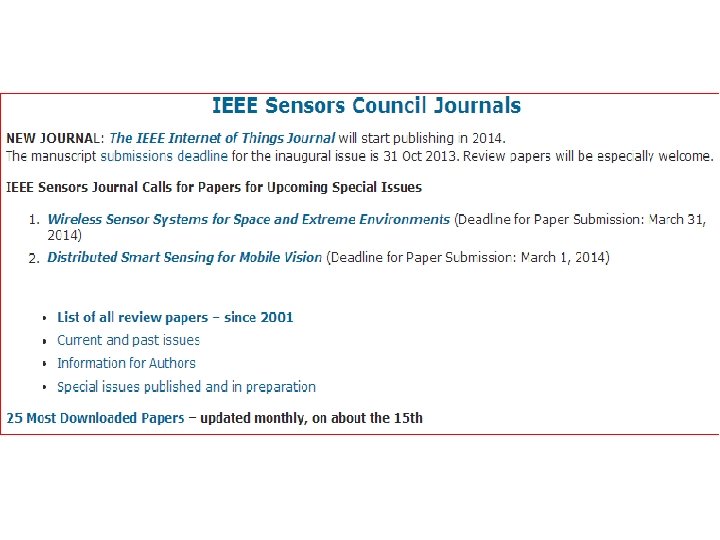
Portfolio of Sensors Council Pubs IEEE Sensors Journal (SJ) – started 2001 IEEE Internet of Things Journal (Io. T-J) – 2014 start IEEE Transactions on Big Data (TBD) – 2015 start Conference proceedings: - IEEE SENSORS - IEEE Int’l Symp. on INERTIAL SENSORS and SYSTEMS (ISISS) - International Conference on Intelligent Sensors, Sensor Networks and Information Processing (ISSNIP) - IEEE World Forum on Internet of Things 2014 (WF-Io. T) 7 11/26/2020

IEEE Sensors Journal – some metrics Published ~5, 000 pages in 2013 Articles published*: 475 in 2012; 626 in 2013 Xplore downloads*: 335 K in 2012; 180 K in 1 H 2013 Sub-to-epub (weeks) – 4 Q 12: 22. 9 ave. ; 20. 8 median – 1 Q 13: 18. 2 ave. ; 12. 4 median – IEEE, 1 Q 13: 34. 0 ave. ; 29. 3 median 100% of submissions plagiarism checked List of review papers added to website (69, so far) -------- * Determine no. 1 source of revenues, but with 2 yr lag 8 11/26/2020

IEL Distribution Algorithms Online periodicals algorithm: § Usage: 55% § Content: 35% § Base: 10% Online conference pub algorithm: § Usage: 65% § Content: 35%

Periodicals Usage: 55% of online net Usage defined as “Article Views” for content (i. e. PDF, HTML), not abstracts or search hits, via IEEE Xplore. Year X’s budget is based on calendar year X-2 activity*. Usage measured by use of only institutional package users (IEL/ASPP Online), not usage in other venues (i. e. member usage, Enterprise usage, nonmember online individual sub usage) Publication’s portion is proportional to its share of the total institutional periodical package usage --------* 2014 budget is based on the 2012 usage. For conference pubs, it’s based on 2012 + 2011 usage.
 contributed")
Periodicals Content: 35% of online net Based on the amount of content (“articles”) contributed to Xplore Year X’s budget is based on 3 -year window, CYs (X-2) + (X-3) + (X-4)* Publication’s portion is proportional to its share of the total periodical article content --------* 2014 budget is based on 2012 + 2011 + 2010 content. The same is true for conference pubs.

Base: 10% of online net Equal distribution of the 10% to all societies/councils that provide periodical publication content in that year to Xplore 2012 “Base” = $78, 574
")
SJ Pages & Articles Published Per Year 13 Pages Published Articles Published (determines expenses) (determines revenues) 2001 (July-Dec) 384 37 2002 706 75 2003 860 107 2004 892 118 2005 1, 508 186 2006 1, 772 223 2007 1, 808 238 2008 2, 148 283 2009 2, 112 272 2010 1, 976 266 2011 3, 557 454 2012 3, 483 475 2013 4991 626 11/26/2020 Total since start 26, 197 3, 122

Annual Xplore Downloads of SJ Articles Year Downloads % of Total Rank 1 H, 2013 180, 035 0. 36 33 2012 335, 207 0. 36 37 2011 269, 199 0. 29 46 2010 197, 780 0. 23 53 2009 153, 510 0. 20 64 2008 159, 950 0. 22 61 2007 147, 278 0. 20 70 2006 136, 536 0. 13 67 2005 85, 605 0. 13 91 2004 70, 268 0. 27 92 2003 36, 008 0. 06 102 2002 11, 587 0. 06 105 Total since start 14 11/26/2020 1, 782, 962 Ave. DLs per article 107

2012 Xplore Downloads of SJ Articles by the articles’ year of publication 15 11/26/2020 Year Downloads Total 335, 207 2012 112, 780 2011 82, 791 2010 25, 650 2009 23, 185 2008 22, 061 2007 17, 416 2006 15, 636 2005 10, 319 2004 7, 293 2003 6, 141 2002 5, 808 2001 5, 350 58% 42%

2012 Downloads of IEEE SENSORS Articles from IEEE Xplore Proc. Year Downloads Note 2012 0 Missed deadline; but, 21, 266 by 30 Jun 2011 29, 651 2010 22, 835 2009 13, 643 2008 10, 325 2007 9, 386 2006 8, 359 2005 8, 557 2004 9, 811 2003 5, 253 2002 7, 183 16 Total 11/26/2020 125, 003 vs. 335, 207 SJ downloads (37%)

2012 Downloads of ISSNIP Articles from IEEE Xplore Proc. Year Downloads Note 2012 0 No conference held this year 2011 4, 853 2010 2, 756 2009 2, 831 2008 3, 202 2007 3, 455 2006 0 2005 1, 490 2004 2, 406 Total 20, 993 17 11/26/2020 No conference held this year = 19% of IEEE SENSORS downloads 2004 -2012
 - IEEE SENSORS - International Conference on Intelligent Sensors,")
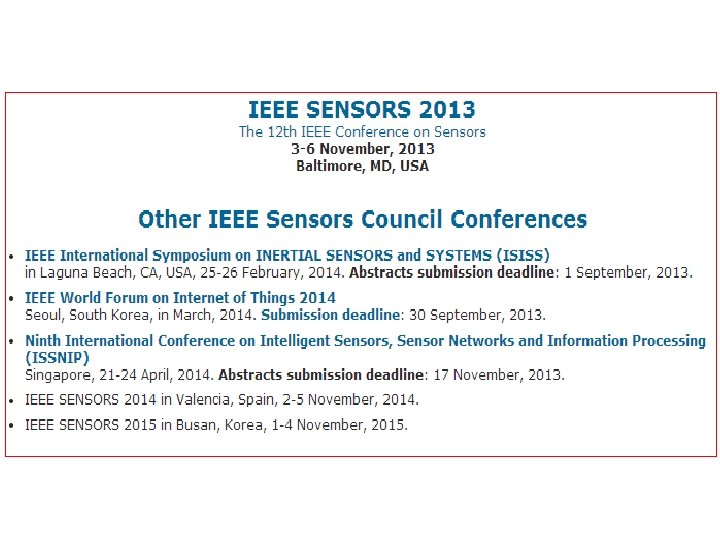
Conference Proceedings Current (revenue producing) - IEEE SENSORS - International Conference on Intelligent Sensors, Sensor Networks and Information Processing (ISSNIP) Future - IEEE Int’l Symp. on INERTIAL SENSORS and SYSTEMS (ISISS) - IEEE World Forum on Internet of Things 2014 (WF-Io. T) 18 11/26/2020
 Usage (“Downloads”) % Total Use 2008 A 159,")
SJ Usage vs. $$$ (in US$) Usage (“Downloads”) % Total Use 2008 A 159, 954 0. 216 2009 A 153, 910 0. 195 Year Usage Payout 2010 A $99, 398 197, 780 0. 233 2011 A $90, 528 269, 199 0. 291 2012 A $128, 784 335, 207 0. 361 2013 F $157, 365 2014 B $164, 918 "year X’s budget, based on calendar year (CY) X-2 activity" 19 11/26/2020
 (X-2)+(X-3)+(X-4) 2006 223 2007 238 2008")
SJ Content vs. $$$ Year Content Payout (articles) (X-2)+(X-3)+(X-4) 2006 223 2007 238 2008 A 283 2009 A 267 2010 A $130, 786 264 744 2011 A $130, 675 454 788 2012 A $154, 560 475 814 2013 F $180, 317 626 985 2014 B $187, 422 1193 2015 B 1555 "For year X’s budget, based on CY X-2, X-3 & X-4; 3 -year window" 20 11/26/2020
 IEEE Total distribution to conferences = 27. 7")
2012 Conference Pub Distribution (in US$) IEEE Total distribution to conferences = 27. 7 M SC $$$ for Usage* = 44. 9 K SC $$$ for Content* = 18. 2 K Net to SC = 46. 5 K = 0. 17% of Total --------* Includes IEEE SENSORS & ISSNIP

2012 -14 Sensors Journal Budgets 2012 Actual 2013 Budget 2014 Budget Page Budget 2, 500 3, 000* 3, 500 Total Income 563 K 641 K 580 K Total Expenses 383 K 358 K 309 K Total Net 181 K 283 K* 271 K * Actual 2013 pages = 4, 991 Will lower Total Net by ~200 K 22 11/26/2020

Sensors J. Monthly Submissions Jan 2011 to Jun 2012 23 11/26/2020

Sensors J. Monthly Submissions Jul 2012 to Sep 2013 24 11/26/2020

2014 SJ Pages Projection Submission rate ~110 articles per mo. Acceptance rate = 33% (Sep 12 to Sep 13) Projected pages published in 2014 (assuming 8 pages/article) = 3, 500 25 11/26/2020

Print Subscriptions’ Decline Year Subscribers Member/NM/ Student Prices Electronic Prices 19 / 395 / 10 35 / 735 / 18 25 / 735 /13 30 / 1, 020 / 18 US$ 26 2002 2, 177 2006 1, 493 2007 1, 313 2008 1, 150 2009 1, 046 2010 873 2011 839 50 / 1, 070 / 25 2012 582 75 / 1, 190 / 75 US$ 2013 120 / 1, 295 / 120 50 / 1, 125 / 28 2014 150 / 1, 550 / 150 50 / 1, 350 / 28 11/26/2020

IEEE Io. T Activities IEEE SENSORS 2012 Io. T Special Session IEEE Sensors J. Io. T Special Issue – Oct 2013, >100 papers submitted; 34 published IEEE Io. T Journal approved Feb 2013; SC owns 34% Io. T-J inaugural issue: Feb 2014 IEEE Io. T conference – WF-Io. T, Seoul, Korea, March 2014; SC owns 10% http: //iot. ieee. org/journal, http: //iot. ieee. org/conference 27 26 -Nov-20

IEEE Io. T Journal Cosponsors IEEE Sensors Council – 34% & Admin. Partner IEEE Communications Society – 33% IEEE Computer Society – 33% Signal Processing Soc. – Technical Cosponsor 28 26 -Nov-20
 Sources: sensors, Io. T, meteorology, genomics, NSA… BD")
IEEE Transactions on Big Data (TBD) Sources: sensors, Io. T, meteorology, genomics, NSA… BD challenges: how to capture, organize, store, search, share, transfer, analyze, and visualize (exabyte=1018 bytes) Phase 2 proposal stage – 2015 start, if approved Financial % ownership: IEEE Computer Society (IEEE CS) 30% IEEE Communications Society (IEEE Com. Soc) 25% IEEE Computational Intelligence Society (IEEE CIS) 7. 5% IEEE Sensors Council 7. 5% IEEE Signal Processing Society (IEEE SPS) 7. 5% IEEE Systems, Man, and Cybernetics Society (IEEE SMCS) 7. 5% IEEE Consumer Electronics Society (IEEE CES) 5% IEEE Systems Council 5% IEEE Vehicular Technology Society (IEEE VHS) 5% 29 11/26/2020

Website Status as of October 2012 John Vig, Web Ei. C Anil Roy, Webmaster
 John Vig is Web")
Website Facts Anil Roy is Webmaster (started 1 Jan 2011) John Vig is Web Ei. C (started 1 Jan 2011) Redesigned website, transferred old website’s content & made many improvements Built on Word. Press (public domain software) Hosted at IEEE Entity Web Hosting Plan to redesign the website URL: www. ieee-sensors. org 34 11/26/2020

Website Analytics, 3 months to 10/25 1, 979 unique visitors 3, 042 visits 7, 320 pageviews (2. 4 pageviews/visit) Ave. visit duration = 3: 58 minutes Most visits from: 1. USA 6. Germany 2. China 7. Taiwan 3. India 8. Italy 4. Japan 9. U. K. 5. S. Korea 10. Brazil Use analytics for venue selection? (Spain: 46) 35 11/26/2020
 Rank Pageviews 1 / 2, 139 2 /journals 1,")
Most Viewed Pages (3 months) Rank Pageviews 1 / 2, 139 2 /journals 1, 158 3 /information-for-authors 664 4 /ieee-sensors-journal 559 5 /conferences 293 6 /isiss 2014 283 7 /ieee-sensors-council-journals 218 8 /administrative-committee-and-otherofficials 172 9 /ieee-sensors-letters 145 /dlp 102 10 36 Page 11/26/2020

Sensors Council e. Mailing List
 harvests email addresses o Switched to Mail Chimp in")
o Student (in India) harvests email addresses o Switched to Mail Chimp in September 2013. Since then, three email blasts have been sent: 1. September general mailing 2. October general mailing 3. Washington/Northern VA, Baltimore Sections advertising the SENSORS conference Industry Panel. 38 11/26/2020

Statistics DATE NUMBER SENT BOUNCES SUCCESSFUL OPEN RATE* UNSUBSCRIBE WORD COUNT 9/17 50, 142 1, 344 48, 798 16% 95 300 10/3 50, 059 729 49, 330 19% 95 138 10/11 2, 300 90 2, 210 26% 7 275 * Open rate is a minimum, not the actual. “Each time someone opens your email and views the images within it, that open-tracker graphic is downloaded from our server. Each time that graphic is downloaded, we'll count that as an open on your campaign report. ” 39 11/26/2020

Recorded Presentations

Anil Roy is project leader. Last year: o Free downloads took place over 6 days; 2 days during the conference and 4 days following the conference. o Presentations downloaded 10, 161 times as of day 6 o 290 of the 650 registrants downloaded at least one presentation (average = 35 per downloader) o 150 presentations of the 266 oral presentations (of the 580 accepted papers), plus 5 tutorials were recorded. The rest were poster papers & authors who opted out on copyright form. 42 11/26/2020

This Year URL: http: //sensors 2013 online. org/ Estimated project cost: ~$3000 Free from 4 November to 10 November Charge after midnight 10 November - Regular papers: $5 - each - Tutorial papers: $25 - each Old presentations will be archived on website 43 11/26/2020

Newsletter

Why Discontinue It? Website has been more of a "newsletter" than the newsletter; more timely too. The newsletters we have published just repeated old news, like the award winners Councils have no members to be kept informed. Are the website & email blasts not sufficient to keep the sensor community informed? We have a Newsletter tab on our website, a cause of disappointment? 45 11/26/2020

Questions? Comments? 46
- Slides: 45