
Public Finance 10 th Edition David N Hyman

Public Finance, 10 th Edition David N. Hyman Chapter 1 INDIVIDUALS AND GOVERNMENT © 2011 Cengage Learning. All Rights Reserved. May not be scanned, copied or duplicated, or posted to a publicly accessible website, in whole or in part.

Allocation of Resources are allocated between government and private use: • For government use: - • For private use: - • Roads Schooling Fire Protection Food Clothing Units of private goods and services are forgone by individuals so that government can provide goods and services. © 2011 Cengage Learning. All Rights Reserved. May not be scanned, copied or duplicated, or posted to a publicly accessible website, in whole or in part.
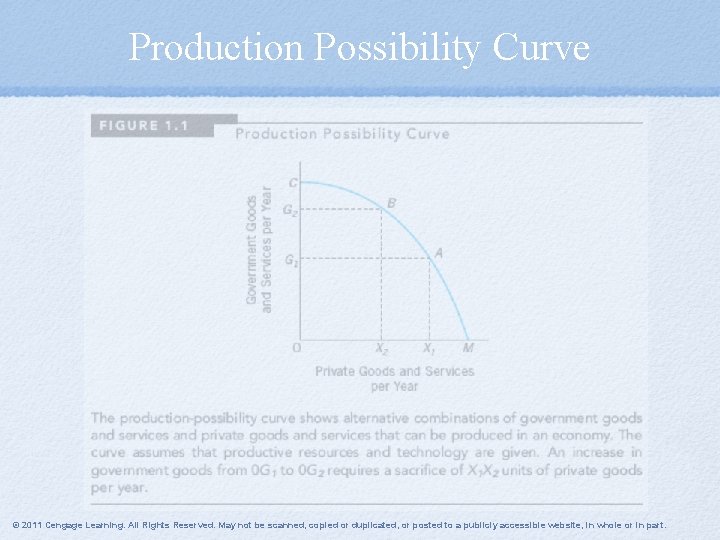
Production Possibility Curve © 2011 Cengage Learning. All Rights Reserved. May not be scanned, copied or duplicated, or posted to a publicly accessible website, in whole or in part.

The Mixed Economy Characteristics of a mixed economy: • Government supplies many goods and services • Government regulates private economic activity • Government expenditures equal ¼ to ½ of GDP • Government participates in markets as a buyer of goods and services © 2011 Cengage Learning. All Rights Reserved. May not be scanned, copied or duplicated, or posted to a publicly accessible website, in whole or in part.
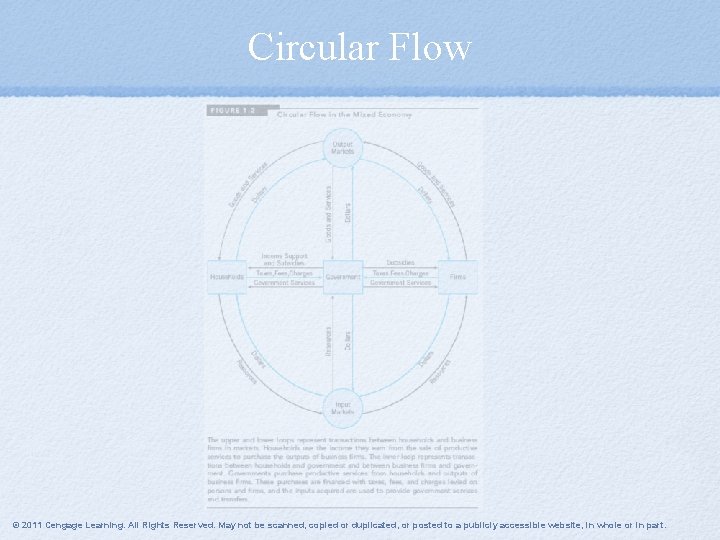
Circular Flow © 2011 Cengage Learning. All Rights Reserved. May not be scanned, copied or duplicated, or posted to a publicly accessible website, in whole or in part.

Government Expenditures in the U. S. • Government purchases divert productive resources from private use: - National defense • Steel, labor • Government transfer payments redistribute purchasing power among citizens: - Social benefits • Social Security, Medicare © 2011 Cengage Learning. All Rights Reserved. May not be scanned, copied or duplicated, or posted to a publicly accessible website, in whole or in part.
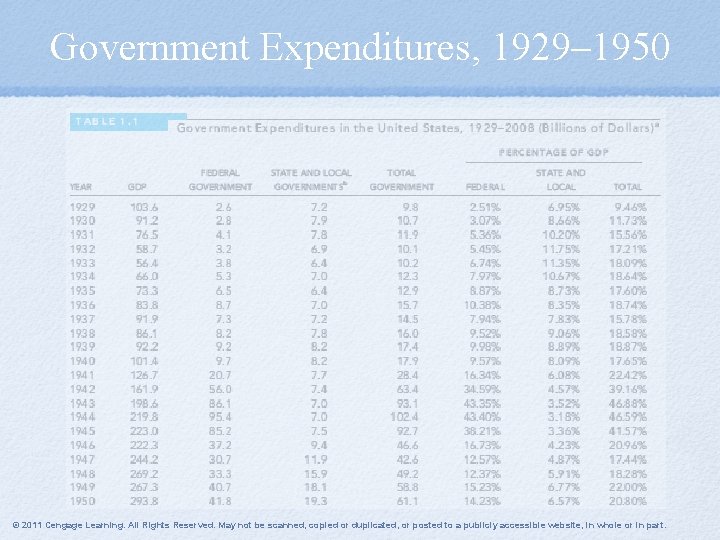
Government Expenditures, 1929– 1950 © 2011 Cengage Learning. All Rights Reserved. May not be scanned, copied or duplicated, or posted to a publicly accessible website, in whole or in part.
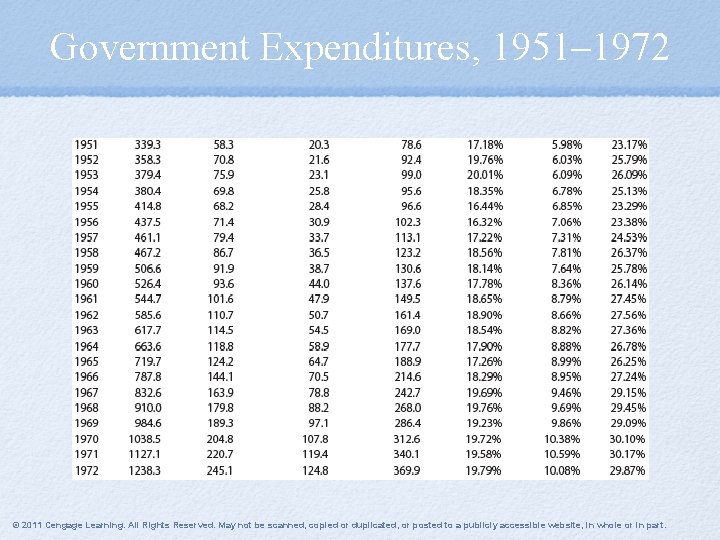
Government Expenditures, 1951– 1972 © 2011 Cengage Learning. All Rights Reserved. May not be scanned, copied or duplicated, or posted to a publicly accessible website, in whole or in part.
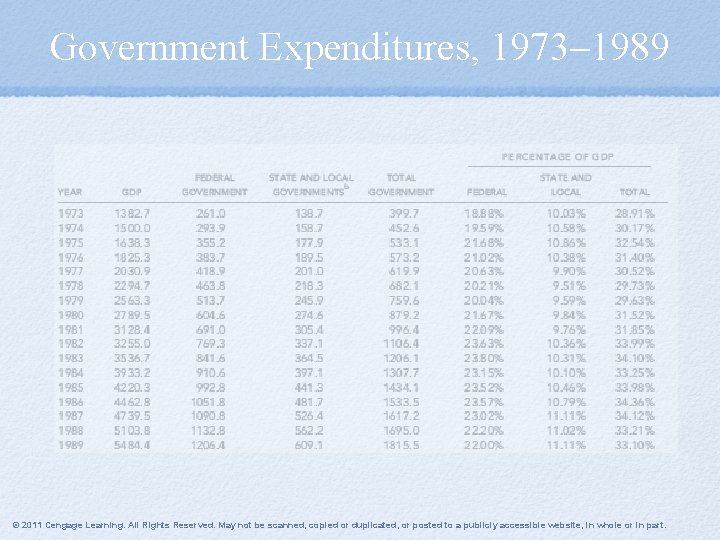
Government Expenditures, 1973– 1989 © 2011 Cengage Learning. All Rights Reserved. May not be scanned, copied or duplicated, or posted to a publicly accessible website, in whole or in part.
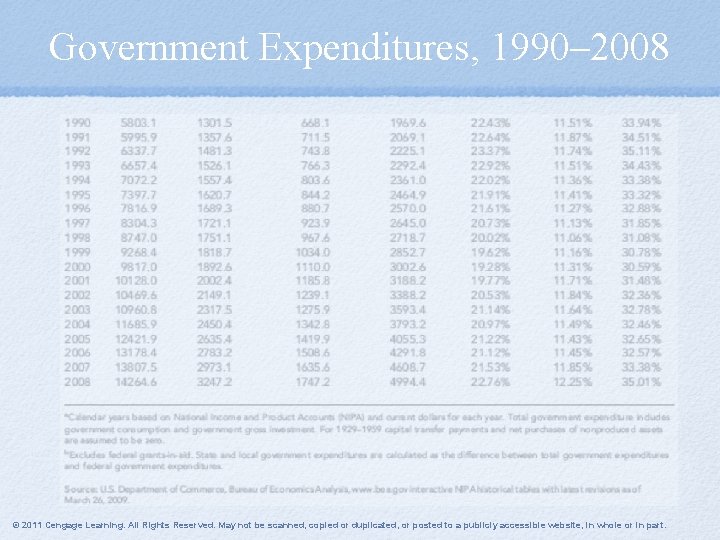
Government Expenditures, 1990– 2008 © 2011 Cengage Learning. All Rights Reserved. May not be scanned, copied or duplicated, or posted to a publicly accessible website, in whole or in part.
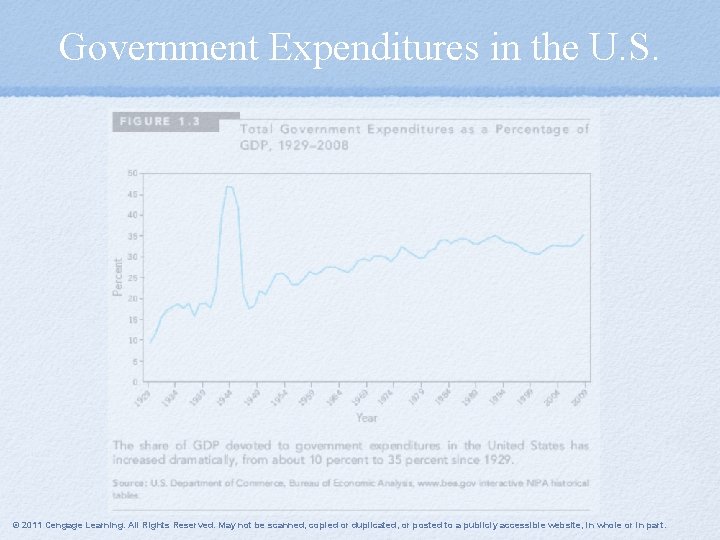
Government Expenditures in the U. S. © 2011 Cengage Learning. All Rights Reserved. May not be scanned, copied or duplicated, or posted to a publicly accessible website, in whole or in part.
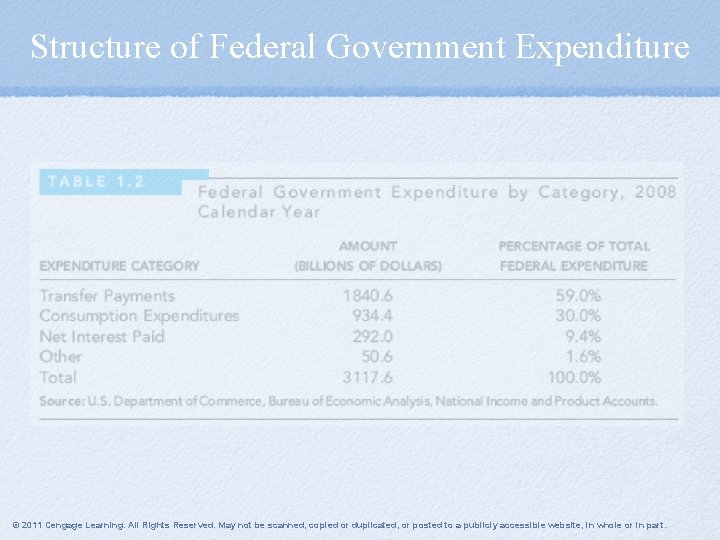
Structure of Federal Government Expenditure © 2011 Cengage Learning. All Rights Reserved. May not be scanned, copied or duplicated, or posted to a publicly accessible website, in whole or in part.
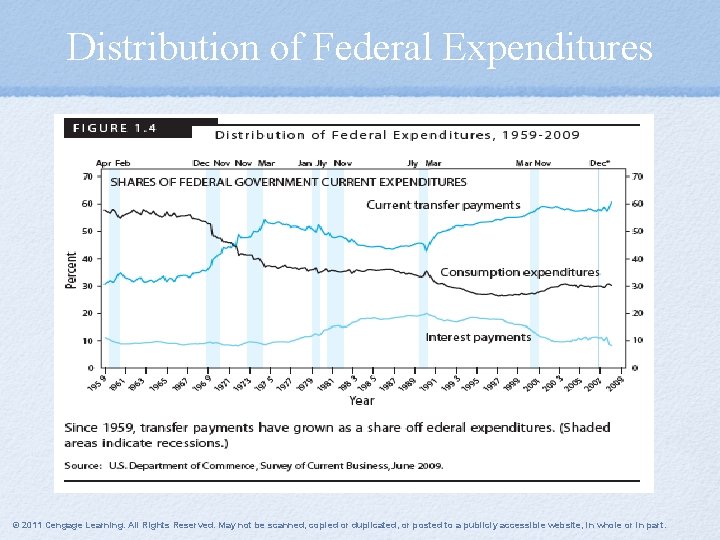
Distribution of Federal Expenditures © 2011 Cengage Learning. All Rights Reserved. May not be scanned, copied or duplicated, or posted to a publicly accessible website, in whole or in part.
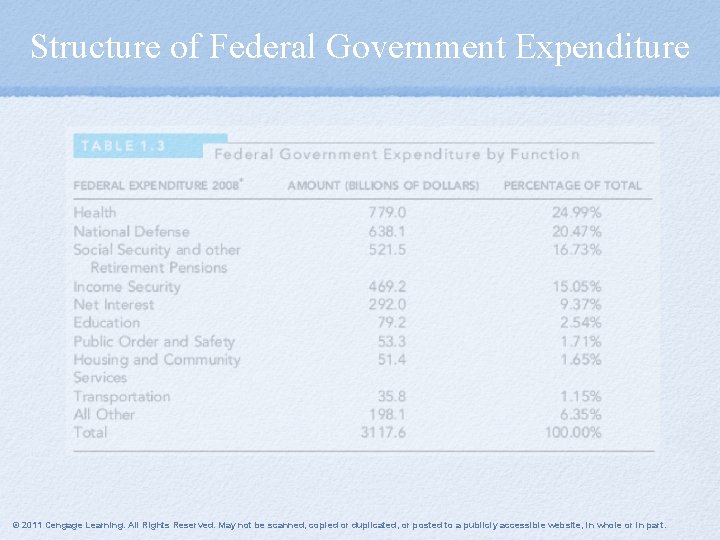
Structure of Federal Government Expenditure © 2011 Cengage Learning. All Rights Reserved. May not be scanned, copied or duplicated, or posted to a publicly accessible website, in whole or in part.
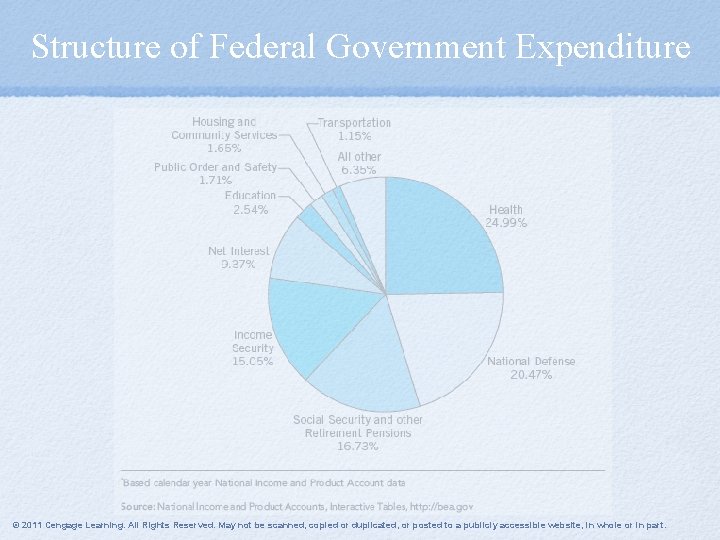
Structure of Federal Government Expenditure © 2011 Cengage Learning. All Rights Reserved. May not be scanned, copied or duplicated, or posted to a publicly accessible website, in whole or in part.
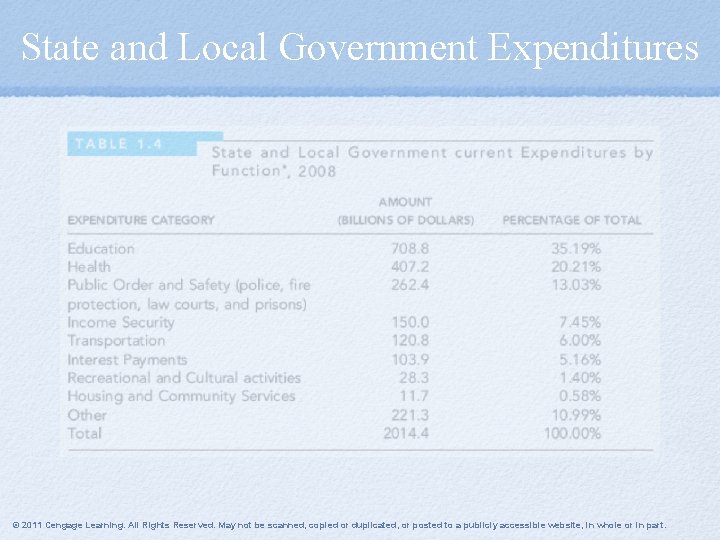
State and Local Government Expenditures © 2011 Cengage Learning. All Rights Reserved. May not be scanned, copied or duplicated, or posted to a publicly accessible website, in whole or in part.
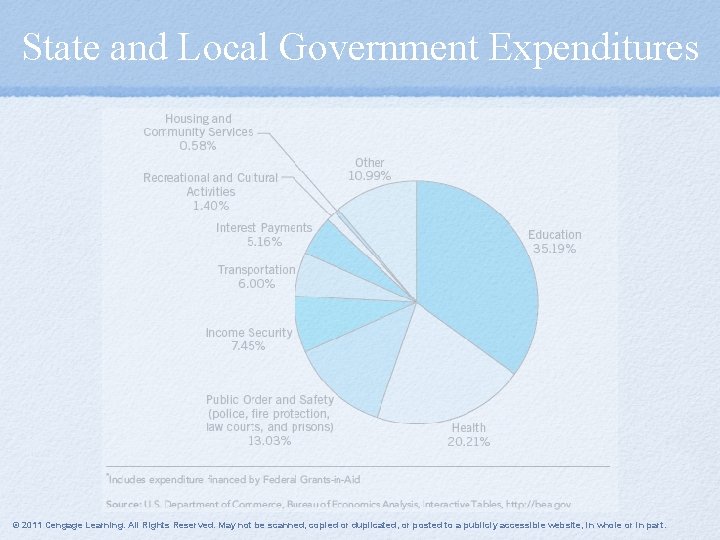
State and Local Government Expenditures © 2011 Cengage Learning. All Rights Reserved. May not be scanned, copied or duplicated, or posted to a publicly accessible website, in whole or in part.
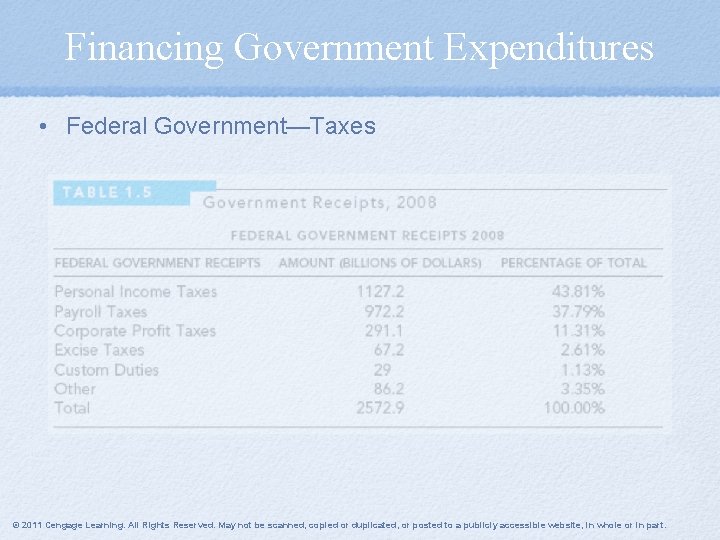
Financing Government Expenditures • Federal Government—Taxes © 2011 Cengage Learning. All Rights Reserved. May not be scanned, copied or duplicated, or posted to a publicly accessible website, in whole or in part.
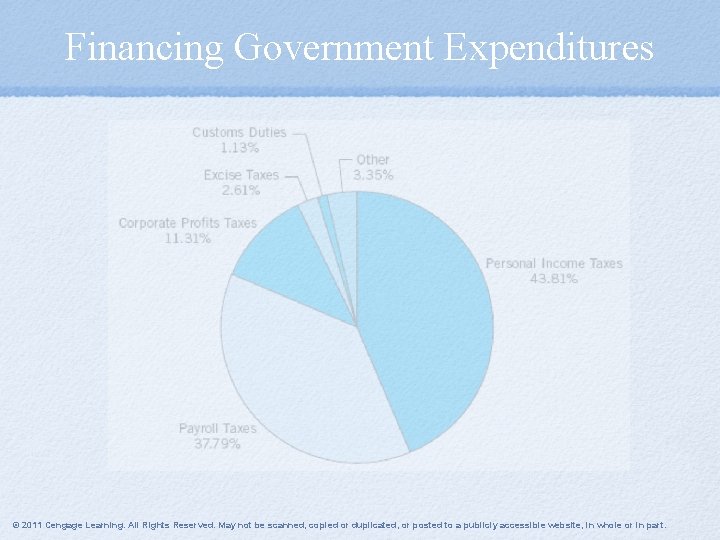
Financing Government Expenditures © 2011 Cengage Learning. All Rights Reserved. May not be scanned, copied or duplicated, or posted to a publicly accessible website, in whole or in part.
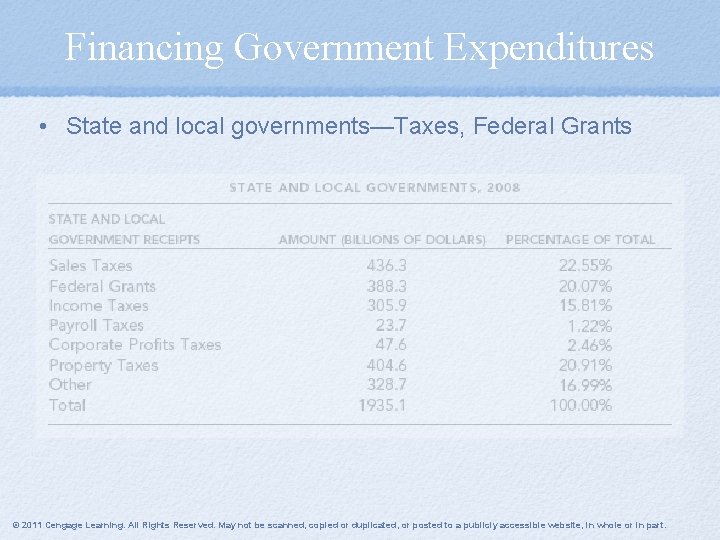
Financing Government Expenditures • State and local governments—Taxes, Federal Grants © 2011 Cengage Learning. All Rights Reserved. May not be scanned, copied or duplicated, or posted to a publicly accessible website, in whole or in part.
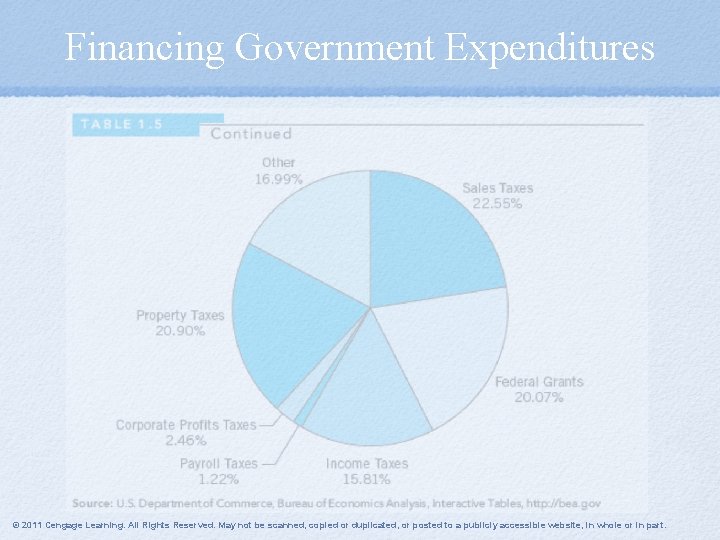
Financing Government Expenditures © 2011 Cengage Learning. All Rights Reserved. May not be scanned, copied or duplicated, or posted to a publicly accessible website, in whole or in part.
Functions of Government • Provide items we cannot easily make available for ourselves or purchase from others in markets - • Redistribute income and economic opportunity - • Income support for elderly, unemployed, poor Stabilize economic fluctuations - • Law enforcement and courts Inflation Regulate production and consumption - For improved health, elimination of excessive monopolistic control over prices © 2011 Cengage Learning. All Rights Reserved. May not be scanned, copied or duplicated, or posted to a publicly accessible website, in whole or in part.
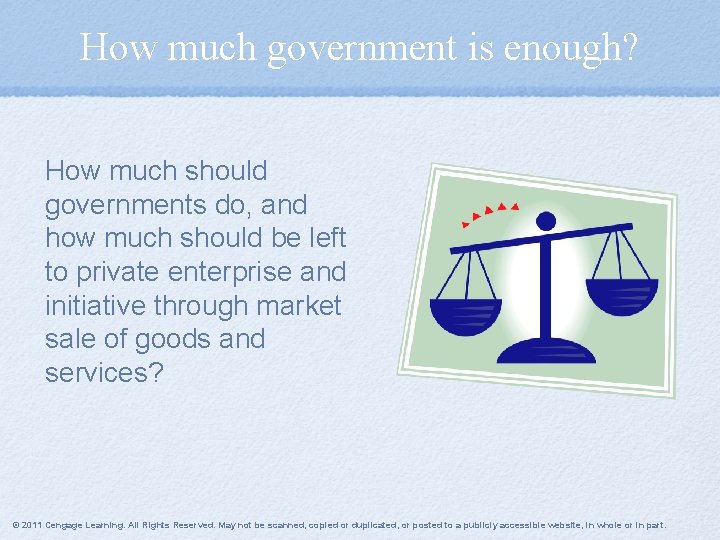
How much government is enough? How much should governments do, and how much should be left to private enterprise and initiative through market sale of goods and services? © 2011 Cengage Learning. All Rights Reserved. May not be scanned, copied or duplicated, or posted to a publicly accessible website, in whole or in part.
Aging Populations & Public Finance • Percentage of U. S. residents age 65 or older: 1950 – 8. 3%; 2000 – 12. 3%; 2050 – 21. 1% • Significant effects on Social Security and government-funded health care expenditures • Tax rates to finance programs must increase or benefits to recipients must decline to avoid causing large federal budget deficit © 2011 Cengage Learning. All Rights Reserved. May not be scanned, copied or duplicated, or posted to a publicly accessible website, in whole or in part.
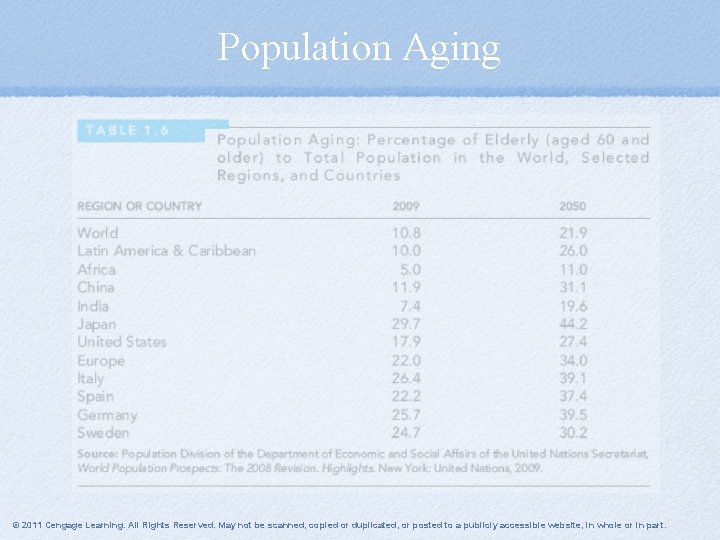
Population Aging © 2011 Cengage Learning. All Rights Reserved. May not be scanned, copied or duplicated, or posted to a publicly accessible website, in whole or in part.
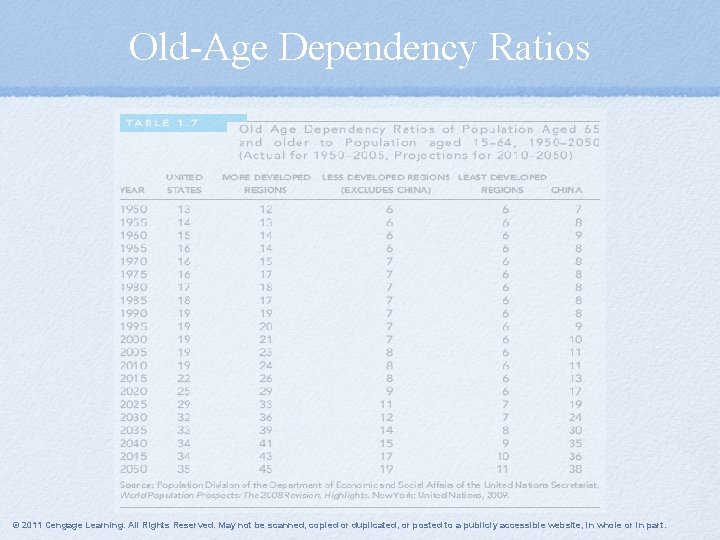
Old-Age Dependency Ratios © 2011 Cengage Learning. All Rights Reserved. May not be scanned, copied or duplicated, or posted to a publicly accessible website, in whole or in part.
Appendix I – Tools of Microeconomic Analysis Indifference Curve Analysis • Tool for understanding choices people make regarding purchase and use of goods and services • Understanding choices to give up leisure time to obtain income through work • Understanding choices to give up consumption today for more consumption in the future • Uses concept of the market basket – a combination of various goods and services available for consumption over a certain period © 2011 Cengage Learning. All Rights Reserved. May not be scanned, copied or duplicated, or posted to a publicly accessible website, in whole or in part.
Assumptions Underlying Indifference Curve Analysis 1. People can rank market baskets from most to least desired. 2. If basket A is preferred to basket B and basket B is preferred to basket C, then basket A must be preferred to basket C. 3. People always prefer more of a good to less of it, all other things being equal. 4. The amount of money people will give up to obtain additional units of a given good will decrease as more of the good is acquired. © 2011 Cengage Learning. All Rights Reserved. May not be scanned, copied or duplicated, or posted to a publicly accessible website, in whole or in part.
Indifference Curve Analysis • Indifference Curve – a graph of all combinations of market baskets among which a person is indifferent • Indifference Map – a way of describing a person’s preferences; shows a group of indifference curves © 2011 Cengage Learning. All Rights Reserved. May not be scanned, copied or duplicated, or posted to a publicly accessible website, in whole or in part.
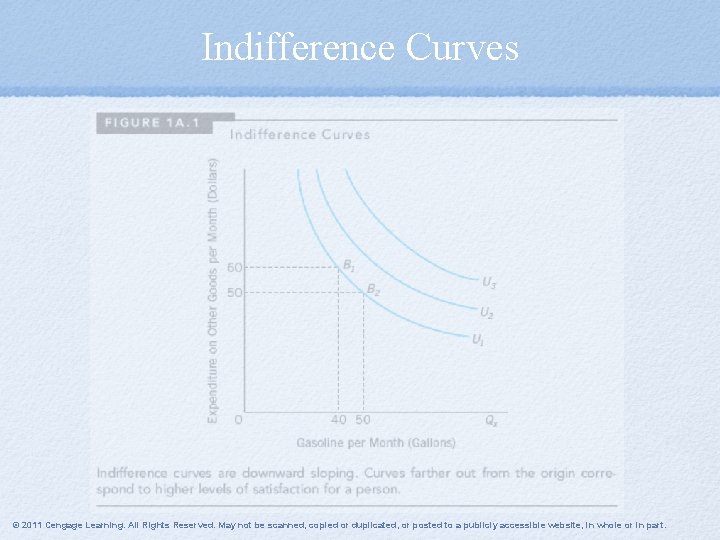
Indifference Curves © 2011 Cengage Learning. All Rights Reserved. May not be scanned, copied or duplicated, or posted to a publicly accessible website, in whole or in part.
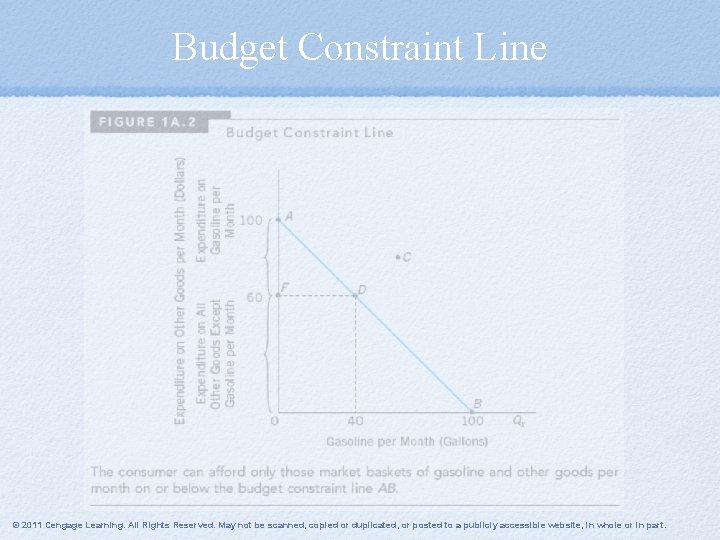
Budget Constraint Line © 2011 Cengage Learning. All Rights Reserved. May not be scanned, copied or duplicated, or posted to a publicly accessible website, in whole or in part.
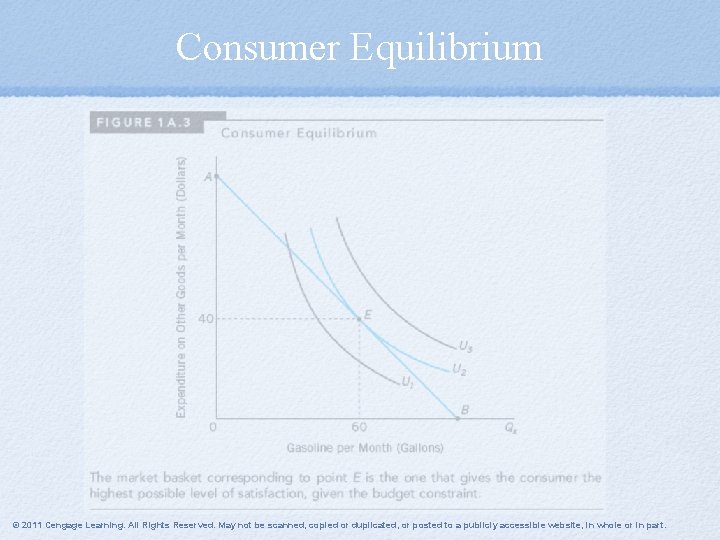
Consumer Equilibrium © 2011 Cengage Learning. All Rights Reserved. May not be scanned, copied or duplicated, or posted to a publicly accessible website, in whole or in part.
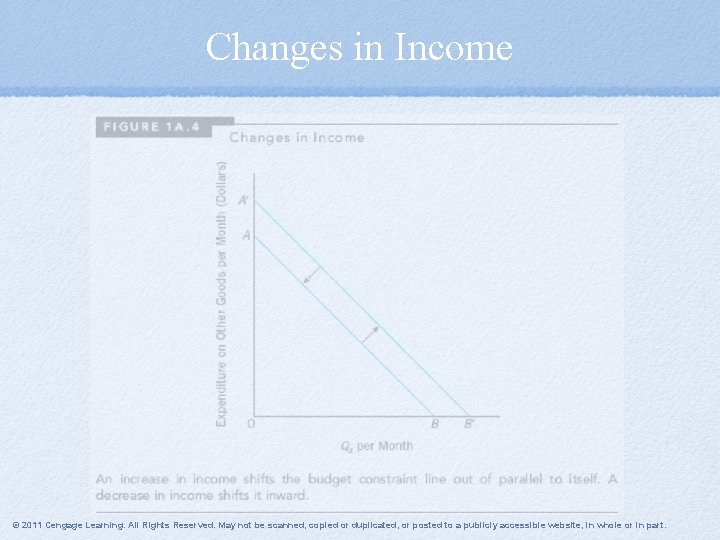
Changes in Income © 2011 Cengage Learning. All Rights Reserved. May not be scanned, copied or duplicated, or posted to a publicly accessible website, in whole or in part.
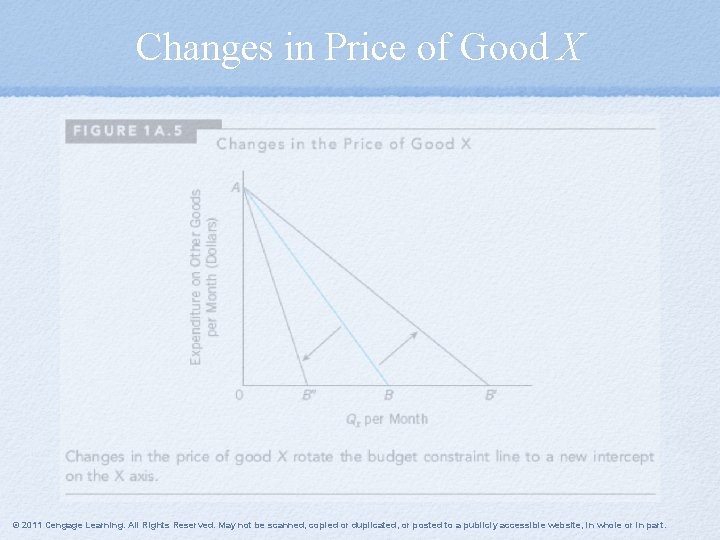
Changes in Price of Good X © 2011 Cengage Learning. All Rights Reserved. May not be scanned, copied or duplicated, or posted to a publicly accessible website, in whole or in part.
Income and Substitution Effects © 2011 Cengage Learning. All Rights Reserved. May not be scanned, copied or duplicated, or posted to a publicly accessible website, in whole or in part.
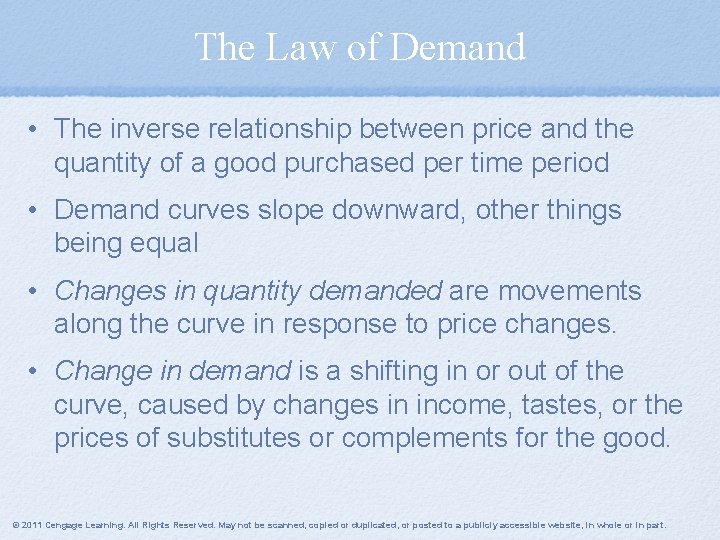
The Law of Demand • The inverse relationship between price and the quantity of a good purchased per time period • Demand curves slope downward, other things being equal • Changes in quantity demanded are movements along the curve in response to price changes. • Change in demand is a shifting in or out of the curve, caused by changes in income, tastes, or the prices of substitutes or complements for the good. © 2011 Cengage Learning. All Rights Reserved. May not be scanned, copied or duplicated, or posted to a publicly accessible website, in whole or in part.
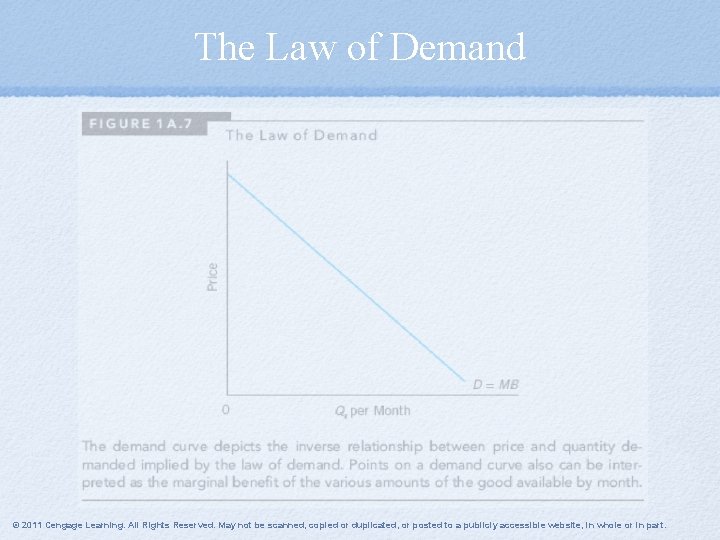
The Law of Demand © 2011 Cengage Learning. All Rights Reserved. May not be scanned, copied or duplicated, or posted to a publicly accessible website, in whole or in part.
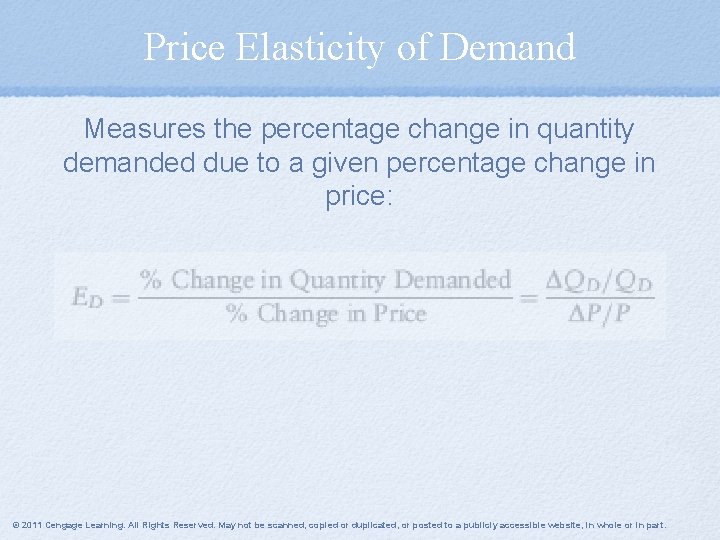
Price Elasticity of Demand Measures the percentage change in quantity demanded due to a given percentage change in price: © 2011 Cengage Learning. All Rights Reserved. May not be scanned, copied or duplicated, or posted to a publicly accessible website, in whole or in part.
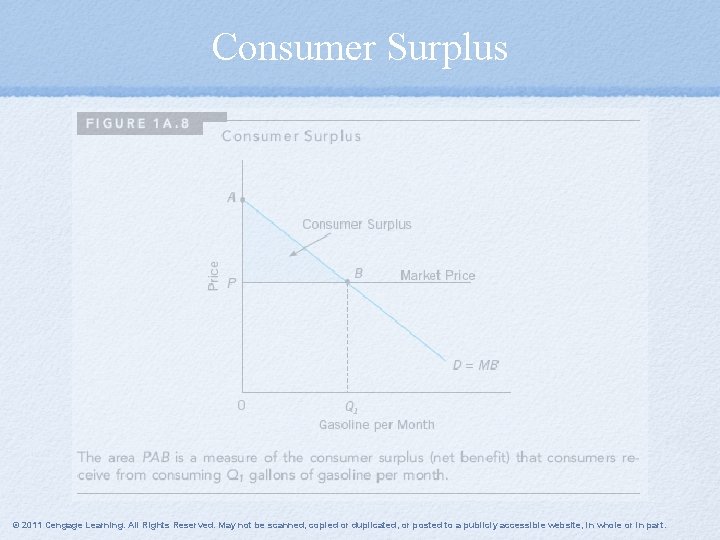
Consumer Surplus © 2011 Cengage Learning. All Rights Reserved. May not be scanned, copied or duplicated, or posted to a publicly accessible website, in whole or in part.
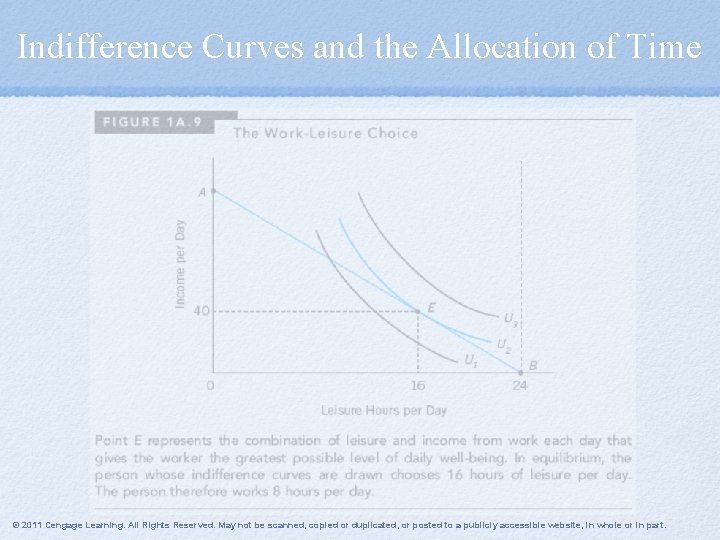
Indifference Curves and the Allocation of Time © 2011 Cengage Learning. All Rights Reserved. May not be scanned, copied or duplicated, or posted to a publicly accessible website, in whole or in part.

Production and Cost • Production function – the maximum output obtainable from any given combination of inputs (land, labor, materials, capital), given technology • Two periods to production: - Short run (inputs cannot be varied) - Long run (all inputs are variable) © 2011 Cengage Learning. All Rights Reserved. May not be scanned, copied or duplicated, or posted to a publicly accessible website, in whole or in part.

Isoquant Analysis Isoquants - curves that show alternative combinations of variable inputs that can be used to produce a given amount of output © 2011 Cengage Learning. All Rights Reserved. May not be scanned, copied or duplicated, or posted to a publicly accessible website, in whole or in part.
Costs • Total cost (TC) – the value of all inputs used to produce a given output • Variable cost (VC) – the cost of variable inputs such labor, machines, and materials • Fixed cost (FC) – cost of inputs that do not vary with output • Average cost (AC) – equal to total cost of production divided by the number of units produced • Average variable cost (AVC) – variable cost divided by the number of units produced • Average fixed cost (AFC) – difference between average cost and average variable cost © 2011 Cengage Learning. All Rights Reserved. May not be scanned, copied or duplicated, or posted to a publicly accessible website, in whole or in part.
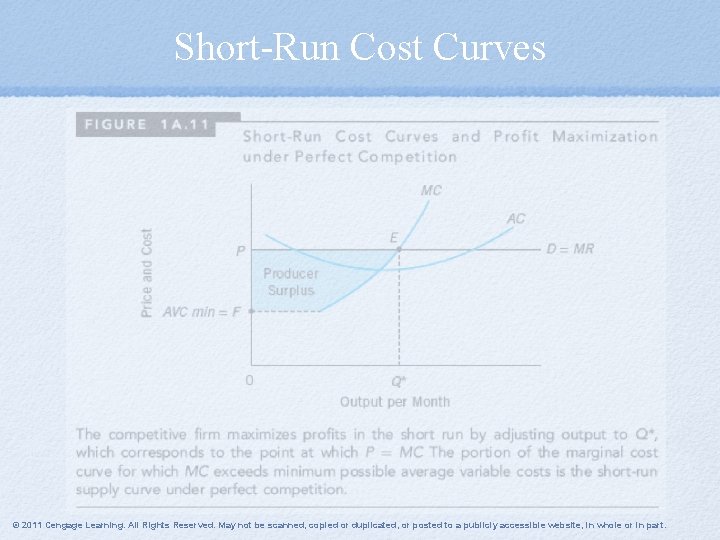
Short-Run Cost Curves © 2011 Cengage Learning. All Rights Reserved. May not be scanned, copied or duplicated, or posted to a publicly accessible website, in whole or in part.
Competition • Perfect competition exists when a firm is one of many producing a small market share of a standardized product with no difference in quality. • A competitive firm sells its output in a perfectly competitive market and is a price taker, because it takes the price of its product as given. • Profits are maximized by producing that output for which price is equal to marginal cost: P = MC © 2011 Cengage Learning. All Rights Reserved. May not be scanned, copied or duplicated, or posted to a publicly accessible website, in whole or in part.
Supply • Short-run supply curve – price exceeds minimum possible average variable costs of production • Long-run competitive equilibrium – economic profits are zero so that no incentive exists for firms to either enter or leave • Long-run industry supply curve – a relationship between price and quantity supplied for points at which the industry is in equilibrium: P = LRMC = LRACmin © 2011 Cengage Learning. All Rights Reserved. May not be scanned, copied or duplicated, or posted to a publicly accessible website, in whole or in part.
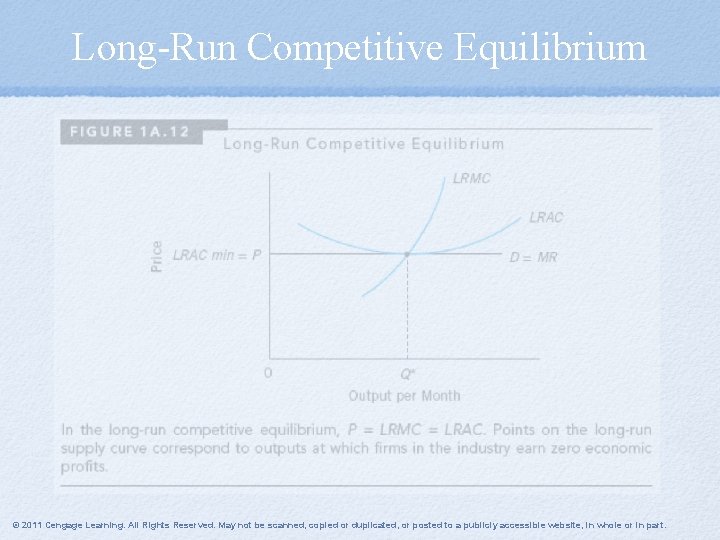
Long-Run Competitive Equilibrium © 2011 Cengage Learning. All Rights Reserved. May not be scanned, copied or duplicated, or posted to a publicly accessible website, in whole or in part.
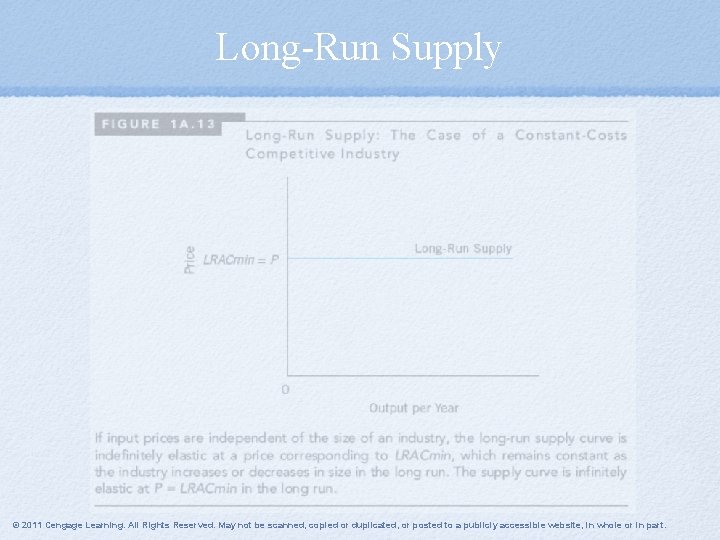
Long-Run Supply © 2011 Cengage Learning. All Rights Reserved. May not be scanned, copied or duplicated, or posted to a publicly accessible website, in whole or in part.
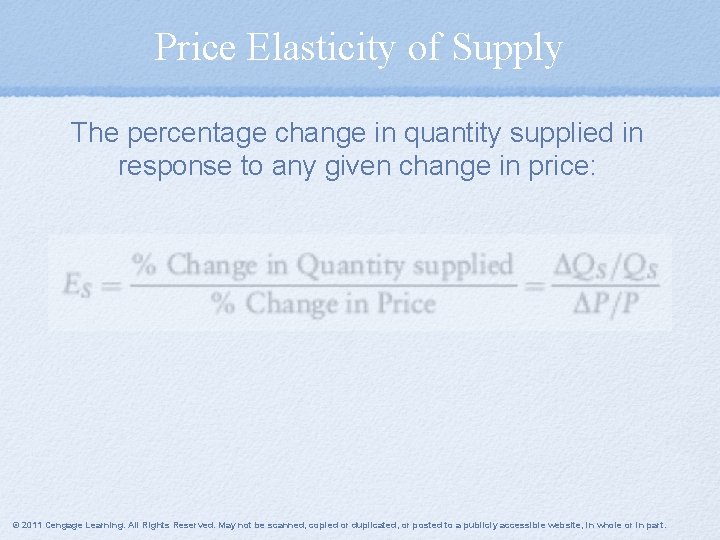
Price Elasticity of Supply The percentage change in quantity supplied in response to any given change in price: © 2011 Cengage Learning. All Rights Reserved. May not be scanned, copied or duplicated, or posted to a publicly accessible website, in whole or in part.
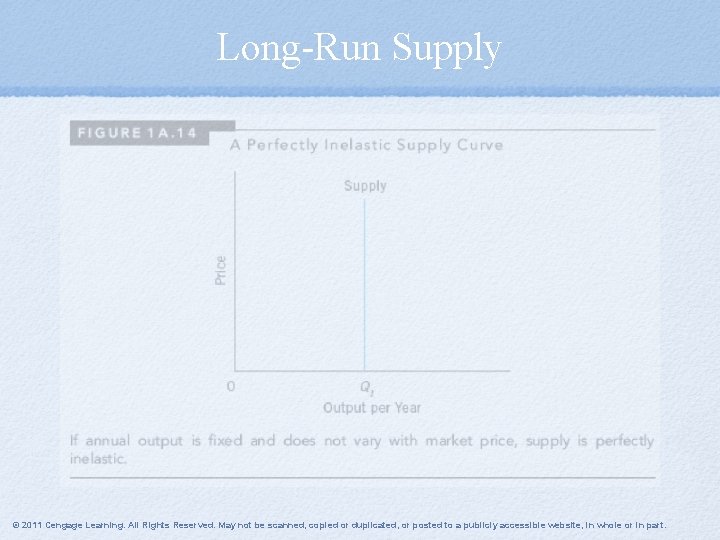
Long-Run Supply © 2011 Cengage Learning. All Rights Reserved. May not be scanned, copied or duplicated, or posted to a publicly accessible website, in whole or in part.
- Slides: 50