PTT 356 DISTILLATION Part 1 BY DR ADILAH
 BY DR. ADILAH ANUAR")
PTT 356 DISTILLATION (Part 1) BY DR. ADILAH ANUAR

Course outcomes 1. 2. 3. 4. 5. Explain the basic theory and principle of distillation. Distinguish different type of tray used in distillation column. Examine the vapor-liquid equilibrium data in batch and/or continuous distillation of binary mixtures as well as the overall mass balance and overall heat balance across a tray and distillation column. Develop the distillation column based on calculation of the number of plates, minimum number of plate and minimum reflux ratio of the different conditions of feeds and the use of qline. Determine the tray efficiency and overall column efficiency.

Introduction �Distillation separates chemicals by the difference in how easily they vaporize. �The two major types of classical distillation include continuous distillation and batch distillation. �Continuous distillation, as the name says, continuously takes a feed and separates it into two or more products. �Batch distillation takes on lot (or batch) at a time of feed and splits it into products by selectively removing the more volatile fractions over time.

�Many industries use distillation for critical separations in making useful products. �These industries include petroleum refining, beverages, chemical processing, petrochemicals, and natural gas processing

Distillation Categories � System composition

� Multicomponent distillation - Multicomponent distillation is the separation of a mixture of chemicals. - A good example is petroleum refining. - Crude oil is a very complex mixture of hydrocarbons with literally thousands of different molecules. -Nearly all commercial distillation is multicomponent distillation. -The theory and practice of multicomponent distillation can be very complex.
 -Distillation equipment includes two major categories, trays and packing. -Trays")
Equipment Type (multicomponent system) -Distillation equipment includes two major categories, trays and packing. -Trays force a rising vapor to Bubble through a pool of descending liquid. -Packing creates a surface for liquid to spread on. -The thin liquid film has a high Surface area for mass-transfer Between the liquid and vapor.
 NO REFLUX/FLASH DISTILLATION/EQUI LIBRIUM/BINARY • Production of vapour by boiling the")
DISTILLATION (2 PRINCIPLES) NO REFLUX/FLASH DISTILLATION/EQUI LIBRIUM/BINARY • Production of vapour by boiling the liquid mixture to be separated and condensing the vapour without allowing any liquid to return the still. • Continuous steady state distillation process includes single -stage partial vapourization DISTILLATION WITH REFLUX/RECTIFIC ATION/FRACTION AL DISTILLATION/ MULTICOMPONEN T • The returning of a portion of the condensate to the still. • The vapour rise through a series of stage or trays and part of condensate flows downward through the series of stage or trays.

Raoult’s Law � Raoult’s Law can be defined for vapour-liquid in equilibrium: � Where : p. A is the partial pressure of component A in the vapour (Pa) or (atm) PA is the vapour pressure of pure A in (Pa) or (atm) x. A is the mole fraction of A in the liquid. � This law holds only for ideal solution e. g: benzene –toluene; hexane-heptane and methyl alcohol-ethyl alcohol

Boiling point diagram and xy plot � The vapour liquid equilibrium relations for a binary mixture of A and B are given as a boiling-point diagram shown in Figure 11. 1 -1 � This diagram is for system benzene (a)–toluene (B) at total pressure of 101. 32 k. Pa. � The upper line is the saturated vapor line (the dew point line) � The lower line is the saturated liquid line (the bubble point line). � The two-phase region is in the region between these two lines.

� In Fig 11. 1 -1, if we start with a cold mixture of x. A 1 = 0. 318 and heat the mixture, it will start to boil at 98 o. C. � The composition of the first vapour in equilibrium is y. A 1 = 0. 532. � As we continue boiling, the composition x. A will move to the left since y. A is richer in A.

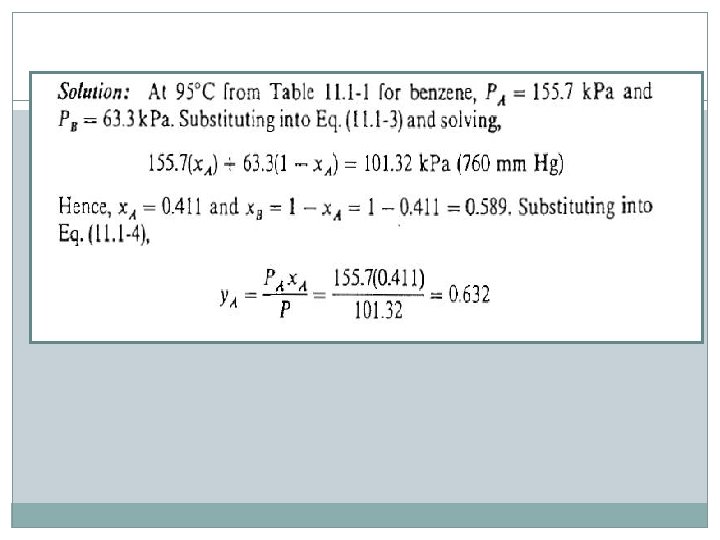
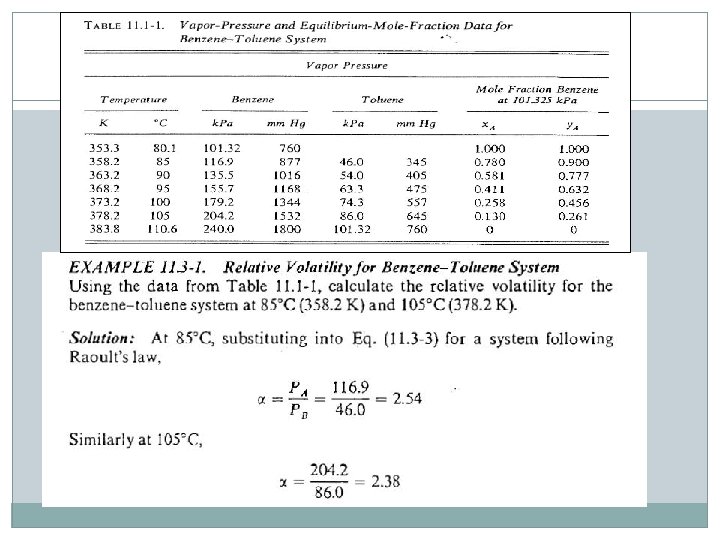
� The system benzene-toluene follows Raoult’s law, so the boiling –point diagram can be calculated from the pure vapour-pressure data in Table 11. 1 -1 and the following equations.

Example

� A common method of plotting the equilibrium data is shown in Figure 11. 1 -2 where y. A is plotted versus x. A for the benzene -toluene system. � The 45 o line is given to show that y. A is richer in component A than is x. A.

Vapour-Liquid Equilibrium � The composition of the vapour in equilibrium with a liquid of given composition is determined experimentally using an equilibrium still. � The results are conveniently shown on a temperature – composition diagram as shown in Figure 11. 3

� Figure 11. 3 a, the curve ABC shows the composition of the liquid which boils at any given temperature, and the curve ADC the corresponding composition of the vapour at that temperature. � Thus, a liquid of composition x 1 will boil at temperature T 1, and the vapour in equilibrium is indicated by point D of composition y 1. � It is seen that for any liquid composition x the vapour formed will be richer in the more volatile component, where x is the mole fraction of the more volatile component in the liquid, and y in the vapour.

� Figures 11. 3 b and c, there is a critical composition xg where the vapour has the same composition as the liquid, so that no change occurs on boiling. � Such critical mixtures are called azeotropes.

Relative volatility of vapour and liquid system � In Fig. 11. 1 -2 for the equilibrium for binary mixture of A and B. � The greater the distance between the equilibrium line and the 45 o line, the greater the difference between the vapour composition y. A and liquid compositions x. A. � Therefore, the separation is more easily made. � A numerical measure of this separation is the relative volatility (αAB).

� This is defined as the ratio of the concentration of A in the vapour over the concentration of A in the liquid divided by the ratio of the concentration of B in the vapour over the concentration of B in liquid. � Where αAB is the relative volatility of A with respect to B in the binary system. � If the system obeys Raoult’s law, such as the benzene-toluene system, � For an ideal system, Eq (11. 2 -3) in (11. 3. 1)

THANK YOU
- Slides: 22