PTT 205 HEAT AND MASS TRANSFER DRYING PROCESS


")
 Line")


 of 60")


 is calculated for")
")


 the drying rate starts to decrease in")

 A solid whose drying curve is represented by Fig.")


 A solid whose drying curve is represented")
- Slides: 46
PTT 205 HEAT AND MASS TRANSFER DRYING PROCESS By Mrs. Noor Amirah Abdul Halim
TITLE OUTLINE Introduction Application of drying General drying methods Types of dryer Vapor pressure of water Humidity and humidity chart Rate of drying curves Calculation methods for constant rate drying period
INTRODUCTION Drying is refer to the removal of small amount of water or organic liquids (e. g. organic solvent) from solids (process materials). Dryer is a unit operation which liquid is separated from the solid by other than mechanical means. This generally requires supplying heat, resulting in evaporation of liquid
The differences between drying and evaporation process DRYING PROCESS EVAPORATION PROCESS Normally carried out on solid material Normally carried out on liquid solution Remove relatively small of water Remove large amount of water In most cases, involves the removal of water at the temperature below its boiling point
APPLICATION OF DRYING To eliminate moisture which may lead to corrosion and decrease the product stability To improve or keep the good properties of material (e. g. flowability, compressibility) To reduce the course of transportation of large volume materials (liquid) To preserve the material (e. g. food products. ) To make the material easy or suitable for handling As a final step in evaporation, filtration and crystallization process.
GENERAL DRYING METHODS Types of drying processes: Batch – the material is insert into the drying equipment and drying is proceeds for a given period of time. Continuous – the material is continuously added to the dryer and dried material is continuously removed. Types of drying physical conditions: Heat is added directly to the air at atmospheric pressure and water vapor formed is remove by the air. Vacuum drying- Heat is added indirectly by contact with a metal wall or by radiation and the water evaporated more rapid at low pressure. Freeze drying- Water is sublimed from the frozen material
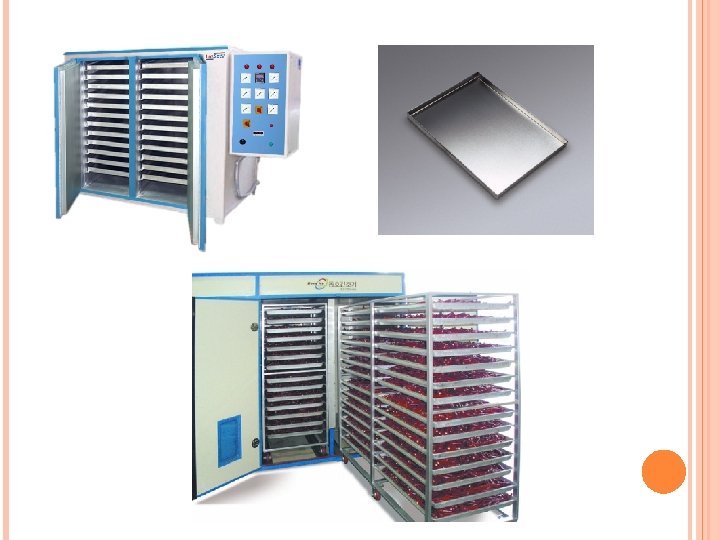
TYPES OF DRYER Tray / shelf dryer Suitable for lumpy or pasty solid The solid to be dried is spread uniformly on a metal trays which can be loaded into the shelf or using the tray truck Steam-heated air is recirculated by a fan over and parallel to the surface of the trays Yielding shorter drying times because of the greater surface area exposed to the air
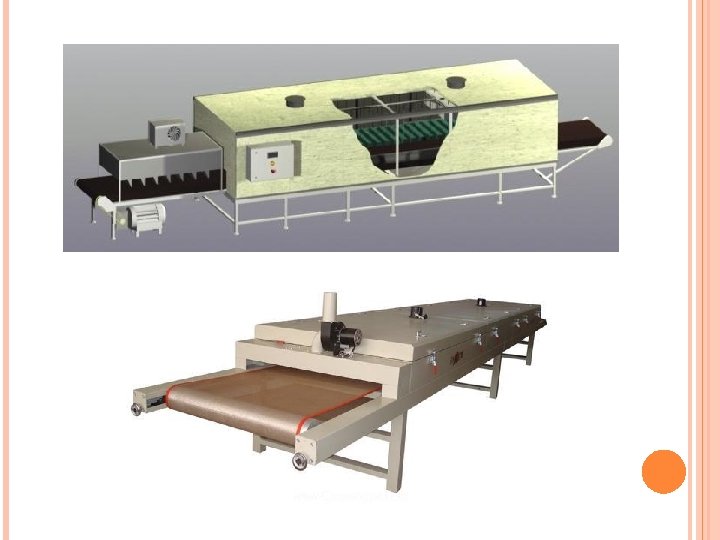
Tunnel dryer Suitable for granular particle, mostly foods. A modified form of tray dryer which consisted of tray compartment operated in series (forming a tunnel). The solid to be dried are placed on trays/truck which move continuously through a tunnel by multiple belt conveyer with hot gases passing over the surface of each tray.
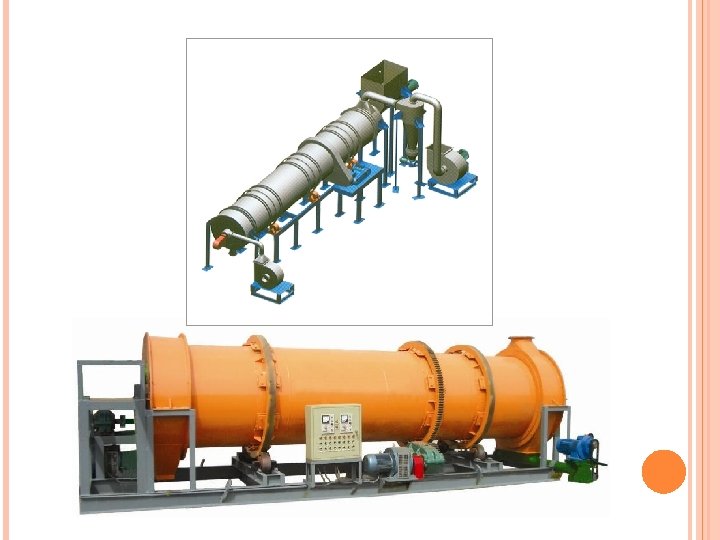
Rotary dryer Suitable for granular solids Consist of a hollow cylinder which is rotated and usually slightly inclined toward the outlet. The wet solid are fed at the high end and move through the shells as it rotates The heating occurs by direct contact with hot gases in countercurrent flow. In some cases, the heating is done by indirect contact through the heating wall of the cylinder
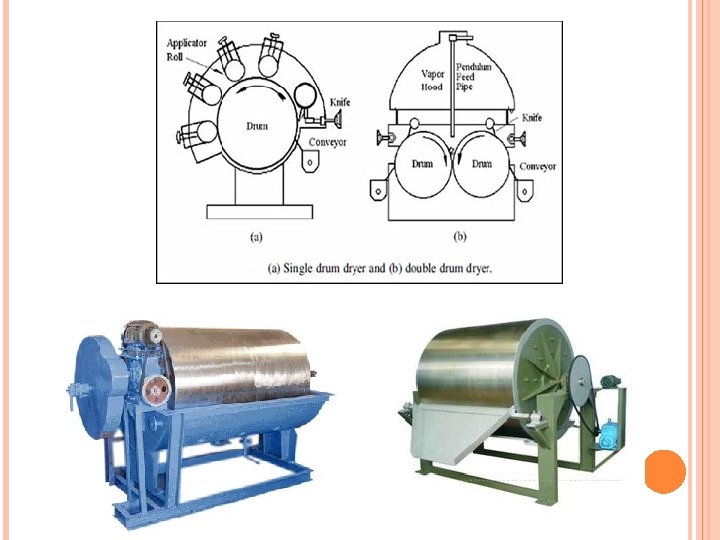
Drum dryer Suitable for handling slurries or pastes of solids in fine suspensions and solutions. Consisted of a heated metal roll on the outside of which a thin layer (film) of slurry is evaporated to dryness. The final dry solid is scraped off the roll by knife scraper. The drum functions partly as an evaporator as well as a dryer
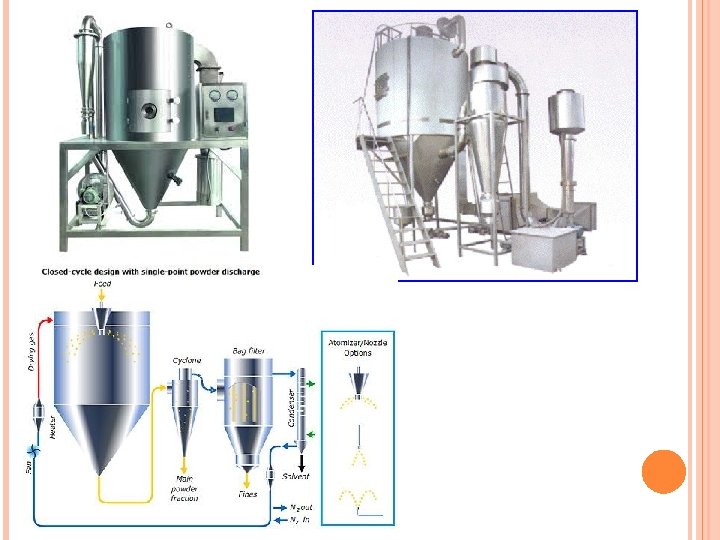
Spray dryer Suitable for liquid or slurry solutions Slurry is sprayed into a hot gas stream in the form of a mist of fine droplets The water is rapidly vaporized from the droplets, leaving the particle of dry solid which are separated from the gas stream The dried solids leave at the bottom of the chamber through a screw conveyer The exhaust gas flow through a cyclone separator to remove any fines.
VAPOR PRESSURE OF WATER Pure water can exist in three different physical states (phase) which are, solid ice, liquid and vapor depends on the pressure and temperature.
Based on figure: Line AB – liquid and vapor coexist (vapor pressure line) Line AC – solid ice and liquid coexist Line AD – solid ice and vapor coexist From point (1) to (2) If solid ice at point (1) is heated at constant pressure, the temperature rises The solid melts at line AC and vaporizes at line AB and become vapor at point (2) From point (3) to (4) A this pressure with an increasing in temperature, solid ice at point (3) sublimes (vaporizes) to a vapor (point 4) without becoming a liquid. Liquid and vapor is in equilibrium along line AB which is the vapor pressure line for water. Boling occurs when the vapor pressure of water is equal to the total pressure above the water surface.
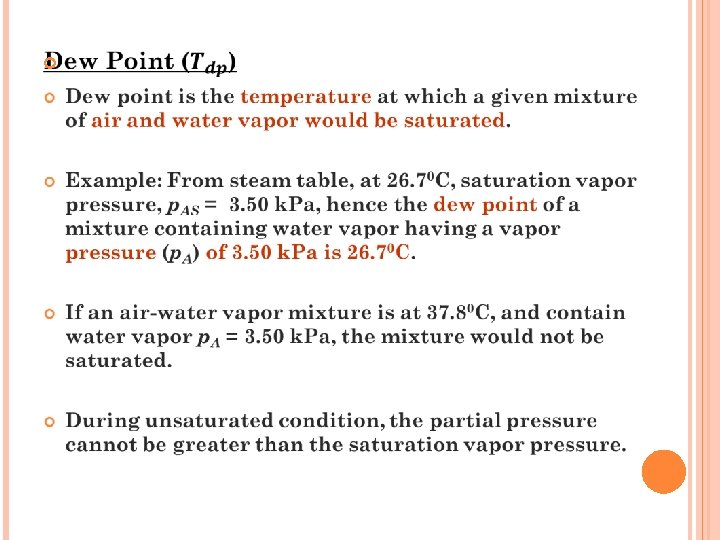
HUMIDITY AND HUMIDITY CHART Humidification Involves the transfer of water from the liquid state to a vapor state to form a mixture of air and water vapor. Dehumidification Involves the reverse transfer where water vapor is transferred from the vapor state to the liquid state
EXERCISE 1
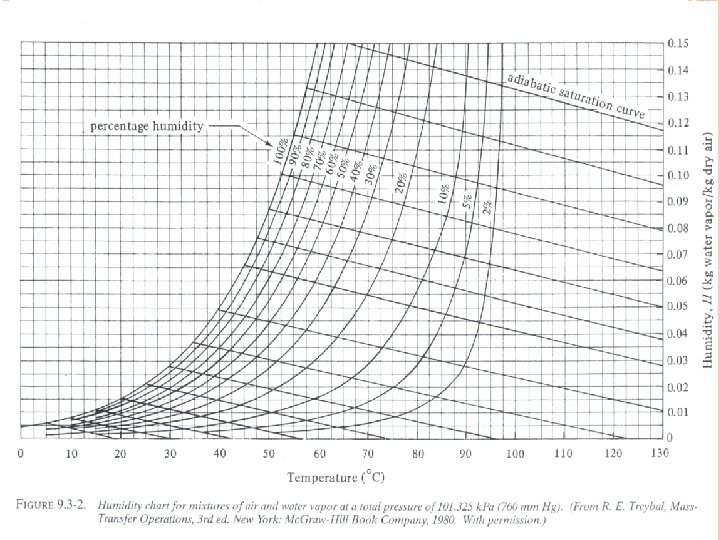
Humidity chart - A convenient chart of the properties of airwater vapor mixtures at 1. 0 atm abs pressure. In this figure the humidity H is plotted versus the actual temperature of the air-water vapor mixture (dry bulb temperature). The curve marked 100% running upward to the right gives the saturation humidity H as a function of temperature. In exercise 1 for 26. 7°C, HS was calculated as 0. 0223 kg H 20/kg air. Plotting this point for 26. 7°C and HS = 0. 0223 on the chart it falls on the 100% saturated line. Any point below the saturation line represents unsaturated airwater vapor mixtures.
The curved lines below the 100% saturation line and running upward to the right represent unsaturated mixtures of definite percentage humidity HP. All the percentage humidity lines HP mentioned and the saturation humidity line HS can be calculated from the data for vapor pressure of water.
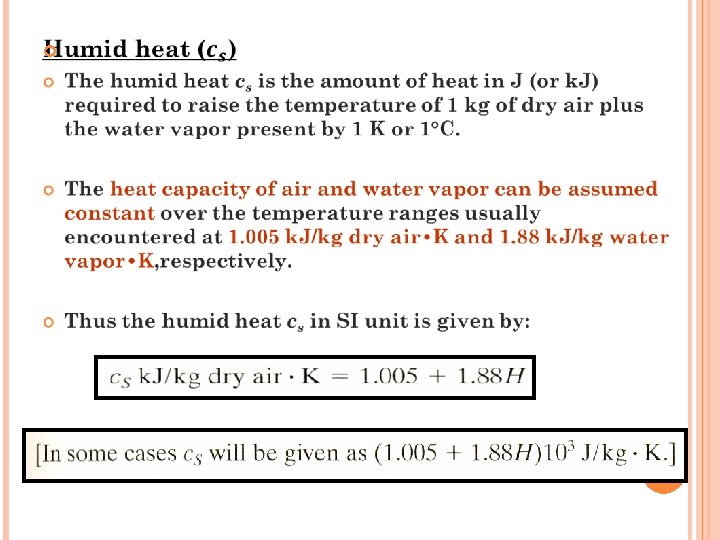
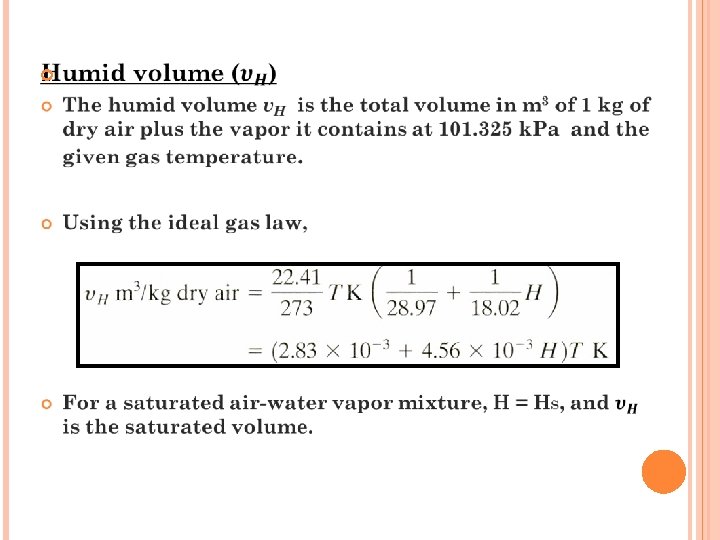
EXERCISE 2 Air entering a dryer has a temperature (dry bulb temperature) of 60 0 C and a dew point of 26. 7 0 C. Using the humidity chart, determine ; (a) the actual humidity H, (b) percentage humidity Hp, (c) humid heat c. S, (d) humid volume v. H Ans: (a) 0. 0225 kg water/kg dry air (b) 14% (c) 1. 047 k. J/ kg dry air. K (d) 0. 977 m 3/kg DA
RATE OF DRYING CURVES In the drying of various types of process materials from one moisture content to another it is usually desired to estimate the size of dryer, the operating conditions, and the time needed to perform the amount of drying required. Equilibrium moisture content of various materials cannot be predicted and must be determine experimentally. Thus, it is necessary in most cases to obtain some experimental measurement of drying rates. To experimentally determine the rate of drying for a given material, a sample is usually placed on a tray where the top surface is exposed to the drying air stream. The loss in weight of moisture during drying can be determine at different intervals without interrupting the operation.
Rate of drying curve for constant drying conditions The velocity, humidity, temperature and direction of the air should be the same and constant to simulate drying under constant drying conditions. Data obtained from a batch-drying experiment are usually obtained as total weight of the wet solid at different times ( t hours) in the drying period. These data can be converted to rate-of-drying data in the following ways. First, the data are recalculated. Xt = Total moisture content W = weight (kg) of the wet solid (dry solid+moisture) Ws = weight (kg) of the dry solid
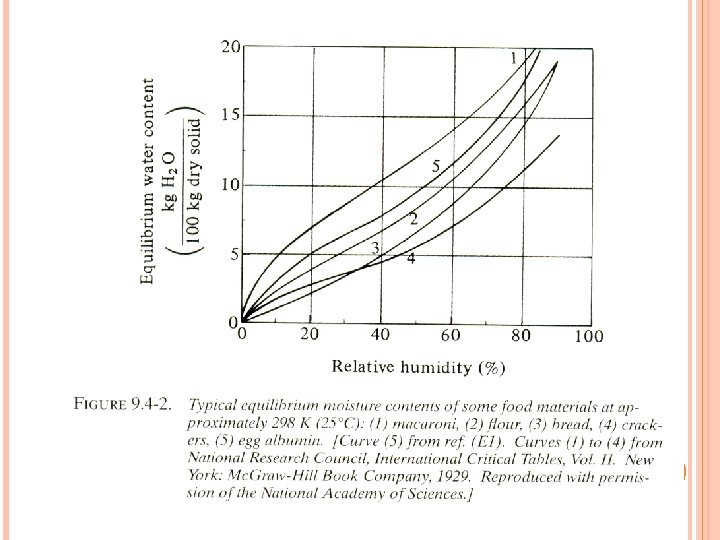
The free moisture content, X (kg free water/kg dry solid) is calculated for each value of Xt: X * = the equilibrium moisture content kg equilibrium moisture/kg dry solid (can be determined for the given constant drying condition). Any material will keep dry until it reaches its equilibrium value A plot of free moisture content, (X) versus time (t) in hour is made as in Fig. 1
EQUILIBRIUM MOISTURE CONTENT OF MATERIAL (X*)
Fig. 1 Drying curve for constant drying plot data as free moisture versus time
To obtain the rate-of-drying curve from this plot, the slopes of the tangents drawn to the curve in Fig. l(a) can be measured, which give values of d. X/dt at given values of t. The drying rate, R is calculated for each point by where; R = drying rate in kg H 2 O/h. m 2 LS = kg of dry solid used A = exposed surface area in m 2 The value of R in Fig. 2 is obtained by taking a value of (Ls/A ) equal to 21. 5 kg/m 2 The drying rate curve is then obtained by plotting R versus the free moisture content, X as in Fig. 2.
Fig. 2 Rate of drying curve as rate , R versus free moisture content, X
Rate of Drying Curve At point A At zero time: the initial free moisture content. In the beginning the solid is usually at a colder temperature and the evaporation rate will increase once exposed to the heated air. At point B The surface temperature rises to its equilibrium value. Alternatively, if the solid is quite hot to start with, the rate may start at point A’. From point B to point C (constant rate of drying period) The line is straight, The slope and rate are constant during this period. The surface of the solid is initially very wet and a continuous film of water exist on the drying surface.
At point C (falling rate of drying) the drying rate starts to decrease in the falling-rate period until it reaches point D. In this first falling-rate period, the rate shown as line CD in Fig. 2 is often linear. At point C in Fig. 2 is at the critical free moisture content XC the entire surface is no longer wetted. The wetted area continually decreases in this first falling-rate period until the surface is completely dry at point D. At point D the rate of drying falls even more rapidly, until it reaches point E, the equilibrium moisture content is X* and X = X* - X* = 0.
CALCULATION METHOD FOR CONSTANT-RATE DRYING PERIOD The important factor in drying calculations is the length of time required to dry the material from a given initial free moisture content X 1 to a final moisture content X 2. Method: Experimental Drying Curve - using drying curve - using rate of drying curve for constant rate period
EXERCISE 3 (USING DRYING CURVE) A solid whose drying curve is represented by Fig. 1 is to be dried from a free moisture content X 1 = 0. 38 kg H 2 O/kg dry solid to X 2 = 0. 25 kg H 2 O/kg dry solid. Estimate the time required. Ans: 1. 8 hour
METHOD USING RATE OF DRYING CURVE FOR CONSTANT RATE PERIOD The drying rate is defined as: The equation can be rearranged and integrated over the time interval fro drying from X 1 at t 1 = 0 to X 2 at t 2 = t: Integrating the equation above for the rate constant period (where R = Rc = constant)
THANK YOU
EXERCISE 4 (USING RATE OF DRYING CURVE) A solid whose drying curve is represented by Fig. 1 is to be dried from a free moisture content X 1 = 0. 38 kg H 20/kg dry solid to X 2 = 0. 25 kg H 2 O/kg dry solid. Estimate the time required using the rate of drying curve in Fig. 2 Ans: 1. 85 hour