Psyc 301 SPSS Lab Session Spring 2014 Data

Psyc. 301 SPSS Lab Session Spring 2014 Data screening & Transformation

Recode – To recode negatively worded items – To collapse continuous variables into categorical ones • • Recode into same variable Recode into different variable • Recoding negatively worded scale items – Transform ─ Recode into SAME variables (to overwrite original data) – Select variables and move it to Variables box ( k 1, k 6, k 7, k 8, k 10, k 13, k 15, and k 16 in week 3 dataset. sav data) – Click on Old and New Values – Type old value in old value box new value in new value box and click Add – Repeat the last step for the remaining values to be changed – Click on Continue and Ok

• To collapse a continuous variable – Transform ─ Recode into different variables (to retain original data) – Select variable and move it to Numeric Variable-Output Variable box – Type a new name in name box and a new label in label box, and click on change – Click on Old and New Values – Click on second Range and type the median in the box – Type new value in new value box and click Add – Click on third Range, type the median plus 1 in the box – Type new value in new value box and click Add – Click on Continue and Ok

Compute • Usually to obtain composite scores of items Example: kssc scale items. sav • Compute if … ( «compute if certain condition is met» )
 – – – Transform ─")
• COMPUTE (example of calculating a total score) – – – Transform ─ Compute variable Type a name in Target Variable box Select variables and move to Numeric expression box, click on + Select other variables and repeat the same step by clicking on + click on Ok • New composite variable is added to the data • COMPUTE IF… Transform ─ Compute variable Type a name in Target Variable box Select variables and move to Numeric expression box, click on + Select other variables and repeat the same step by clicking on + Click on If, select Include if case satisfies condition, Select the relevant variable and move it to the box, select the required operator button – click on Continue and Ok – – –

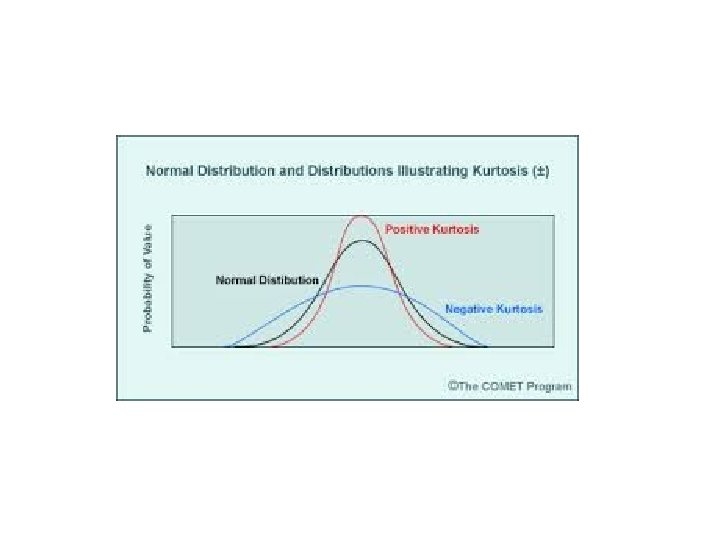
Descriptive statistics • • • Mean Mode Median Standard deviation Normality measures: skewness kurtosis Normal distribution Negatively skewed distribution Positively skewed distribution Histogram

Data distribution

Select cases • If you want to analyze only a part of the dataset which mets a certain condition • • • Selection of specified cases using the If option Selection of a random sample of cases using the Sample option Selection of cases based on time or case range using the Range option • Example: Select the first 5 cases for the analysis: – – – Data ─ Select cases ─ If condition is satisfied ─ If Select the relevant variable and move it to the box Click on the relevant operator to add it into the box Type if any other values are required (example: id<=5) Click on Continue and Ok • The cases after 5 are crossed in the data, analysis can be conducted by using only the first 5 cases • • Example 2: Selecting female cases Example 3: Selecting those having depression scores above 16.
- Slides: 9