
PSSDIAG Tool Read 80 Trace Tool SQL Server







- Slides: 57
대상 기술범위 • • PSSDIAG Tool Read 80 Trace Tool SQL Server Performance Troubleshooting Methodology Locking Internals
목차 • PSSDiag • SQL Server Performance Troubleshooting • SQL Server Locking Internals and Troubleshooting
PSSDiag
What is PSSDiag? • Wrapper around data collection APIs commonly used in PSS, particularly SQL Server Support (Profiler, blocking script, Perfmon/Sysmon, SQLDIAG, event logs, etc) • Designed to provide double-click simplicity and reduce user error • Get all the needed data the first time, collected at the same time • See KB 830232 for information and download location
Components • GUI configuration utility (PSSDiag. Config. EXE) – Configure types of data to collect – Save configuration in XML document – Can also manage the collector service • Collector (PSSDiag. EXE) – Collector app, consumes configuration file created by GUI – Can run as a service or a console app
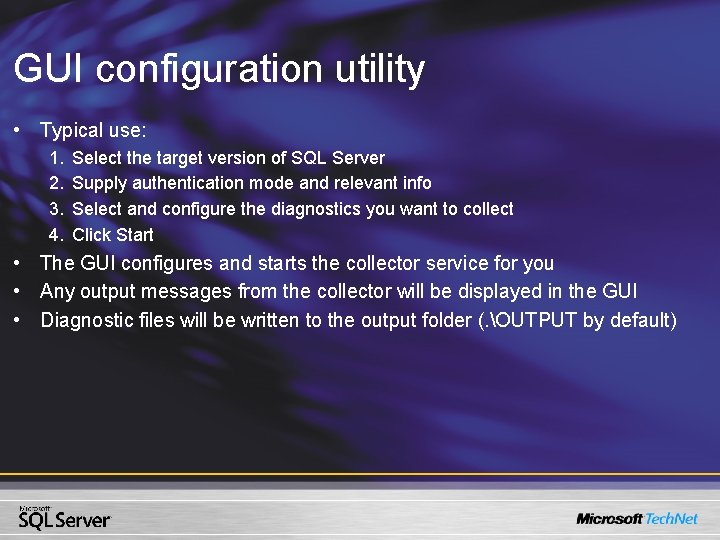
GUI configuration utility • Typical use: 1. 2. 3. 4. Select the target version of SQL Server Supply authentication mode and relevant info Select and configure the diagnostics you want to collect Click Start • The GUI configures and starts the collector service for you • Any output messages from the collector will be displayed in the GUI • Diagnostic files will be written to the output folder (. OUTPUT by default)
Collector (PSSDiag. EXE) • Can run as a console app or as a service (GUI always runs it as a service) • Can compress files using NTFS or ZIP compression via /Cn parameter • Logging out while running as a console will stop data collection • Works fine from Terminal Services session • Set the output folder via /O parameter • To uninstall, run PSSDiag /U to uninstall the service (if you’ve installed it), then delete the files extracted from the archive
Collector (PSSDiag. EXE) • Optional command line params: – /Cn – (/C 1 for NTFS background compression, /C 2 for ZIP compression at shutdown) – /Nn – erase, overwrite, or rename output folder – /B YYYYMMDD_HH: MM: SS – Start time – /E YYYYMMDD_HH: MM: SS – Automatic shutdown time – /G – Generic mode. Disables SQL Server-centric mode to permit collection on machines without SQL Server installed – /R – register as a service – /U – deregister service
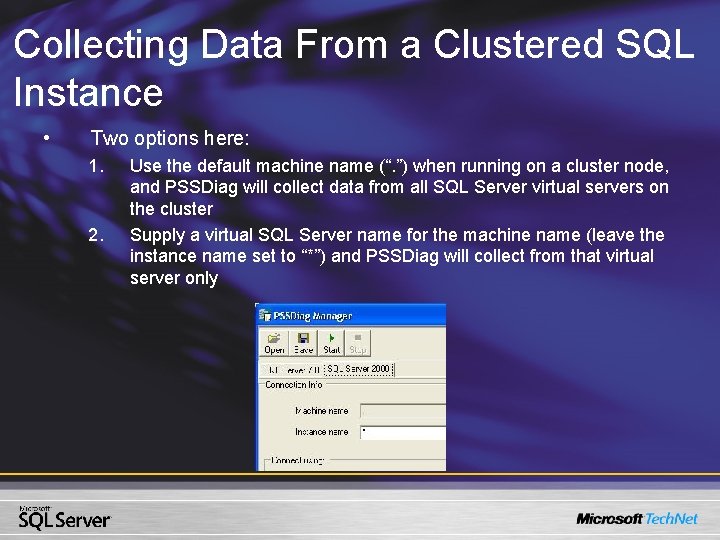
Collecting Data From a Clustered SQL Instance • Two options here: 1. 2. Use the default machine name (“. ”) when running on a cluster node, and PSSDiag will collect data from all SQL Server virtual servers on the cluster Supply a virtual SQL Server name for the machine name (leave the instance name set to “*”) and PSSDiag will collect from that virtual server only
Collecting Data from a Remote Server • • • Supply the machine name when starting the GUI Configuration is disabled when connecting to a remote machine Output files will be written to remote machine Output path must exist or be creatable Run the collector as a console app if you wish to capture diagnostic files to the local machine: – Profiler trace is always a server-side collection • Output path must exist on local machine and the SQL Server • Never capture Profiler to a UNC or network drive • . TRC files will be copied to local OUTPUT dir on shutdown – Other data types (blocker, perfmon, etc) will be captured wherever the collector console app is running
Scheduling Collection Start/Stop • When running as a service: – Schedule an NT job to run PSSDiag. Control START to start the service – Schedule an NT job to run PSSDiag. Control STOP to stop it • When running as a console app: – Schedule the console app to start via the NT scheduler – Use /E or /B parameters if start/stop time and day (or relative time) is known – Schedule an NT job to create a file named PSSDiag. STOP in the output folder • Don’t KILL or you will leave Profiler trace running on SQL - see KB 283786 for manually stop and delete trace.
Collecting Data for Extended Periods • Run as a service so that you can log out of the console (the GUI needn’t keep running) • Can schedule start/stop times and delete/rename old output folder • Consider using /C 1 to minimize space used by rolled over. TRC and. BLG files • The fact that. TRC must always be collected on the server makes remote collection not very effective for minimizing disk space use on the server
PSSDiag Impact on Server Performance • Impact of PSSDiag. EXE itself is negligible • Perf impact of collection equals sum of costs of diagnostics being collected • Generally dominated by cost of Profiler tracing (use the “Detailed Performance” trace template only when you actually need it) • Blocking detection script and Perfmon shouldn’t have a significant impact
Troubleshooting • • Intent is to save time – don’t let it become an obstacle Main collector log is ##PSSDiag. LOG All console output also written to application event log Some Perfmon counter errors are normal (e. g. “Could not add counter: XYZ. - The specified object is not found on the system. ”) • All scripts (and profiler trace) are started via osql. exe. Script output files are. OUT files with names like “##server__Run_sp_trace. OUT”
Demo - Using PSSDIAG Tool
SQL Server Performance Troubleshooting
Agenda • • • Methodology Resource bottlenecks Determining your bottleneck Which queries are responsible Tuning the identified queries
Methodology • System performance is the result of aggregate performance of all queries • At a high level what type of bottleneck does system have • Find the queries using the most of that resource • Is resource being used efficiently • Always another bottleneck
Common DB Bottlenecks • Synchronization (Locks/Latches) – 224453 is good KB for this • CPU – Single query/single CPU – Single query/parallel – Aggregate query load over all CPUs • IO – Insufficient memory or poor access path? • Memory – SQL Server throttles the number of concurrently executing queries with sorts/hashes
Performance Monitor • Synchronization – Locks: Lock Waits/sec, Lock Wait Time (ms) – Latches: Total Latch Wait Time, Latch Waits/sec • CPU – Sustained rates at 75+ percent – Compiles/sec, Recompiles/sec
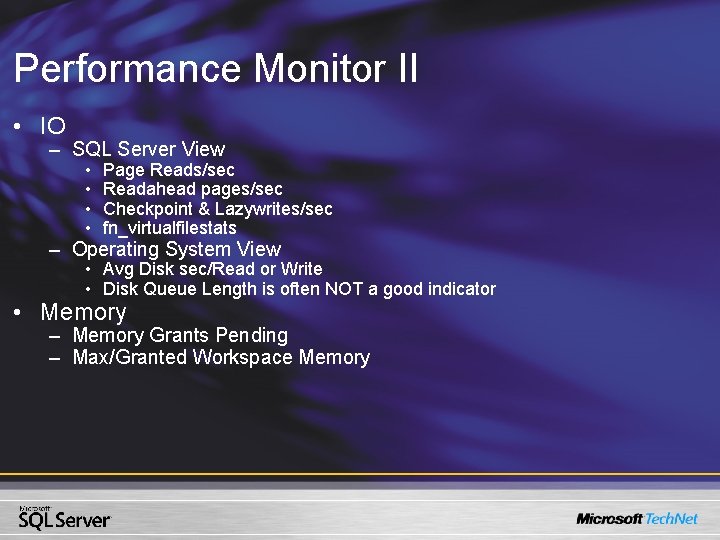
Performance Monitor II • IO – SQL Server View • • Page Reads/sec Readahead pages/sec Checkpoint & Lazywrites/sec fn_virtualfilestats – Operating System View • Avg Disk sec/Read or Write • Disk Queue Length is often NOT a good indicator • Memory – Memory Grants Pending – Max/Granted Workspace Memory
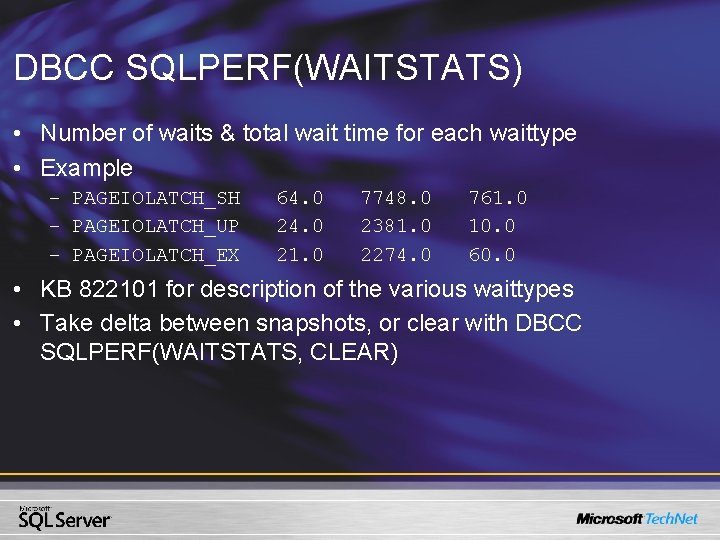
DBCC SQLPERF(WAITSTATS) • Number of waits & total wait time for each waittype • Example – PAGEIOLATCH_SH – PAGEIOLATCH_UP – PAGEIOLATCH_EX 64. 0 21. 0 7748. 0 2381. 0 2274. 0 761. 0 10. 0 60. 0 • KB 822101 for description of the various waittypes • Take delta between snapshots, or clear with DBCC SQLPERF(WAITSTATS, CLEAR)
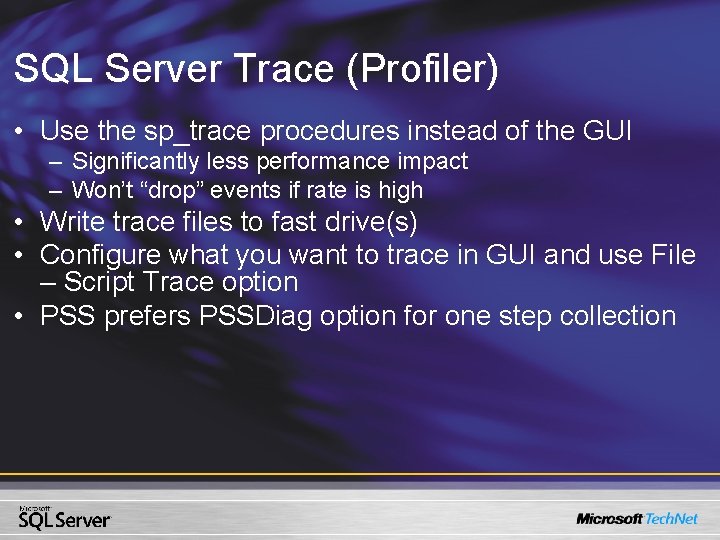
SQL Server Trace (Profiler) • Use the sp_trace procedures instead of the GUI – Significantly less performance impact – Won’t “drop” events if rate is high • Write trace files to fast drive(s) • Configure what you want to trace in GUI and use File – Script Trace option • PSS prefers PSSDiag option for one step collection
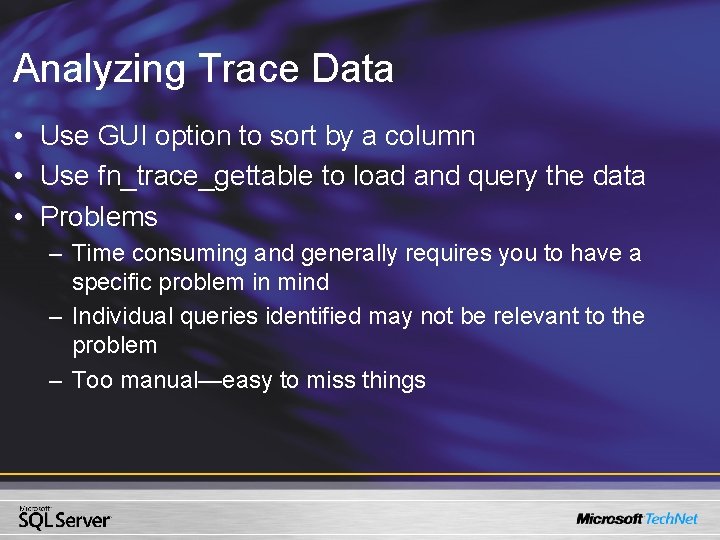
Analyzing Trace Data • Use GUI option to sort by a column • Use fn_trace_gettable to load and query the data • Problems – Time consuming and generally requires you to have a specific problem in mind – Individual queries identified may not be relevant to the problem – Too manual—easy to miss things
Introducing Read 80 Trace • All text is “normalized” to remove comments, white space & parameters • Database only stores the text of the first “unique” entry • Detail data is loaded in normalized format to facilitate joins, reduce redundant data – – Connections Batches/Unique. Batches Statements/Unique. Statements Plans/Unique. Plans • See KB 887057 for download location
Demo • Using Read 80 trace Tool - Queries using the most CPU - Query that changes execution plans - Comparing “good” trace with “bad” trace
Looking at Specific Queries • Does performance change correlate with plan differences – Different execution plan – Different amount of work performed • Majority of bad plans caused by poor cardinality estimates – Use STATISTICS PROFILE to find the problematic part of plan
Using STATISTICS PROFILE • Everything except Rows/Executes is compile time information • Executes column reflects parallelism – For example, scan that executes 4 times • Compare Rows with (Estimate. Rows * Estimate. Executes) – Find most deeply nested operator where the error originates; it propagates up the tree from there
Demo - Using STATISTICS PROFILE
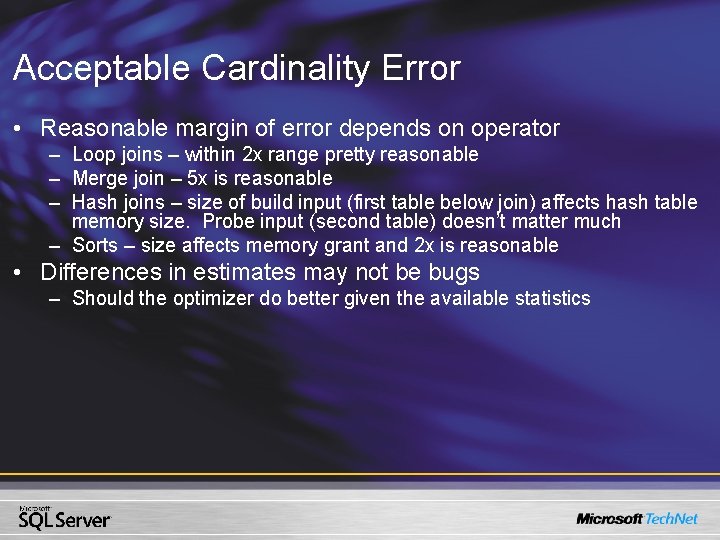
Acceptable Cardinality Error • Reasonable margin of error depends on operator – Loop joins – within 2 x range pretty reasonable – Merge join – 5 x is reasonable – Hash joins – size of build input (first table below join) affects hash table memory size. Probe input (second table) doesn’t matter much – Sorts – size affects memory grant and 2 x is reasonable • Differences in estimates may not be bugs – Should the optimizer do better given the available statistics
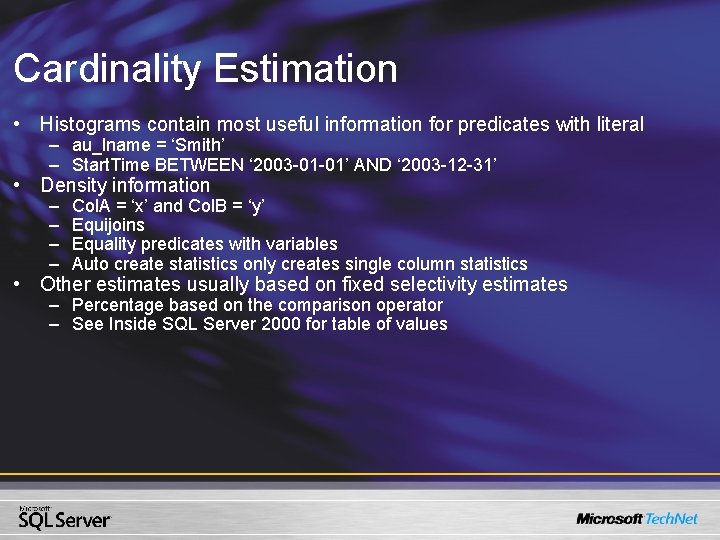
Cardinality Estimation • Histograms contain most useful information for predicates with literal – au_lname = ‘Smith’ – Start. Time BETWEEN ‘ 2003 -01 -01’ AND ‘ 2003 -12 -31’ • Density information – – Col. A = ‘x’ and Col. B = ‘y’ Equijoins Equality predicates with variables Auto create statistics only creates single column statistics • Other estimates usually based on fixed selectivity estimates – Percentage based on the comparison operator – See Inside SQL Server 2000 for table of values
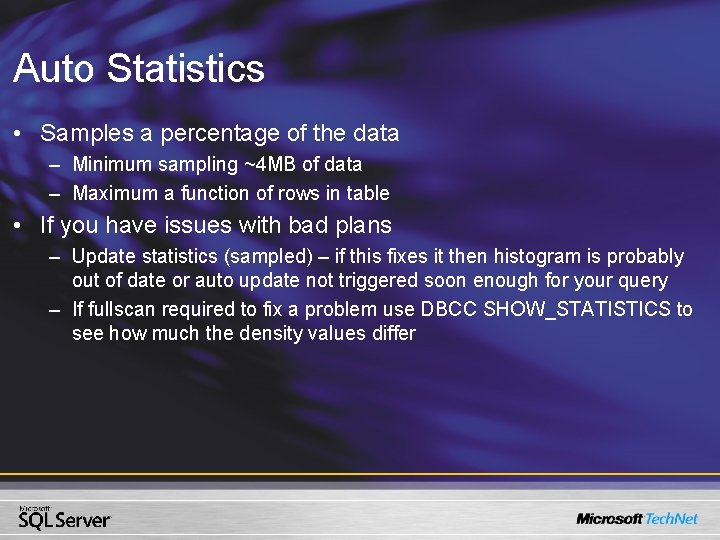
Auto Statistics • Samples a percentage of the data – Minimum sampling ~4 MB of data – Maximum a function of rows in table • If you have issues with bad plans – Update statistics (sampled) – if this fixes it then histogram is probably out of date or auto update not triggered soon enough for your query – If fullscan required to fix a problem use DBCC SHOW_STATISTICS to see how much the density values differ
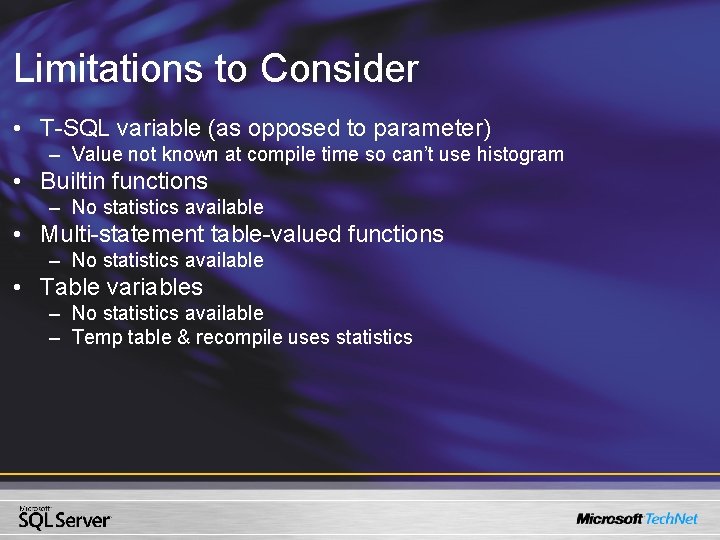
Limitations to Consider • T-SQL variable (as opposed to parameter) – Value not known at compile time so can’t use histogram • Builtin functions – No statistics available • Multi-statement table-valued functions – No statistics available • Table variables – No statistics available – Temp table & recompile uses statistics
SQL Server Locking Internals and Troubleshooting
Introduction • • • UMS Scheduling and Workers What is a SQL Resource How SQL Server really waits on a ‘resource’ Blocking Crabbing Fetch Rates Physical vs Logical Protection Scans and Lock Classes Lock Escalation
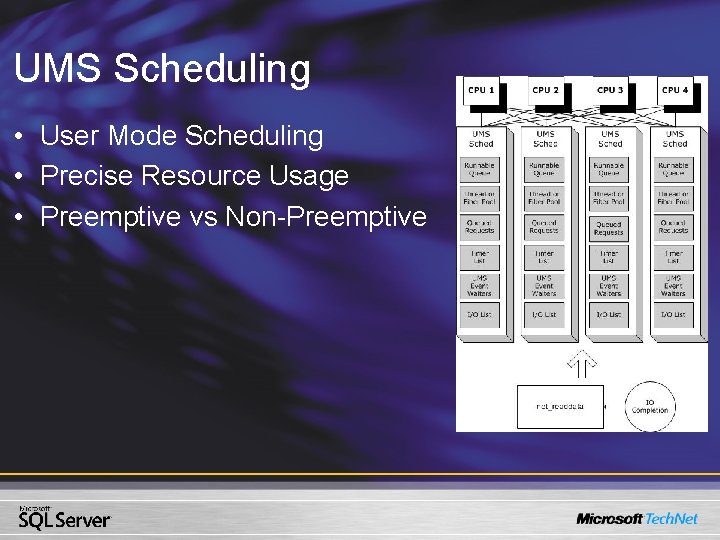
UMS Scheduling • User Mode Scheduling • Precise Resource Usage • Preemptive vs Non-Preemptive
SQL Server Workers • • • What is a worker? Worker Pool Request bound to Worker for (Life Time) - Example Target Setting - Example Not Dynamic Division of Workers
Connection Bound To Scheduler • Assignment: Scheduler with fewest users • Life time: Bound for connection life time • Workload Matters
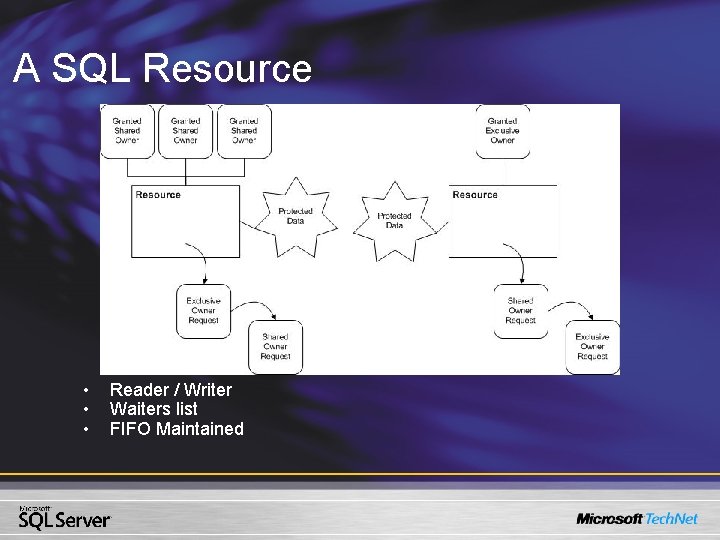
A SQL Resource • • • Reader / Writer Waiters list FIFO Maintained
Blocked / Blocking • • Blocked Worker tied up in block scenario Attentions / Query Timeout (Blocking) Diagnostics – – – – – sysprocesses syslockinfo dbcc opentran - Example Profiler and SQLTrace xact_abort Performance Monitor dbcc sqlperf(waitstats) dbcc pss – Example PSSDiag
Resource Crabbing • • • Maintains Data Stability Acquire Next Release Previous
Client Fetch Rate Matters • • • Sending Results How Crabbing Applies Mobile Links Lock Scope Never Perfect Preemptive Network Writes
Batch Size Can Matter • Touching Several Objects • External Logic – XProcs – COM Objects • The Transaction Log – Sector Alignment – Flush to LSN
DTC Locking • • • All Under One Roof SQL 7. 0 Behavior SQL 2000 Behavior Deadlocking SPID = -1 or SPID = -2
Physical versus Logical Protection • Physical = Latch – – Reading Page Into Memory Writing A Page To Disk Inserting A Row Internal Data Structures • Logical = Lock • Inserting / Modifying A Row
Scans (the SDES) Lock Classes • • • What is an SDES? SDES and Query Plan - Example Parallel – Multiple Scans What is a Lock Class? Lock Class and Lock Escalation
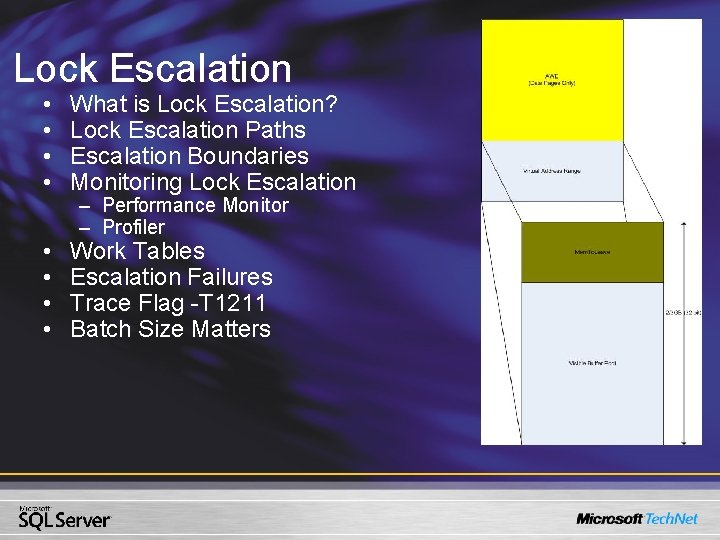
Lock Escalation • • What is Lock Escalation? Lock Escalation Paths Escalation Boundaries Monitoring Lock Escalation • • Work Tables Escalation Failures Trace Flag -T 1211 Batch Size Matters – Performance Monitor – Profiler
Helpful Tidbits • • • Identity Property Update with Variable Assignment Attentions / Query Cancels Blocked Scheduler Workers Open, Fetch, and Close Implicit Transactions MAXDOP = 1 Locking Hints Isolation Levels
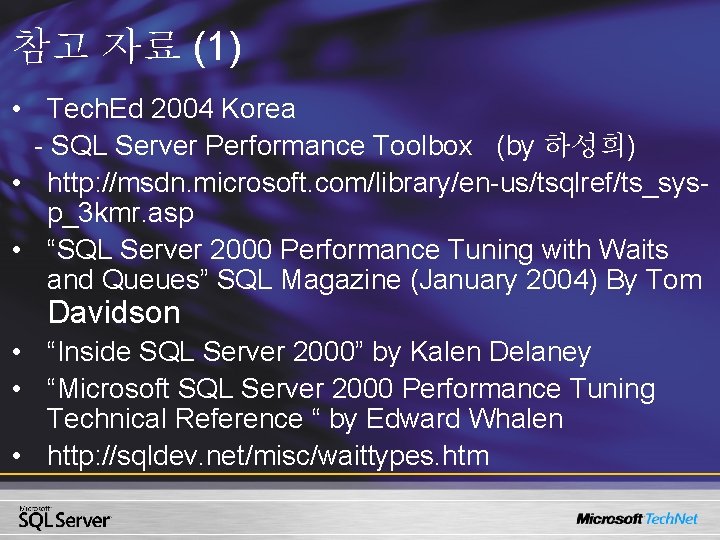
참고 자료 (1) • Tech. Ed 2004 Korea - SQL Server Performance Toolbox (by 하성희) • http: //msdn. microsoft. com/library/en-us/tsqlref/ts_sysp_3 kmr. asp • “SQL Server 2000 Performance Tuning with Waits and Queues” SQL Magazine (January 2004) By Tom Davidson • “Inside SQL Server 2000” by Kalen Delaney • “Microsoft SQL Server 2000 Performance Tuning Technical Reference “ by Edward Whalen • http: //sqldev. net/misc/waittypes. htm
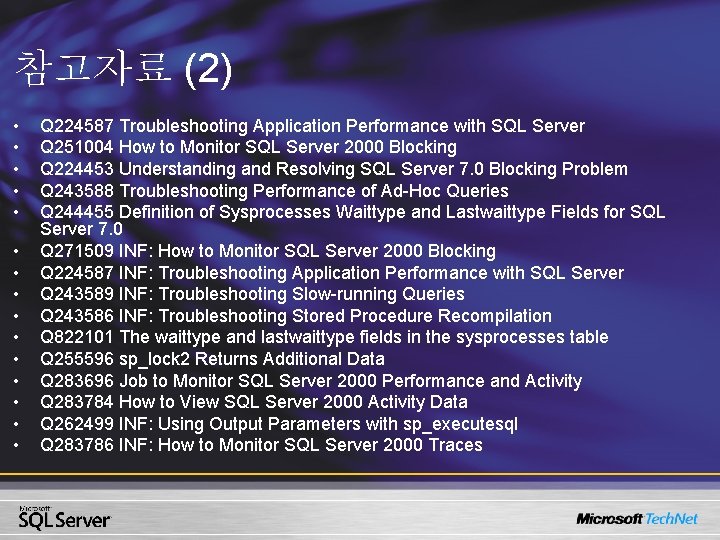
참고자료 (2) • • • • Q 224587 Troubleshooting Application Performance with SQL Server Q 251004 How to Monitor SQL Server 2000 Blocking Q 224453 Understanding and Resolving SQL Server 7. 0 Blocking Problem Q 243588 Troubleshooting Performance of Ad-Hoc Queries Q 244455 Definition of Sysprocesses Waittype and Lastwaittype Fields for SQL Server 7. 0 Q 271509 INF: How to Monitor SQL Server 2000 Blocking Q 224587 INF: Troubleshooting Application Performance with SQL Server Q 243589 INF: Troubleshooting Slow-running Queries Q 243586 INF: Troubleshooting Stored Procedure Recompilation Q 822101 The waittype and lastwaittype fields in the sysprocesses table Q 255596 sp_lock 2 Returns Additional Data Q 283696 Job to Monitor SQL Server 2000 Performance and Activity Q 283784 How to View SQL Server 2000 Activity Data Q 262499 INF: Using Output Parameters with sp_executesql Q 283786 INF: How to Monitor SQL Server 2000 Traces