PRT 140 PHYSICAL CHEMISTRY PHASE DIAGRAMS PN ROZAINI


 miscible liquids that")


 two immiscible liquids can be regarded as (b) the join")


 - Composition of the phases The compositions of phases in eqm are")


- Slides: 69
PRT 140 PHYSICAL CHEMISTRY PHASE DIAGRAMS PN. ROZAINI ABDULLAH PROGRAMME INDUSTRIAL CHEMICAL PROCESS
CHAPTER OUTLINE: • Definition • The phase rules • Two component system • Vapour pressure diagrams • Temperature – composition diagrams • Liquid-liquid phase diagrams • Liquid – solid phase diagrams
Definition: Terms Definition Phase A form of matter that is uniform throughout the chemical composition and physical state. Number of phase denote by P.
Example 1 2 One phase Donate by P= 1 Two phase Donate by P= 2
3 Three phase 1 2 immiscible Donate by P= 3 Two phase Metal 1 + Metal 2 Donate by P= 2 miscible One phase Donate by P= 1
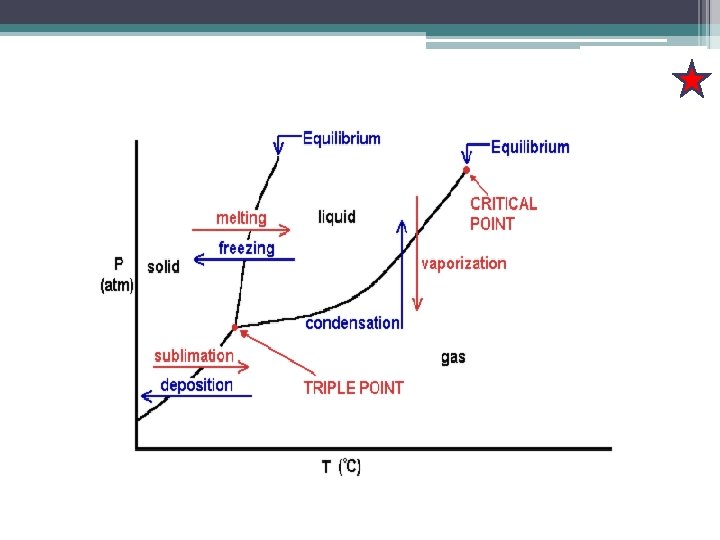
Phase Transition & Phase Diagram: Terms Definition Phase Transition The spontaneous conversion of one phase into another phase, occurs at a characteristic temperature for a given pressure. Transition Temperature The temperature at which the two phases are in equilibrium and the Gibbs energy of the system is minimized at the prevailing pressure. Phase Diagram a pure substance shows the regions of pressure and temperature at which its various phases of thermodynamically stable.
Definition: Terms Definition Vapour pressure The pressure of the vapour in equilibrium with the liquid Sublimation vapour pressure The vapour pressure of the solid phase Boiling temperature The temperature at which the vapour pressure of a liquid is equal to the external pressure Normal boiling point, Tb For the special case of an external pressure of 1 atm Critical temperature, Tc The temperature at which the surface disappears Critical pressure, Pc Supercritical fluid Melting temperature The vapour pressure at the critical temperature At the above the critical temperature The temperature at which under specified pressure the liquid and solid phases of a substance coexist in equilibrium
Definition: Terms Definition Freezing temperature Because a substance melts at exactly the same temperature as it freeze, the melting temperature of a substance is the same as freezing point. Normal freezing point, Tf The freezing temperature when the pressure is 1 atm Triple point A point at which the three phase boundaries meet.
Changes in Thermodynamic Properties First Order Second Order
Changes in Thermodynamic Properties First Order Second Order A transition for which the first derive of chemical potential with respect to temperature is discontinuous. Which the first derivative of µ with the respect to the temperature Is continuous but its second derivative is discontinuous.
Phase Rules: Terms Definition Phase Rules Which gives the number of parameters that can be varied independently (at least a small extent) while the number of phase in equilibrium is preserved. F=C–P+2 The phase rule F : variance C: components P: number of phase at equilibrium
Phase Rules: F=C–P+2 Terms Definition Variance, F Is the number of intensive variables that can be change independently without disturbing the number of phase in equilibrium. Components, C Chemically independent constituent of a system. The number of components in a system is the minimum number of type of independent species (ions or molecules) necessary to define the composition of all the phase present in the system.
Phase Rule • For a one component system F = 3 – P • When only one phase is present, F = 2 and both p and T can be varied without changing the number of phases. • When two phases are present, F = 1 which implies that pressure is not freely variable if the pressure is set. This is why at a given temperature a liquid has a characteristic vapor pressure. • When three phases are present, F = 0. This special case occurs only at a definite temperature and pressure that is characteristic of the substance.
Phase Rule
Two Component Systems • When two components are present in a system, C = 2, so F = 4 – P. • If the temperature is constant, the remaining variance is F’ = 3 – P. • F’ indicates that one of the degrees of freedom has been discarded – in this case the temperature. • The two remaining degrees of freedom are the pressure and the composition
Two-components system • Vapour-pressure diagrams - The partial vapour pressures of the components of an ideal solution of two volatile liquids are related to the composition of the liquid mixture by Roult’s law: : the vapour pressure of pure A • The total vapour pressure P of the mixture is therefore
Two Component Systems • This expression shows that the total vapor pressure (at a fixed temperature) changes linearly with the composition from p. B* to p. A* as x. A changes from 0 to 1.
The variation of the total vapour pressure of binary mixture with the mole fraction of A in the liquid when Roults’s law is obey
The Composition Of The Vapour • The composition of the liquid & vapour that are in mutual equilibrium are not necessarily the same. ØThe vapour should be richer in the more volatile component. ØDalton’s law: The mole fraction in the gas: ØProvided the mixture is ideal:
The mole fraction of A in the vapour binary ideal solution express in terms of its mole fraction in the liquid A is more volatile than B In all cases, the vapour is richer than the liquid in A Notes: if B is non volatile, so the =0 At the temperature of interest, then it makes No contribution to the vapour (y. B = 0).
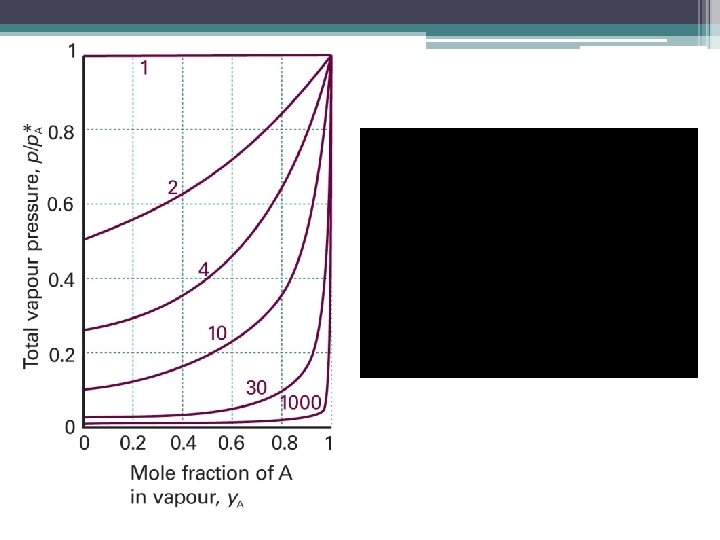
This equation can relate the total vapour pressure to the composition of the vapour
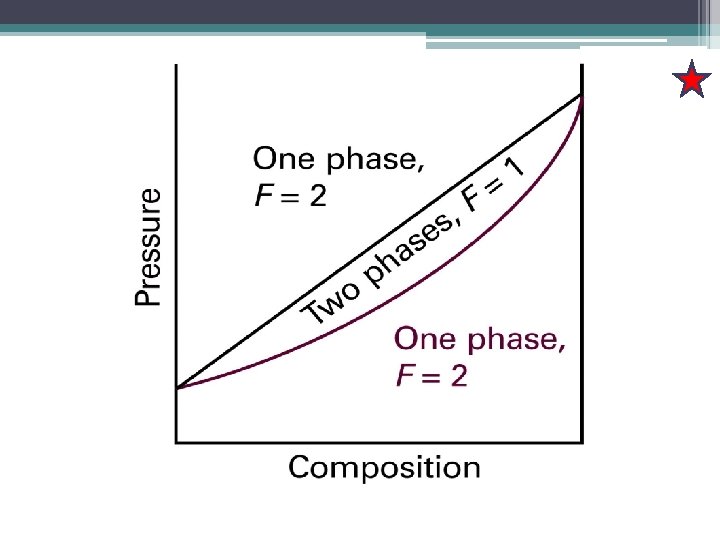
Two Component Systems • If we are interested in distillation, both vapor and liquid compositions are of equal interest. • So it makes sense to present data showing both the dependence of vapor and liquid composition upon mole fraction.
a : the vapour pressure of a mixture of composition, XA b: the composition of the vapour that is in equilibrium with the liquid at the temperature. Points that lie between the two lines correspond to a system in which there are two phases present, one a liquid and other a vapour.
Isopleth Single liquid phase a 1’ is the vapour phase Called as “tie line” represent as phase in equilibrium At this point, we may conclude that at that pressure there is virtually no vapour pressure. But, tiny amount of pressure present at a 1’.
• Now consider the effect of lowering the pressure to P 2: taking the system to a pressure and overall composition represented by point a 2”. • This new P is below the vapour pressure of original liquid, so it vapourizes until the vapour pressure of the remaining liquid falls to P 2. • The composition of such a liquid must be a 2. • The composition of the vapour in equilibrium is given by the point a 2’ at the other end of tieline.
• Pressure is further reduced to P 3, • The compositions of liquid and vapour are represented by the points a 3 and a 3’. • a 3‘ corresponds to a system in which the composition of the vapour is the same as the overall composition, we can conclude that the amount of liquid present is virtually 0, but the tiny amount of liquid present has composition a 3. • A further decrease in P, take the system to point a 4. • a 4: only vapour present and its composition is the same as the initial overall composition of the system.
The Lever Rule • A point in the two-phase of a phase diagram indicates not only qualitatively that both liquid and vapor present, but represents quantitatively the relative amounts of each. • To find the relative amounts of two phases a and b that are in equilibrium, we measure the distances la and lb along the horizontal tie line, and then use the lever rule.
The lever rule: nα : amount of phase α nβ : amount of phase β
Temperature-composition diagrams • To discuss distillation we need a temperaturecomposition diagram instead of a pressurecomposition diagram. • Such a diagram shows composition at different temperatures at a constant pressure (typically 1 atm).
The temperature-composition diagram corresponding to an ideal mixture with the component A more volatile than component B. Successive boiling and condensations of a liquid originally of composition a 1 is lead to condensate that is pure A. The separation technique is called fractional distillation.
Simple Distillation The vapor is withdrawn and condensed. This technique is used to separate a volatile liquid from a non-volatile solute or solid. Example: Distillation of herbs for perfumery and medicinal (herbal distillate)
Fractional Distillation • In a fractional distillation, the boiling and condensation cycle is repeated successively. • This technique is used to separate volatile liquids.
• The efficiency of a fractionating column is expressed in terms of the number of theoretical plates, the number of effective vaporization and condensation steps that are required to achieve a condensate of given composition from a given distillate.
The number theoretical plates is the number of step needed to bring about a specified degree of separation of two components in a mixture. The two systems shown correspond to (a) 3, (b) 5 theoretical plates.
Azeotropes • An azeotrope is a mixture of two (or more) miscible liquids that when boiled produce the same composition in the vapor phase as that is present in the original mixture.
Azeotropes • Although many liquids have temperaturecomposition phase diagrams resembling the ideal version, a number of important liquids deviate from ideality. • If a maximum occurs in the phase diagram, favorable interactions between A and B molecules stabilize the liquid. • If a maximum occurs in the phase diagram, unfavorable interactions between A and B molecules de-stabilize the liquid.
A high-boiling azeotrope. When the liquid composition a is distilled, the composition of the remaining liquid changes towards b but no further.
A low boiling azeotrope. When a mixture at a is fractionally distilled, the vapour in equilibrium in the fractionating columns moves towards b and then remains unchanged.
Immiscible Liquids • Let’s consider the distillation of two immiscible liquids, such as octane and water. • The system can be considered as the joint distillation of the separated components. • Total vapor pressure p = p. A* + p. B* • Mixture boils when p = 1 atm, and so the mixture boils at a lower temperature than either component would alone.
The distillation of (a) two immiscible liquids can be regarded as (b) the join distillation of the separated components, and boiling occurs when the sum of the partial pressure equals the external pressure.
Liquid-liquid Phase Diagrams • Let’s consider temperature-composition diagrams for systems that consist of pairs of partially miscible liquids. • Partially miscible liquids are liquids that do not mix at all proportions at all temperatures.
Phase Separation • Suppose a small amount of liquids B is added to another liquid A at a temperature T’. • If it dissolves completely the binary mixture is a single phase. • As more B is added, A becomes saturated in B and no more B dissolves 2 phases. • Most abundant phase is A saturated with B. • Minor phase is B saturated with A.
The temperature–composition diagram for hexane and nitrobenzene at 1 atm. The region below the curve corresponds to the composition and temperature at which the liquids are partially miscible. The upper critical temperatures, Tuc, is the temperature above which the liquids are miscible in all proportions.
Phase Separation • The relative abundance of each phase is given by the lever rule. • As the amount of B increases the composition of each phase stays the same, but the amount of each changes with the lever rule. • Eventually a point is reached when so much B is present that it can dissolve all the A, and system reverts to a single phase.
Example A mixture of 50 g of hexane (0. 59 mol C 6 H 14) & 50 g of nitrobenzene (0. 41 mol C 6 H 5 NO 2) was prepared at 290 K. a) What are the compositions of the phases? b) In what proportions /ratio do they occur? c) To what temperature must the sample be heated in order to obtain a single phase? Lets denote hexane by H and nitrobenzene by N
Answer a) - Composition of the phases The compositions of phases in eqm are given by the points where the tie line representing the tem intersects the phase boundary. The point x. N=0. 41, T=290 K occurs in 2 phase region of the phase diagram The horizontal line cuts the phase boundary at x. N=0. 35 and x. N=0. 83 composition of the 2 phases. b) Proportions Given by lever rule, the ratio of amounts of each phase = ratio of distances lα and lβ: - That is, there about 7 times more hexanerich phase than nitrobenzene-rich phase. c) Temp needed to obtain single phase - The temp at which the components are completely miscible is found by following isopleth upwards and noting the temp at which it enters the 1 phase region of the phase diagram = 292 K
Critical Solution Temperatures • The upper critical solution temperature, Tuc is the highest temperature at which phase separation occurs. • Above the critical temperature the two components are fully miscible. • On the molecular level, this can be interpreted as the kinetic energy of each molecule over coming molecular interactions that want molecules of one type to come close together.
Critical Solution Temperatures • Some systems show a lower critical solution temperature, Tlc. • Below this temperature the two components mix in all proportions and above which they form two phases. • An example is water and triethylamine.
The temperature-composition diagram For water and triethylamine. This system shows a lower critical temperature at 292 K. The labels indicate the interpretation of the boundaries.
Critical Solution Temperatures • The molecular reason for this is that water and triethylamine form a weak molecular complex. At higher temperatures the complexes break up and the two components are less miscible. • Some systems have upper and lower critical solution temperatures.
The temperature-composition diagram for the water and nicotine, which has both upper and lower critical temperatures. Note the high temperatures for the liquid (especially the water): the diagram corresponds to a sample under pressure.
Distillation Of Partially Miscible Liquids • What happens when you distill partially miscible liquids? • A pair of liquids that are partially miscible often form a low-boiling azeotrope. • Two possibilities can exist: one in which the liquid become fully miscible before they boil; the other in which boiling occurs before mixing is complete.
The temperature-composition diagram for a binary system in which the upper critical temperature is less then the boiling point at all composition. The mixture forms a low boiling azeotrope.
The temperature-composition diagram for a binary system in which boiling occurs before the two liquids are fully miscible.
Liquid-solid Phase Diagrams • The knowledge of temperature-composition diagrams for solid mixtures guides the design of important industrial processes, such as the manufacture of liquid crystal displays and semiconductors.
The temperature–composition phase diagrams for two almost immiscible solids and their completely miscible liquids. The isolepth through e corresponds to the eutetic composition, the mixture with lowest melting point.
Eutectics • The isopleth at e corresponds to the eutectic composition, the mixture with the lowest melting point. • A liquid with a eutectic composition freezes at a single temperature without depositing solid A or B. • A solid with the eutectic composition melts without any change of composition at the lowest temperature of any mixture.
Eutectics • Solder – 67% tin and 33% lead by mass melts at 183 °C. • 23% Na. Cl and 77% H 2 O by mass forms a eutectic mixture which melts at -21. 1 °C. Above this temperature the mixture melts.
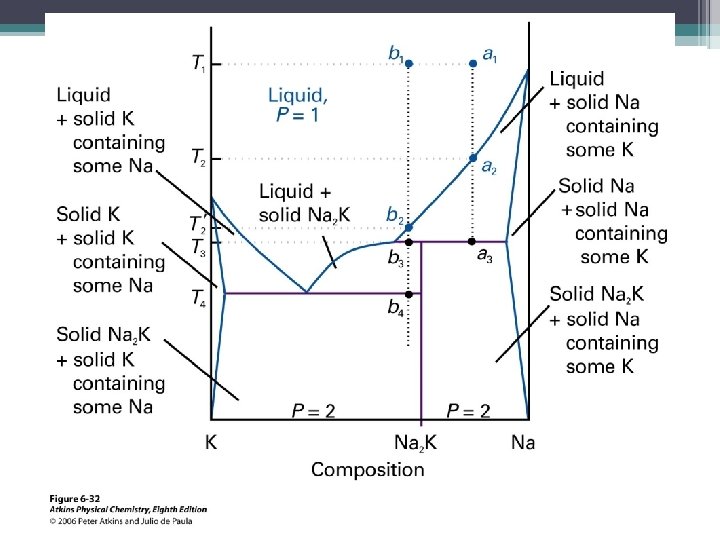
Reacting Systems • Many binary mixtures react produce compounds. • Gallium arsenide is a technologically important example – semiconductor. • Ga + As Ga. As
The phase diagram for a system in which A and B react to form a compound C = AB. The constituent C is a true compounds, not just an equimolar mixture.
Exercises 1 • At 90 o. C, the vapour pressure of methylbenzene is 53. 3 k. Pa and that of 1, 2 -dimethylbenzene is 20. 0 k. Pa. What is the composition of a liquid mixture that boils at 90 o. C when the pressure is 0. 50 atm? What is the composition of the vapor produced?
Exercise 2 • The vapour pressure of pure liquid A at 300 K is 76. 7 k. Pa and that of pure liquid B is 52. 0 k. Pa. These two compounds form ideal liquid and gaseous mixtures. Consider the equilibrium composition of a mixture in which the mole fraction of A in the vapour is 0. 350. Calculate the total pressure of the vapour and the composition of the liquid mixture.
Exercise 3 • Benzene and toluene form nearly ideal solutions. Consider an equimolar solution of benzene and toluene are 9. 9 k. Pa and 2. 9 k. Pa, respectively. The solution is boiled by reducing the external pressure below the vapour pressure. Calculate a)The pressure when boiling begins b)The composition of each component in the vapour c)The vapour pressure when only a few drops of liquid remains. Assume that the rate of vaporization is low enough for the temp to remain constant at 20 o. C.
Exercise 4 • The following temperature/composition data were obtained for a mixture of two liquids A and B at 1. 00 atm, where x is the mole fraction in the liquid and y is the mole fraction in the vapour at equilibrium. θ/o. C 125 130 135 140 145 150 x. A 0. 91 0. 65 0. 45 0. 30 0. 18 0. 098 y. A 0. 99 0. 91 0. 77 0. 61 0. 45 0. 25 • The boiling points are 124 o. C for A and 155 o. C for B. Plot the temperature/composition diagram for the mixture. • what is the composition of the vapour in equilibrium with the liquid composition (a) x. A=0. 50 and (b) x. B=0. 33?
Exercise 5 • 1 -Butanol and chlorobenzene form a minimum-boiling azeotropic system. The mole fraction of 1 -butanol in the liquid (x) and vapour (y) phases at 1. 00 atm is given below for a variety of boiling temperatures. T/K 396. 57 393. 94 391. 6 390. 15 389. 03 388. 66 388. 57 X 0. 1065 0. 1700 0. 2646 0. 3687 0. 5017 0. 6091 0. 7171 y 0. 2859 0. 3691 0. 4505 0. 5138 0. 5840 0. 6409 0. 7070 • Pure chlorobenzene boils at 404. 86 K (a)Construct the chlorobenzene-rich portion of the phase diagram from these data (b)Estimate the temp at which a solution whose mole fraction of 1 butanol is 0. 3 begins to boil (c)State the compositions and relative proportions of the 2 phases present after a solution initially 0. 300 1 -butanol is heated to 393. 94 K.