PROVIDENCE RIVER PEDESTRIAN BRIDGE FINAL CAPSTONE PRESENTATION CIVIL

PROVIDENCE RIVER PEDESTRIAN BRIDGE FINAL CAPSTONE PRESENTATION CIVIL ENGINEERING CLASS OF 2014 | APRIL 29, 2014
 – SUSTAINABILITY AND COST ESTIMATION MAX VINHATEIRO – PIER ANALYSIS")
BEVERLY XU (PROJECT MANAGER) – SUSTAINABILITY AND COST ESTIMATION MAX VINHATEIRO – PIER ANALYSIS AND ABUTMENT DESIGN THOMAS SCHIEFER – BRIDGE DECK DESIGN PARTNER JENN THOMAS – BRIDGE DECK DESIGN PARTNER RACHEL CONNOR (PROJECT DRAFTER) – PIER DECK DESIGN KA LING WU – CANOPY DESIGN

HISTORICAL CONTEXT INTRODUCTION § I-195 Redevelopment Parcels § June 2007 - RIDOT Feasibility Study § Pedestrian Bridge Design Competition History Geotechnical Bridge Deck Pier Decks Canopy Sustainability Cost

HISTORICAL CONTEXT I-195 REDEVELOPMENT PARCEL

HISTORICAL CONTEXT FEASIBILITY STUDY Glu-lam $1. 77 $2. 00 $2. 03 Concrete $1. 34 $1. 43 $1. 63 Steel girder $1. 31 $1. 40 $1. 60 Steel truss $1. 28 $1. 40 $1. 54 Pier Removal $0. 0 72 degrees 60 degrees Offset $4. 04 $5. 0

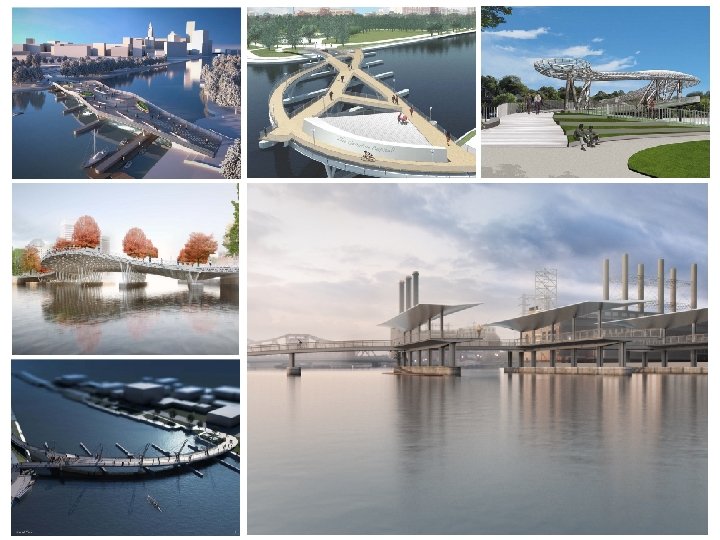
HISTORICAL CONTEXT FEASIBILITY STUDY

PIER DECK BRIDGE DECK CANOPY

GEOTECHNICAL EXISTING PIERS • Five piers span the river • 76 feet span between • 141’x 6’ • Concrete encased in 1. 5’ granite blocks • Deep concrete T-beam History Geotechnical Bridge Deck Pier Decks Canopy Sustainability Cost

GEOTECHNICAL EXISTING PIERS • Shear reinforcement • Flexural reinforcement

GEOTECHNICAL EXISTING PIERS - ANALYSIS Flipped problem upside-down Solve for continuous load

GEOTECHNICAL EXISTING PIERS - RESULTS • Allowable distributed load of 305. 9 k/ft • Multiply by entire length of pier: 141 ft. • Divide into total area feeding into single pier: ~ 4, 780 ft 2 • Area load on bridge deck: 9. 07 k/ft 2

GEOTECHNICAL FOUNDATION DESIGN – SOIL CONDITIONS • Mixture of compacted sand, gravel, fill, some silt • Thick layers of silt • Previous bridge loads transferred to bedrock • Largely undisturbed soil

GEOTECHNICAL FOUNDATION DESIGN – SOIL CONDITIONS West bank

GEOTECHNICAL FOUNDATION DESIGN – SOIL CONDITIONS East bank

GEOTECHNICAL FOUNDATION DESIGN – BEARING CAPACITY 2 methods considered: • Terzaghi: qult=c. Nc+q. Nq+0. 5γBNγ Model based on theory of plasticity applied to soil Requires values of shear angle, density, cohesion

GEOTECHNICAL FOUNDATION DESIGN – BEARING CAPACITY • Meyerhof: qallow=N/4 Kd Empirical formula, uses only boring log data, simple design assumptions

GEOTECHNICAL FOUNDATION DESIGN – BEARING CAPACITY West bank bearing capacity: 5. 87 k/ft 2 East bank bearing capacity: 3. 91 k/ft 2 Use to calculate area required to deliver loads to soil Assign length of combined footings: 26’ 6” E 1: 3’ 7”. W 1: 4’ 1” W 2: 3’ 4”

GEOTECHNICAL FOUNDATION DESIGN – SHEAR 1 -Way shear: ϕVc=ϕ 2 f'cbwd≥Vu 2 -Way shear:

GEOTECHNICAL FOUNDATION DESIGN – FLEXURAL REINFORCEMENT Concrete is weak in tension Steel rebar added to take tensile loads from moments Area of steel calculated from ultimate moment: As=Mu/(ϕfyjd ) FOOTING Long Span Short Span E 1 8 No. 6 bars @ 5” 19 No. 8 bars W 1 5 No. 9 bars @ 9” 23 No 8 bars W 1 5 No. 7 bars @ 8” 21 No. 7 bars

GEOTECHNICAL FOUNDATION DESIGN – FLEXURAL REINFORCEMENT E 1 W 2

GEOTECHNICAL FOUNDATION DESIGN – SETTLEMENT Settlement occurs in silt layers Increasing depth -> increased area of applied load
*Hlog((σ’v 0 +∆σ )/σ’v 0) FOOTING")
GEOTECHNICAL FOUNDATION DESIGN – SETTLEMENT s = Cc/(1+e 0)*Hlog((σ’v 0 +∆σ )/σ’v 0) FOOTING Settlement E 1 . 63 in. W 1 . 96 in. W 2 . 52 in.

History Geotechnical Bridge Deck Pier Decks Canopy Sustainability Cost

BRIDGE DECK DESIGN § § § 30° northwest Upward slopes of 1: 20 and 1: 15 4 girders No joist system Two columns per pier +/- 75 foot spans

BRIDGE DECK SAP MODEL: DESIGN § With original orientation § Added joist system § Changed average span length

BRIDGE DECK SAP MODEL: DESIGN - SPANS 1 2 3 4 5 6 7

BRIDGE DECK SAP MODEL: JOINTS § Bottom of columns completely restrained § All other joints have no restraints or constraints § All joints welded

BRIDGE DECK SAP MODEL: AREA LOADS: § Dead § Snow § Deck § Live § Wind § Earthquake

BRIDGE DECK SAP MODEL: MEMBER ASSIGNMENTS I BEAM/W FLANGE HSS/BOX BEAM WT SECTION

BRIDGE DECK SAP MODEL: MEMBER ASSIGNMENTS GIRDER JOIST COLUMN GIRDER: HSS 28 x 6 x 1/2 JOIST: W 8 x 40 COLUMN: W 12 x 96

BRIDGE DECK SAP MODEL: ANALYSIS DEFLECTIONS MOMENT DIAGRAM SHEAR DIAGRAM

BRIDGE DECK SAP MODEL: ANALYSIS

BRIDGE DECK MOVING FORWARD § Thermal Loads § Seismic Conditions § Wind Uplift

BRIDGE DECK GRAVITY LOAD DETERMINATIONS Dead Load -Member Loads -HSS 28 x 6 x 1/2 Girder Weight: 112. 4 plf -W 8 x 40 Joist Weight: 40 plf -W 12 x 96 Column Weight: 96 plf -Total Weight: 296. 351 kips -Decking Loads: 30 psf Live Load -International Building Code (IBC) and Additional Factor of Safety -100 psf Snow Load -American Society of Civil Engineering (ASCE) Code 7 -10 -30 psf

BRIDGE DECK LATERAL LOAD DETERMINATIONS Wind Load -ASCE 7 -10 Standard Chapter 26 -Net Wind Pressure: 19. 42 psf Seismic Load -ASCE 7 -10 Standard Chapter 12 -Seismic Data Taken from United States Geological Survey (USGS) Maps -Lateral Seismic Load: 44. 84 Kips Load and Resistance Factor Design (LRFD) Combinations -7 Equation Combinations -Use Maximum (Most Conservative) Combination -Treat Lateral Load and Gravity Loads Separately

BRIDGE DECK TRIBUTARY AREA Tributary Area of Girder Tributary Width of Girder Tributary Area of Column

BRIDGE DECK HSS 28 x 6 x 1/2 GIRDER ANALYSIS Interior Exterior Maximum Moment in Beam (K-ft) 483. 12 708. 39 Max Allowed Moment (K-ft) 3644. 25 Meets Design Constraint?

BRIDGE DECK W 8 x 40 JOIST ANALYSIS Moment Analysis -Tested for Joist Above Columns (Takes Larger Load) -Tested for Moment Strength -Values for Maximum Allowable Moment Available in AISC Steel Manual -Analyzed as Simply Supported Beam with Girder Weights as Point Loads Maximum Moment from Distributed Load (Kips-ft) 86. 8 Maximum Moment from Point Loads (Kips-ft) 8 Total Maximum Moment (Kips-ft) 94. 8 Max Allowed Moment (Kips-ft) 149 Meets Design Constraint?

BRIDGE DECK W 12 x 96 COLUMN ANALYSIS Axial Loading -Gravity Loads are Applied Axially to Columns -Columns are not “Slender” Enough to be Analyzed for Elastic or Inelastic Buckling -Analyzed for Shear Yielding Instead -Results for 10. 5 ft Column Factored Load (Kips) 333. 4 Maximum Allowable Load (Kips) 1127 Meets Design Constraint? Lateral Loading -Seismic Load Treated as Point Load Acting at Top of Column -Column Tested for Maximum Allowable Moment -Not Necessary to Test for Interaction of Loads Maximum Moment (Kips-ft) 470. 82 Maximum Allowable Moment (Kipsft) 551 Meets Design Constraint?

BRIDGE DECK RESULTS COMPARISON Difference in Applied Moments -Moments from Hand Calculations are Larger -Example: 162. 82 Kip-ft (SAP) versus 483. 12 Kip-ft -Loading Cases are the Same Reasons for the Discrepancy -Difference in Member Length -Difference in Joint Connections -Greater Capacity in SAP

BRIDGE DECK VIBRATIONS

BRIDGE DECK SOFTWARE MODELING Modeled in RAM Structural Software -Only One Panel of the Bridge will be Analyzed -RAM Structural Software only tests for one type of vibration Modeling Challenges -RAM does not allow custom beams -Only performs vibrational analysis for steel-composite decking

BRIDGE DECK HAND CALCULATIONS FOR VIBRATIONS

BRIDGE DECK RESULTS COMPARISON Result Summary Output from: RAM Software Hand Calculations HSS 20 x 12 x 5/8 2. 65 2. 25 W 8 x 48 4. 95 4. 42 Frequency (Hz) System 2. 33 2. 15 2. 16 1. 8 Acceleration limit, ao/g (%) Comparisons -Produced Similar Values -Both Show the Bridge Satisfies Design Criterion

PIER DECK DESIGN CONSIDERATIONS • Collaboration with bridge deck • Tapered Beams • Cantilevered spans

PIER DECK BASIC LAYOUT 40’ 20’ 40’ History Geotechnical Bridge Deck Pier Decks Canopy Sustainability Cost

PIER DECK BASIC LAYOUT

PIER DECK TAPERED BEAMS
*2 = 2. 667 in. §")
PIER DECK DEFLECTIONS § Maximum deflection of cantilever: (L/360)*2 = 2. 667 in. § Largest deflection: 1. 9593 in.

PIER DECK DEMAND/CAPACITY RATIOS

PIER DECK DEMAND/CAPACITY RATIOS SPAN TYPE DEMAND/CAPACITY RATIO Interior Box Beam – 10 ft. 0. 033 – 0. 383 Interior Box Beam – 40 ft. 0. 144 – 0. 174 Exterior Girder (W 14 x 68) – 10 ft. 0. 044 – 0. 215 Exterior Girder (W 14 x 68) – 40 ft. 0. 127 – 0. 139 Typical Joist 0. 077 – 0. 600 Column 0. 123 – 0. 236

PIER DECK MOMENT DIAGRAMS Mu = -260. 08 kip-ft Mu = -523. 95 kip-ft Mu = -375. 57 kip-ft

PIER DECK MOMENT DIAGRAMS Mu = -14. 04 kip-ft Mu = -84. 24 kip-ft

PIER DECK REVIT MODEL

PIER DECK REVIT MODEL aa aa

PIER DECK REVIT MODEL

PIER DECK REVIT MODEL

CANOPY INTRODUCTION § 3 tempered metal clad canopies § Deep “V” structures § Solar collectors History Geotechnical Bridge Deck Pier Decks Canopy Sustainability Cost

CANOPY SPECIFICATIONS 180’ long, 22’ wide

CANOPY DESIGN CONSIDERATIONS § Gravity Load Dead Load, Live Load, Snow Load § Lateral Load Wind Load, Seismic Load § Deflection Limits

CANOPY GRAVITY LOAD • Dead load Self-weight: ~100 Kip Metal Cladding and Solar panels: ~5 psf • Snow load: 30 psf • Live load: 20 psf

CANOPY LATERAL LOAD • Wind Load • Seismic Load: 15 kips

CANOPY DESIGN

CANOPY DESIGN • 10 Fan Trusses • Frame with releases • Biggest column size: W 36 x 170 • Number of pieces per canopy: 305 • Weight per canopy: 98. 1 Kip • Cost per canopy: $217, 660

CANOPY CONCLUSION AND DISCUSSION • Structure of canopies designed • Challenges: Frame releases Deflection limits Area section properties • Room for improvement Other truss designs Other member section types

SUSTAINABILITY WOOD DECKING IPE § § History Geotechnical Structural grade Durable, weather resistant 4” X 6” decking Forest Stewardship Council certified Bridge Deck Pier Decks Canopy Sustainability Cost

SUSTAINABILITY SNOWMELT SYSTEM Solar-heated glycol circuit Glycol-heated pedestrian path Utility corridor

SUSTAINABILITY SNOWMELT SYSTEM Tatm qconvection qradiation Tsurface ¼ ” qconduction 1”ø 6” qconduction = qconvection + qradiation Tfluid

COST ESTIMATION GEOTECHNICAL INVESTIGATION STEEL - MATERIAL AND INSTALLATION CONCRETE - MATERIAL AND INSTALLATION SUSTAINABILITY FEATURES NON-STRUCTURAL FEATURES PROFESSIONAL CONSULTANTS PERMITTING CONTINGENCIES SITE ADJUSTMENT FACTOR History Geotechnical Bridge Deck Pier Decks Canopy Sustainability Cost

COST ESTIMATION GEOTECHNICAL INVESTIGATION ITEM COST Borings, field stake out, elevations $3, 525. 00 Drawings of boring details $1, 245. 00 Report and recommendations from P. E. $2, 850. 00 TOTAL $7, 620. 00

COST ESTIMATION STEEL COST SUMMARY ITEM Material COST $876, 226. 12 Fabrication $428, 068. 63 Shipment $19, 458. 00 Steel Erection – Crane $7, 426. 67 Steel Erection – Crew $125, 472. 00 Moment Connections $56, 000. 00 Profit $76, 132. 57 TOTAL $1, 598, 783. 99

COST ESTIMATION CONCRETE COST SUMMARY ITEM Spread and continuous footings COST $6, 902. 50 Rebar Reinforcement $781. 95 Profit $384. 22 TOTAL $8, 068. 67

COST ESTIMATION SUSTAINABLE FEATURES ITEM FSC Certified Wood COST $955, 597. 50 Snowmelt System $25, 030. 63 TOTAL $980, 628. 13

COST ESTIMATION ADDITIONAL COSTS ITEM Architectural Fees COST $454, 080. 13 Construction Management Fees $127, 710. 03 Engineering Structural Fees $70, 950. 02 Permits $56, 760. 02 Contingencies $283, 800. 08 TOTAL $993, 300. 28 ITEM Railings COST $207, 900. 00 Ornamental Lighting $35, 000. 00 TOTAL $242, 900. 00

COST ESTIMATION GEOTECHNICAL INVESTIGATION UNADJUSTED PROJECT COST: $3, 831, 301 ADJUSTED PROJECT COST: $4, 114, 817 COST PER SQUARE FOOT: $221. 52

COST ESTIMATION VALUE ENGINEERING § Reduce depth of wood decking § Narrower bridge deck and canopy § Construction staging

ACKNOWLEDGEMENTS SPECIAL THANKS TO… PERRY ASHENFELTER, ASSISTANT PM, SHAWMUT DESIGN AND CONSTRUCTION PROFESSOR JANET BLUME, BROWN UNIVERSITY ENGINEERING CHRISTOPHER BULL, SENIOR LECTURER IN ENGINEERING, BROWN UNIVERSITY DAVID CARCHEDI, Ph. D, P. E. , GZA GEOENVIRONMENTAL INC. WIL HERNANDEZ, RHODE ISLAND DEPARTMENT OF TRANSPORTATION DR. INDREK KULAOTS, LECTURER IN ENGINEERING, BROWN UNIVERSITY JULIE MARTON, P. E. , ODEH ENGINEERS INC. MICHAEL MCCORMICK, ASSISTANT VP, DEPT OF FACILITIES MANAGEMENT DAVID ODEH, P. E. , ODEH ENGINEERING, ADJUNCT LECTURER, BROWN UNIVERSITY MICHAEL SIGMON, F. D. STERRITT LUMBER CO. PATRICIA STEERE, P. E. , STEERE ENGINEERING INC.

THANK YOU QUESTIONS?
- Slides: 79