
Prospect of Global Agricultural Commodity Markets CONTENTS Changes
Prospect of Global Agricultural Commodity Markets 총장 배 종 하
CONTENTS Changes and current situation of global food market Background of recent hike of the world food prices Outlook of global food market
Ⅰ. Changes and current situation of global food market
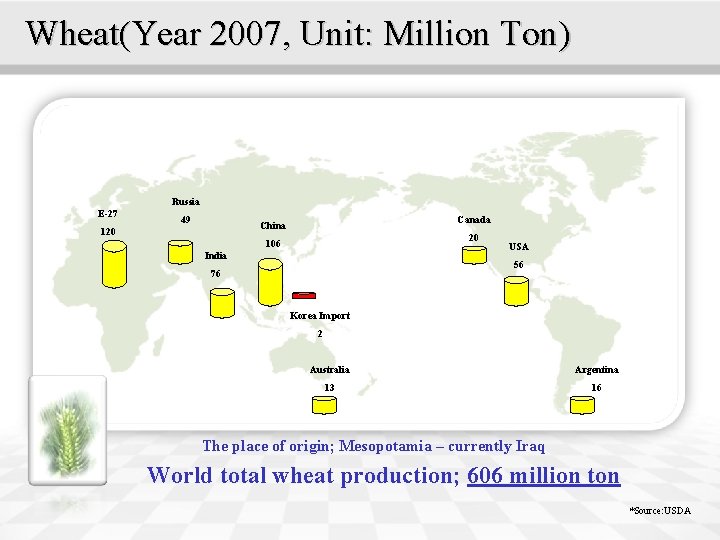
Wheat(Year 2007, Unit: Million Ton) Russia E-27 49 Canada China 120 20 106 India USA 56 76 Korea Import 2 Australia Argentina 13 16 The place of origin; Mesopotamia – currently Iraq World total wheat production; 606 million ton *Source: USDA
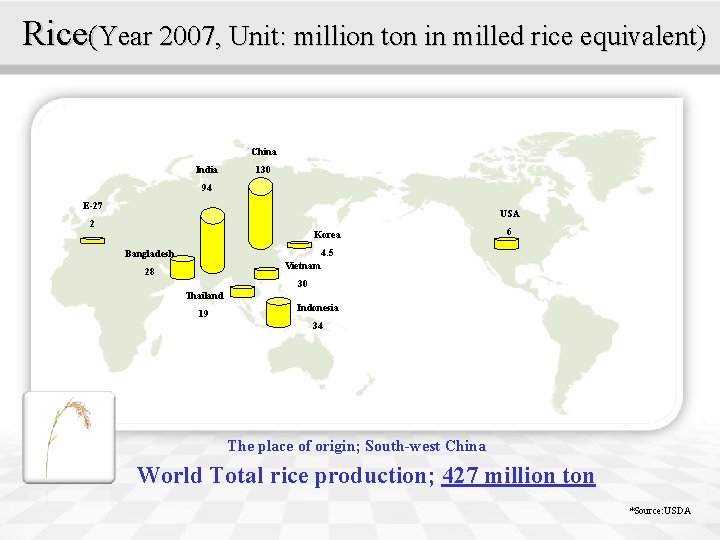
Rice(Year 2007, Unit: million ton in milled rice equivalent) China India 130 94 E-27 USA 2 Korea 6 4. 5 Bangladesh Vietnam 28 30 Thailand 19 Indonesia 34 The place of origin; South-west China World Total rice production; 427 million ton *Source: USDA
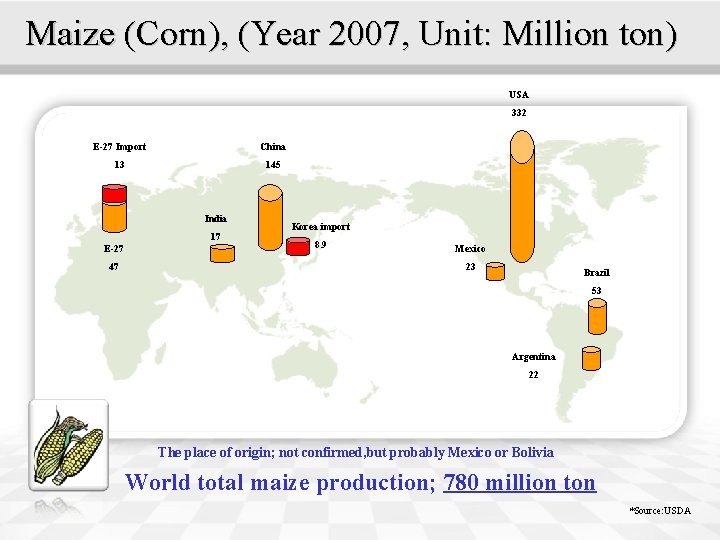
Maize (Corn), (Year 2007, Unit: Million ton) USA 332 E-27 Import China 13 145 India 17 E-27 47 Korea import 8. 9 Mexico 23 Brazil 53 Argentina 22 The place of origin; not confirmed, but probably Mexico or Bolivia World total maize production; 780 million ton *Source: USDA
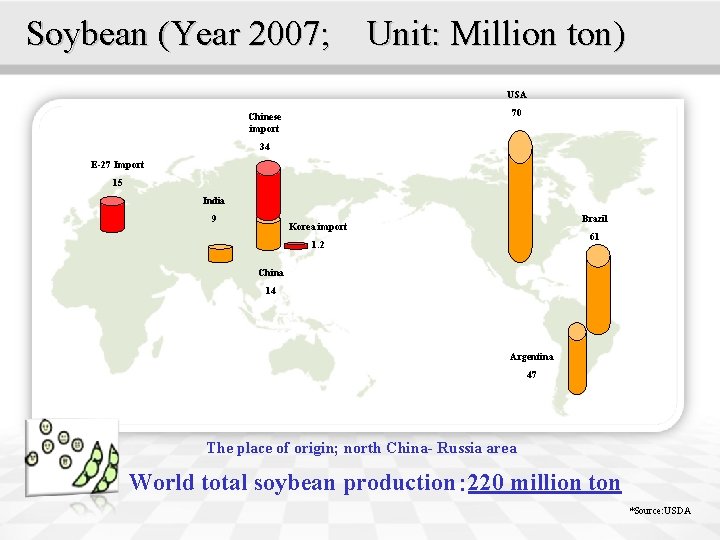
Soybean (Year 2007; Unit: Million ton) USA 70 Chinese import 34 E-27 Import 15 India 9 Brazil Korea import 61 1. 2 China 14 Argentina 47 The place of origin; north China- Russia area World total soybean production: 220 million ton *Source: USDA
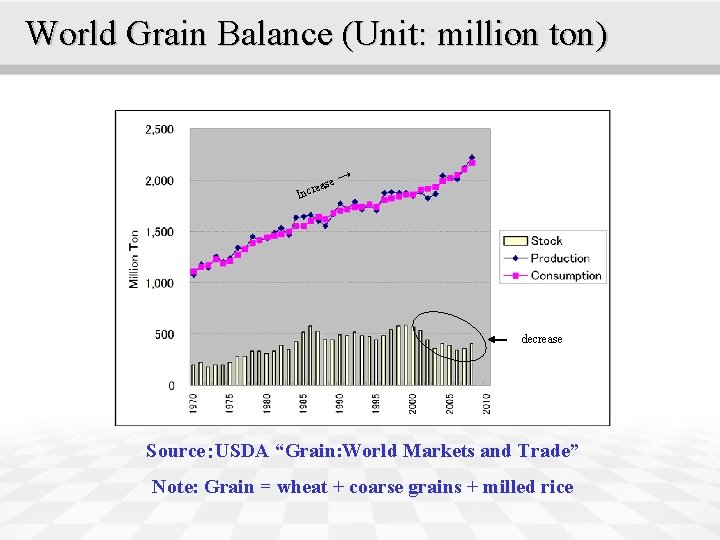
World Grain Balance (Unit: million ton) se → ea Incr decrease Source:USDA “Grain: World Markets and Trade” Note: Grain = wheat + coarse grains + milled rice
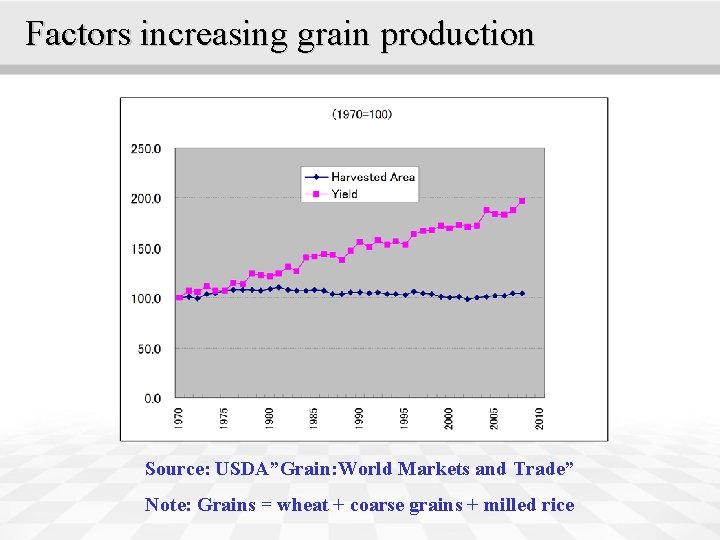
Factors increasing grain production Source: USDA”Grain: World Markets and Trade” Note: Grains = wheat + coarse grains + milled rice
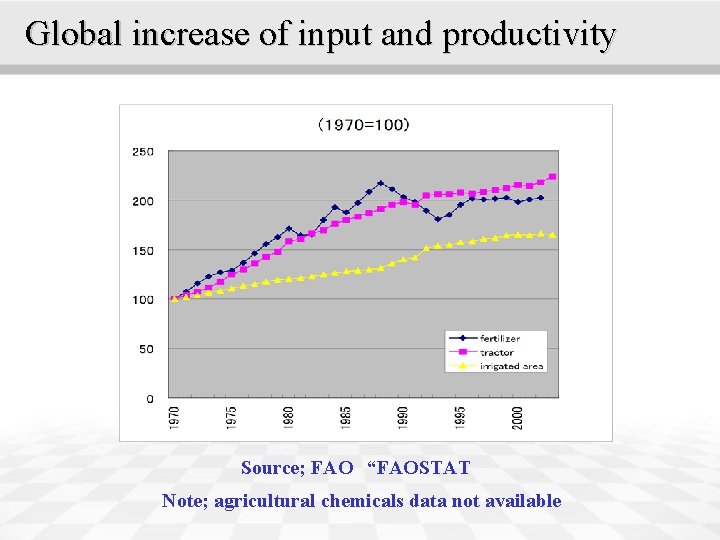
Global increase of input and productivity Source; FAO “FAOSTAT Note; agricultural chemicals data not available
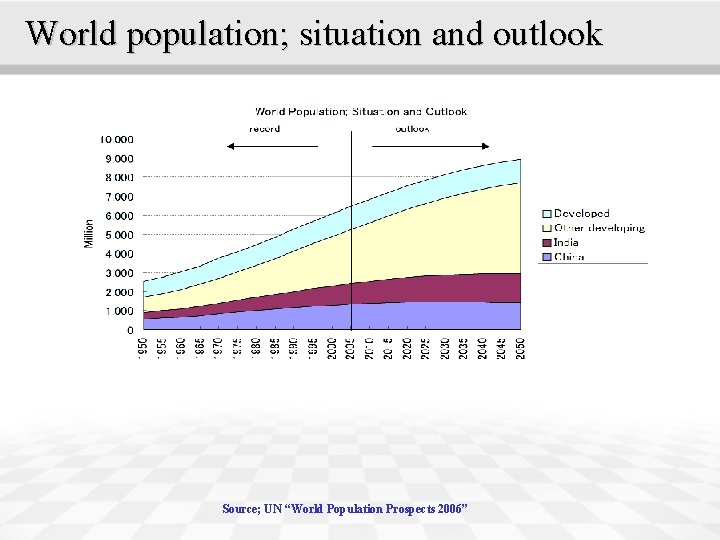
World population; situation and outlook Source; UN “World Population Prospects 2006”
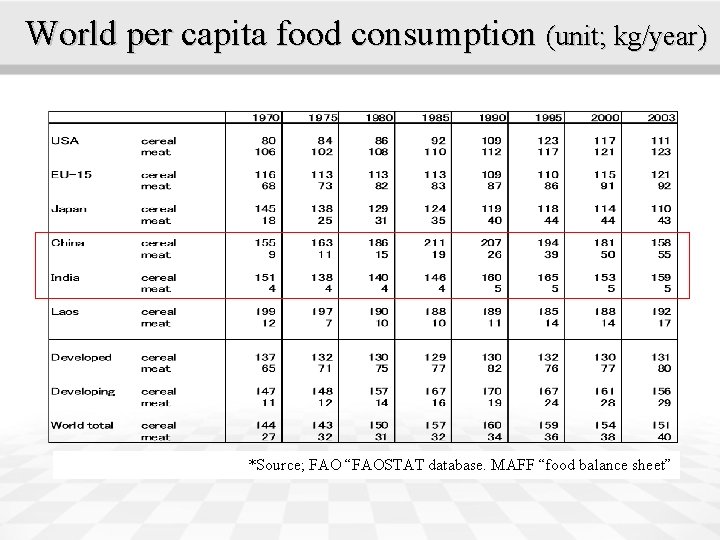
World per capita food consumption (unit; kg/year) *Source; FAO “FAOSTAT database. MAFF “food balance sheet”
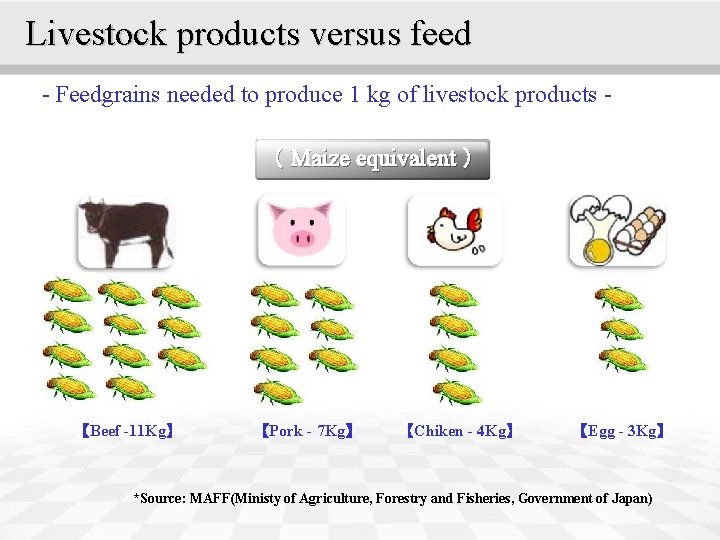
Livestock products versus feed - Feedgrains needed to produce 1 kg of livestock products ( Maize equivalent ) 【Beef -11 Kg】 【Pork - 7 Kg】 【Chiken - 4 Kg】 【Egg - 3 Kg】 *Source: MAFF(Ministy of Agriculture, Forestry and Fisheries, Government of Japan)
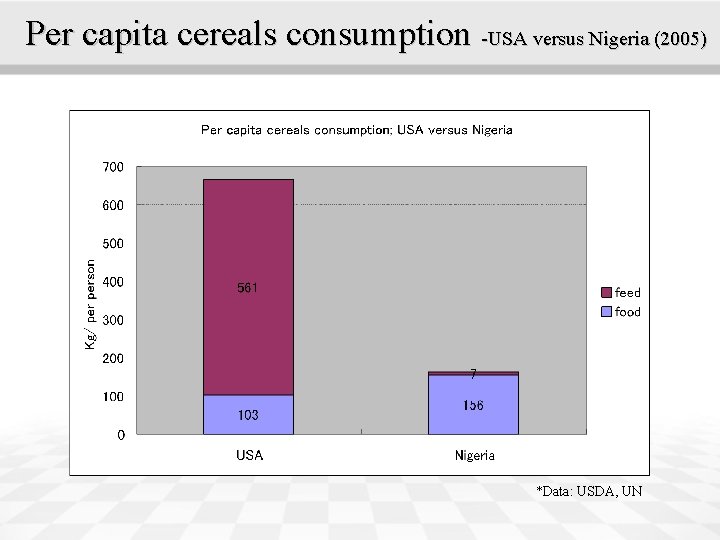
Per capita cereals consumption -USA versus Nigeria (2005) *Data: USDA, UN
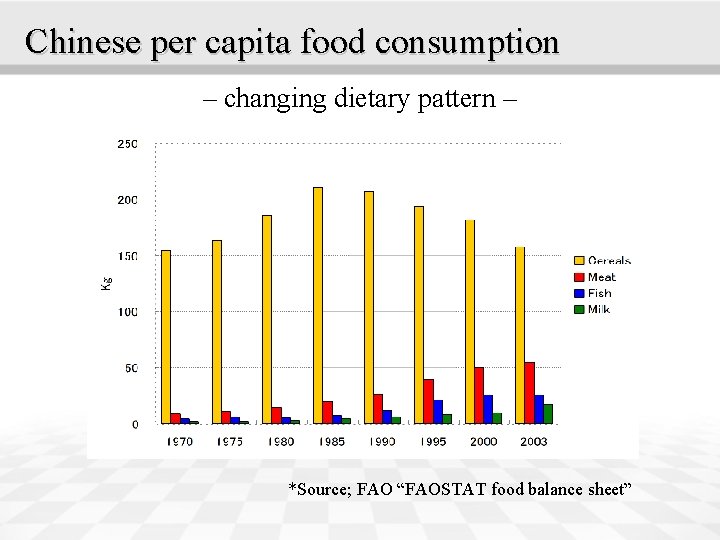
Chinese per capita food consumption – changing dietary pattern – *Source; FAO “FAOSTAT food balance sheet”
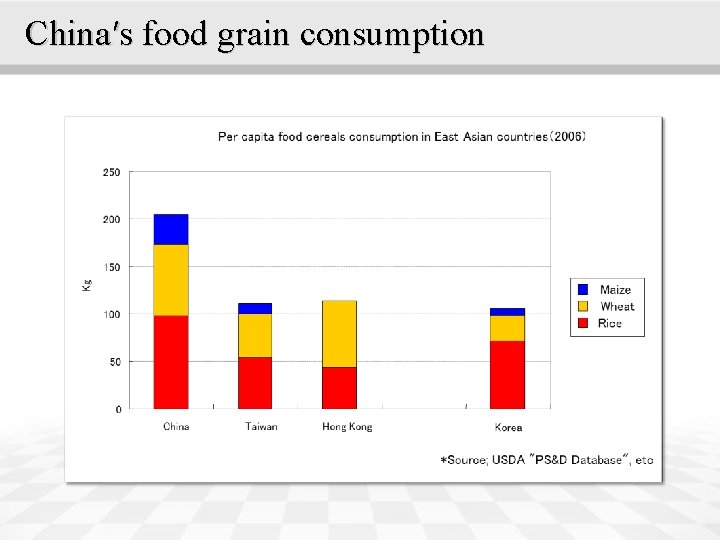
China′s food grain consumption
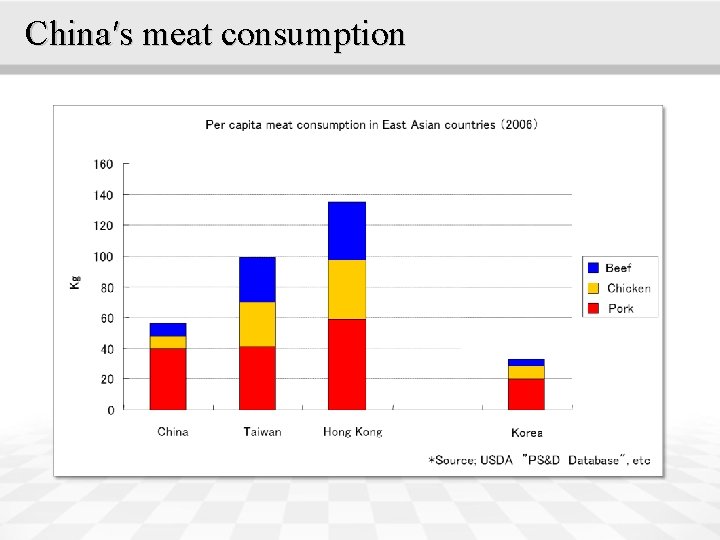
China′s meat consumption
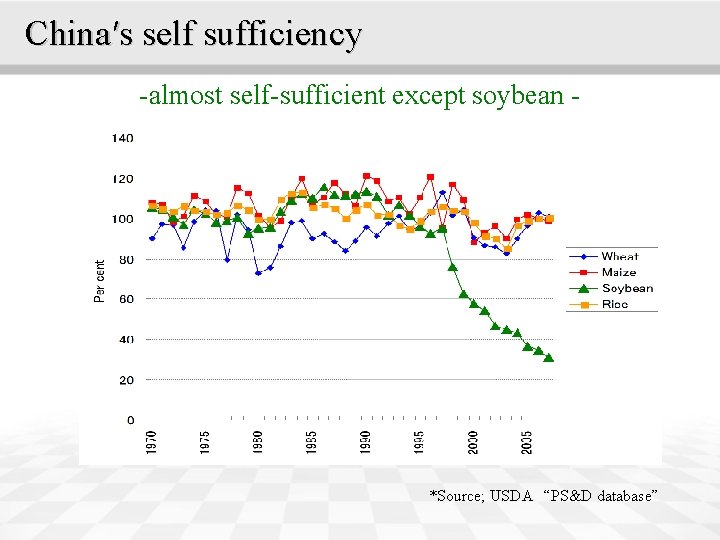
China′s self sufficiency -almost self-sufficient except soybean - *Source; USDA “PS&D database”
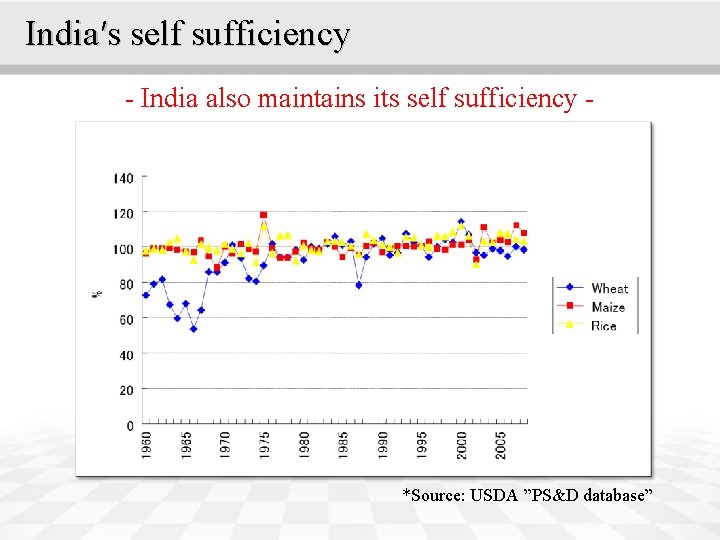
India′s self sufficiency - India also maintains its self sufficiency - *Source: USDA ”PS&D database”
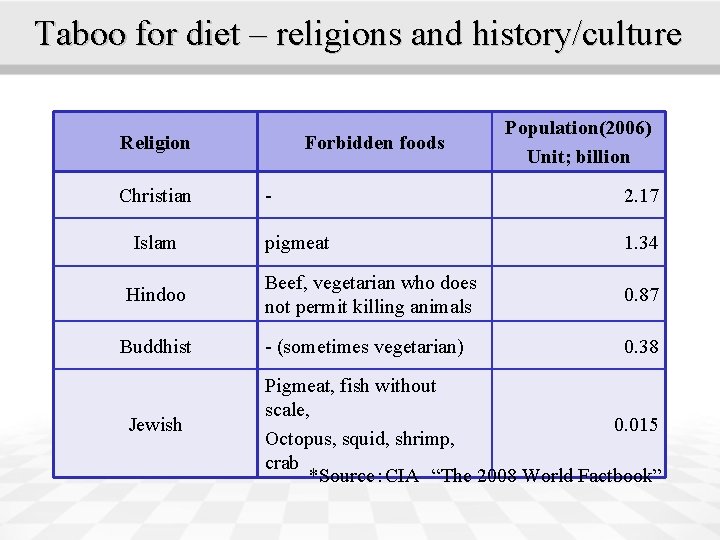
Taboo for diet – religions and history/culture Religion Christian Islam Hindoo Buddhist Jewish Forbidden foods Population(2006) Unit; billion - 2. 17 pigmeat 1. 34 Beef, vegetarian who does not permit killing animals 0. 87 - (sometimes vegetarian) 0. 38 Pigmeat, fish without scale, 0. 015 Octopus, squid, shrimp, crab *Source:CIA “The 2008 World Factbook”
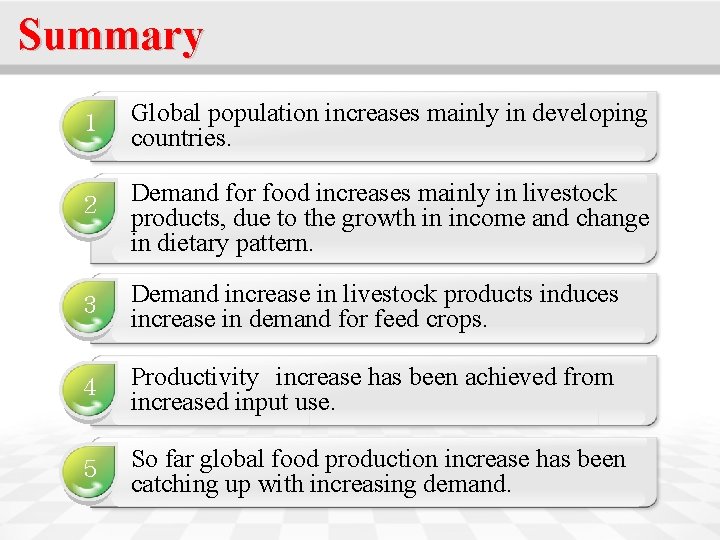
Summary 1 2 Global population increases mainly in developing countries. Demand for food increases mainly in livestock products, due to the growth in income and change in dietary pattern. 3 Demand increase in livestock products induces increase in demand for feed crops. 4 Productivity increase has been achieved from increased input use. 5 So far global food production increase has been catching up with increasing demand.
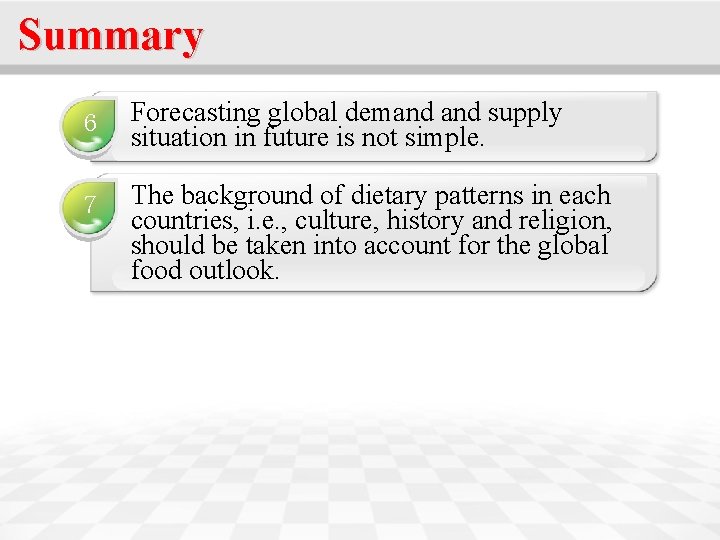
Summary 6 7 Forecasting global demand supply situation in future is not simple. The background of dietary patterns in each countries, i. e. , culture, history and religion, should be taken into account for the global food outlook.
Ⅱ. Background of recent hike of the world food prices (year 2006 -2008)
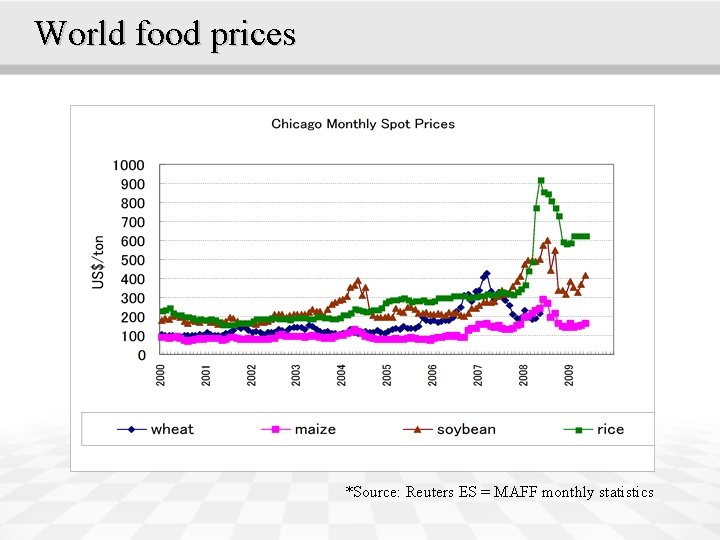
World food prices *Source: Reuters ES = MAFF monthly statistics
Why steep price hike in year 2006?
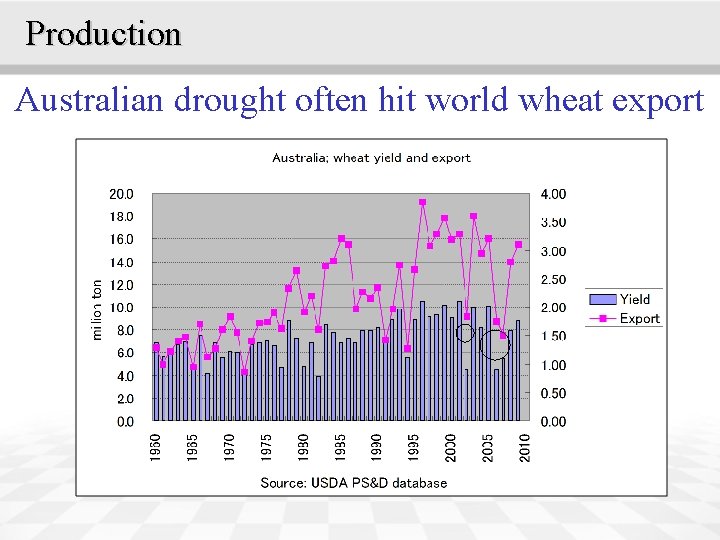
Production Australian drought often hit world wheat export
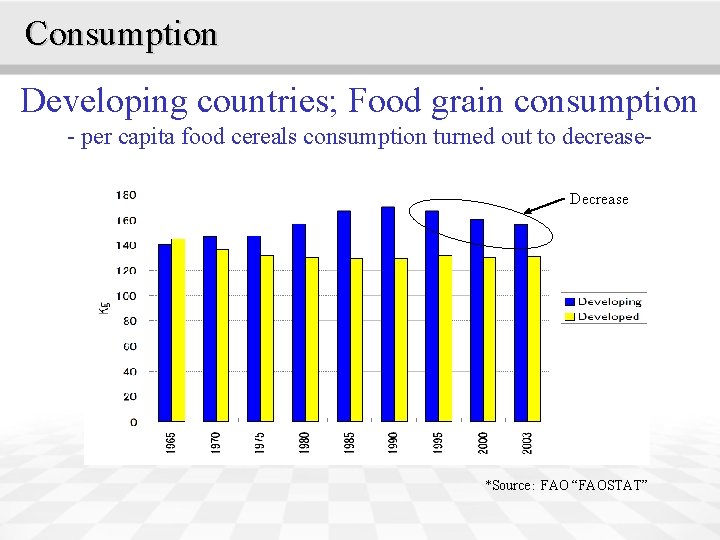
Consumption Developing countries; Food grain consumption - per capita food cereals consumption turned out to decrease. Decrease *Source: FAO “FAOSTAT”
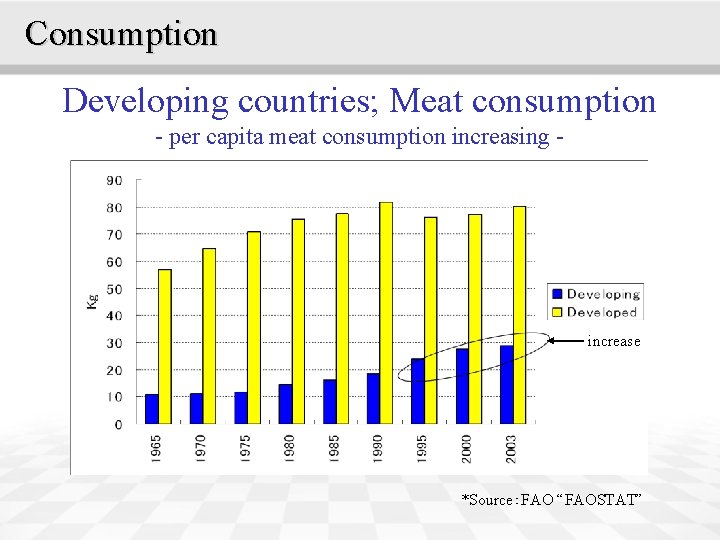
Consumption Developing countries; Meat consumption - per capita meat consumption increasing - increase *Source:FAO “FAOSTAT”
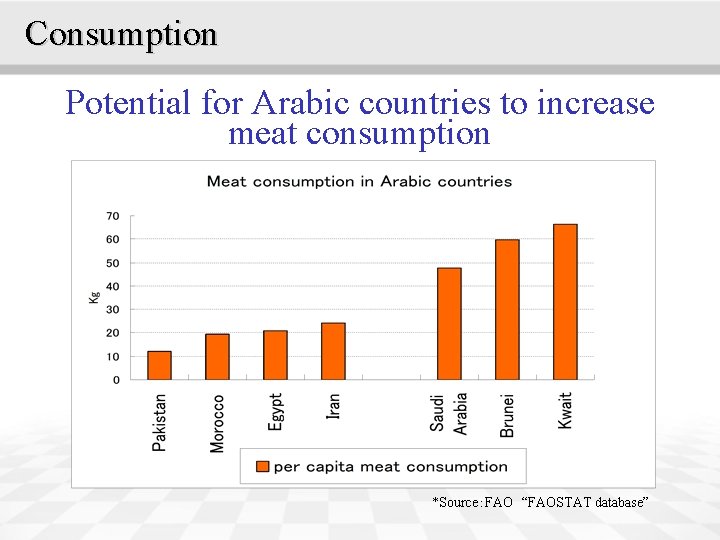
Consumption Potential for Arabic countries to increase meat consumption *Source:FAO “FAOSTAT database”
Biofuels Ø Solid, liquid or gaseous fuel obtained from relatively recently lifeless or living biological material and is different from fossil fuels, which are derived from long dead biological material. Ø Agrofuels are biofuels which are produced from specific crops.
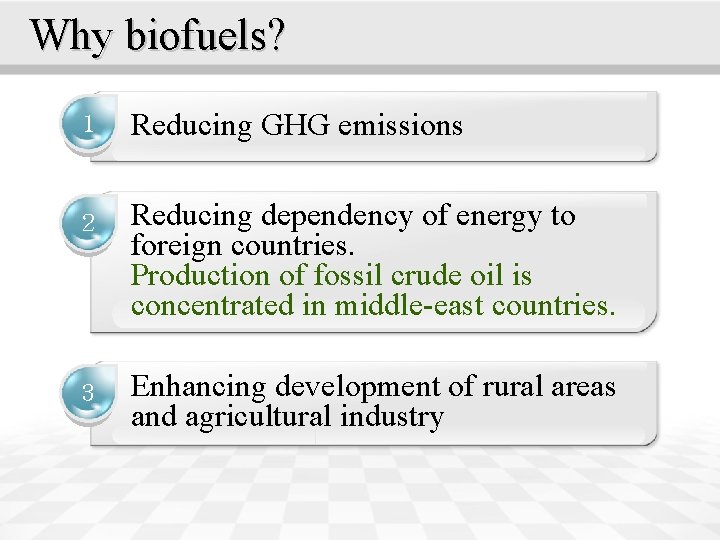
Why biofuels? 1 2 3 Reducing GHG emissions Reducing dependency of energy to foreign countries. Production of fossil crude oil is concentrated in middle-east countries. Enhancing development of rural areas and agricultural industry
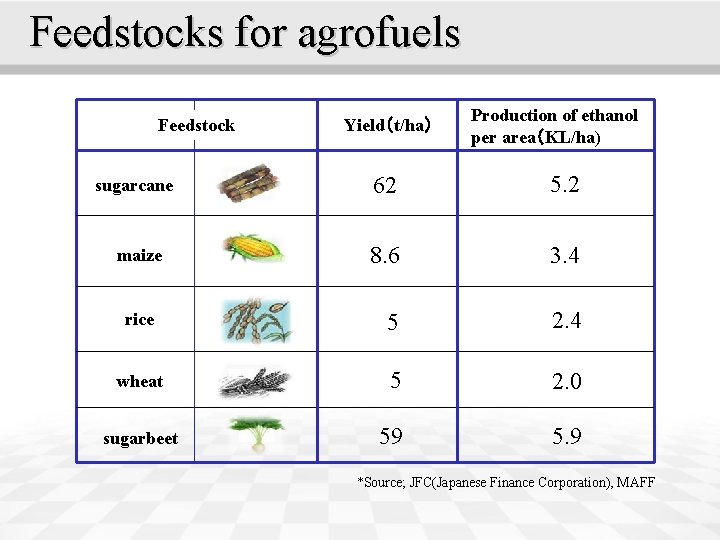
Feedstocks for agrofuels Feedstock Yield(t/ha) Production of ethanol per area(KL/ha) 62 5. 2 8. 6 3. 4 rice 5 2. 4 wheat 5 2. 0 59 5. 9 sugarcane maize sugarbeet *Source; JFC(Japanese Finance Corporation), MAFF
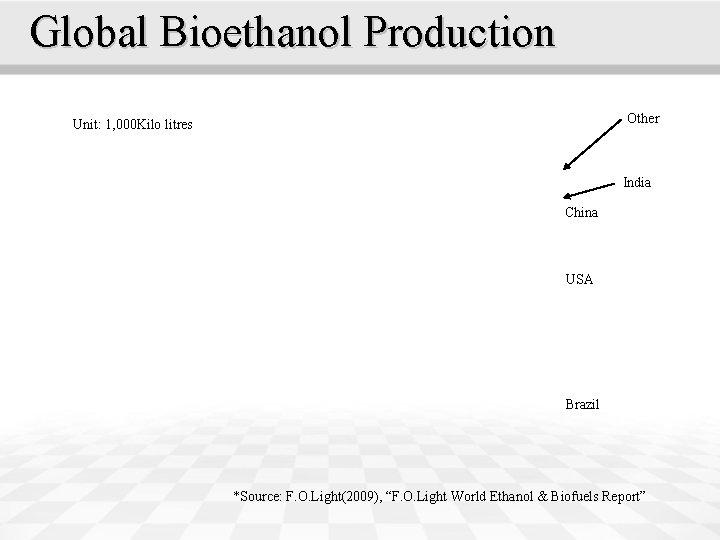
Global Bioethanol Production Other Unit: 1, 000 Kilo litres India China USA Brazil *Source: F. O. Light(2009), “F. O. Light World Ethanol & Biofuels Report”
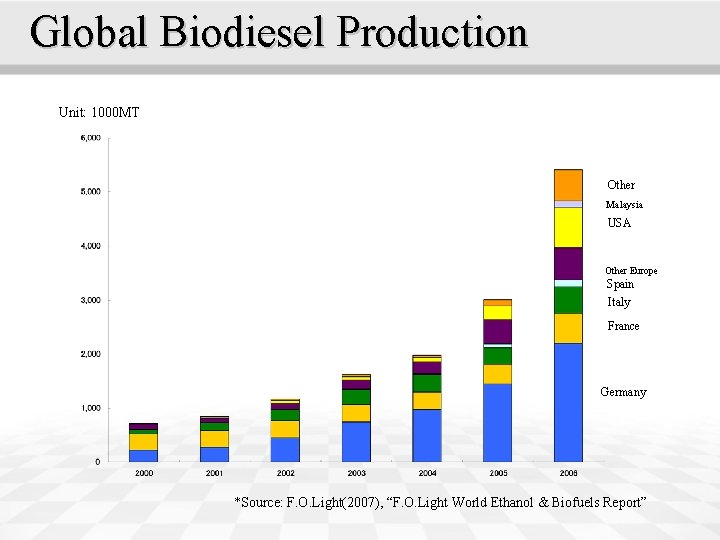
Global Biodiesel Production Unit: 1000 MT Other Malaysia USA Other Europe Spain Italy France Germany *Source: F. O. Light(2007), “F. O. Light World Ethanol & Biofuels Report”
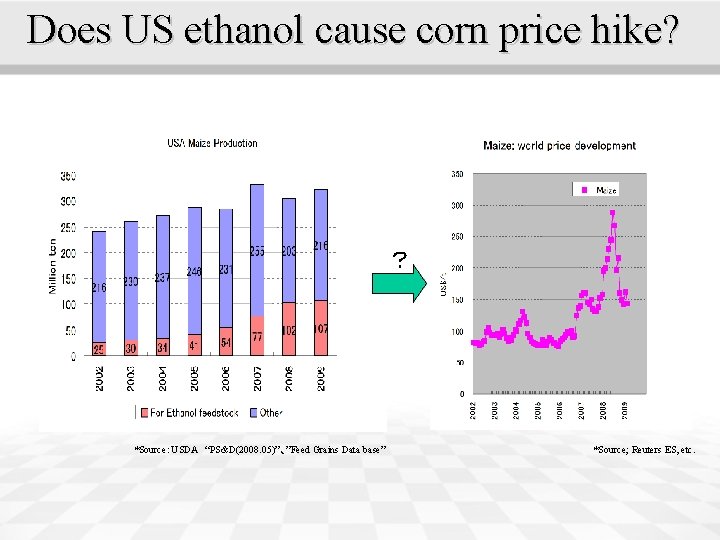
Does US ethanol cause corn price hike? ? *Source:USDA “PS&D(2008. 05)”、”Feed Grains Data base” *Source; Reuters ES, etc.
Speculative capital flow Ø Running money flow due to economic growth Ø Global turn over of oil money Ø Risk management; from dollar to Euro and other investment possibilities Ø Sub-prime loan bankruptcy; flight capital from US dollar to commodity markets such as crude oil and agricultural products
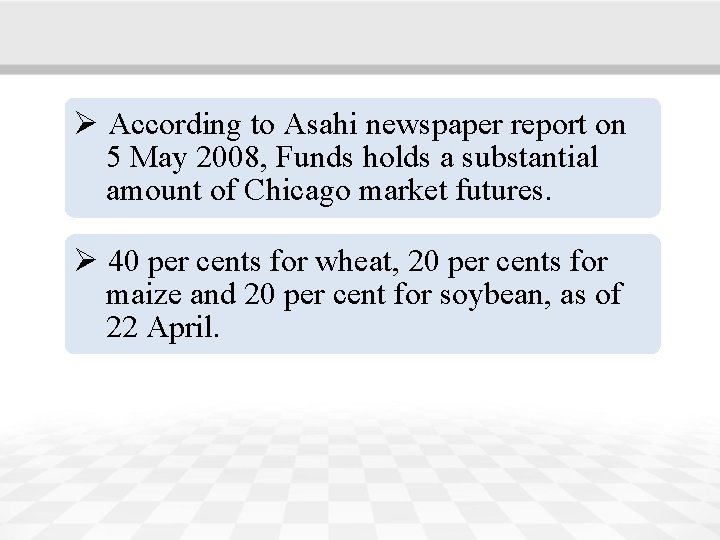
Ø According to Asahi newspaper report on 5 May 2008, Funds holds a substantial amount of Chicago market futures. Ø 40 per cents for wheat, 20 per cents for maize and 20 per cent for soybean, as of 22 April.
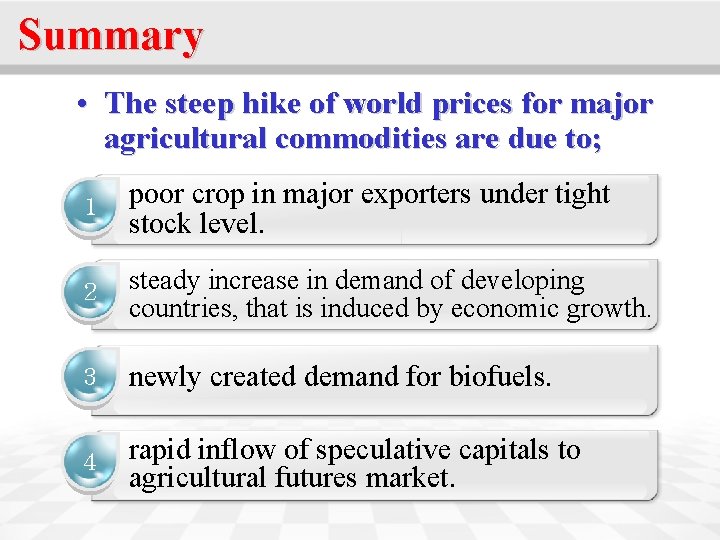
Summary • The steep hike of world prices for major agricultural commodities are due to; 1 poor crop in major exporters under tight stock level. 2 steady increase in demand of developing countries, that is induced by economic growth. 3 newly created demand for biofuels. 4 rapid inflow of speculative capitals to agricultural futures market.
Summary Ø However, after the “Lehman-shock”, in September 2008, speculative capitals quickly escaped from agricultural futures markets, which brought the steep decrease in the level of world market prices for agricultural commodities, mainly cereals and soybean.
Ⅲ. Outlook of global food market
OECD-FAO Agricultural Outlook Ø Since 1995, these Outlooks have been released every summer. Ø The Outlook shows medium term market prospects for coming 10 years. Ø Since 2005, FAO also took part in the Outlook, and developing countries were further disaggregated. Ø The latest one is “The OECD-FAO Agricultural Outlook 2009 -2018”, which was released on June 17, 2009.
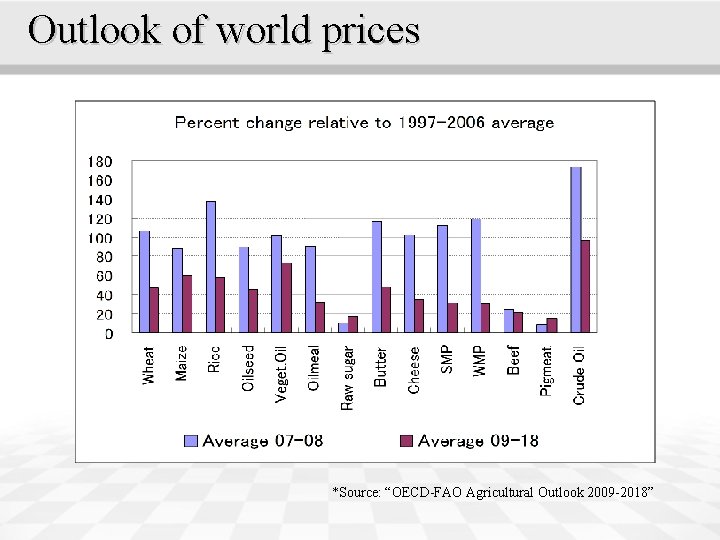
Outlook of world prices *Source: “OECD-FAO Agricultural Outlook 2009 -2018”
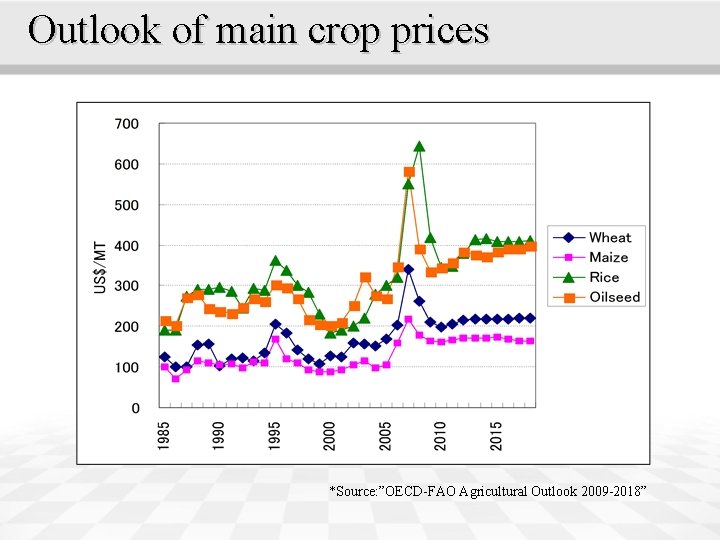
Outlook of main crop prices *Source: ”OECD-FAO Agricultural Outlook 2009 -2018”
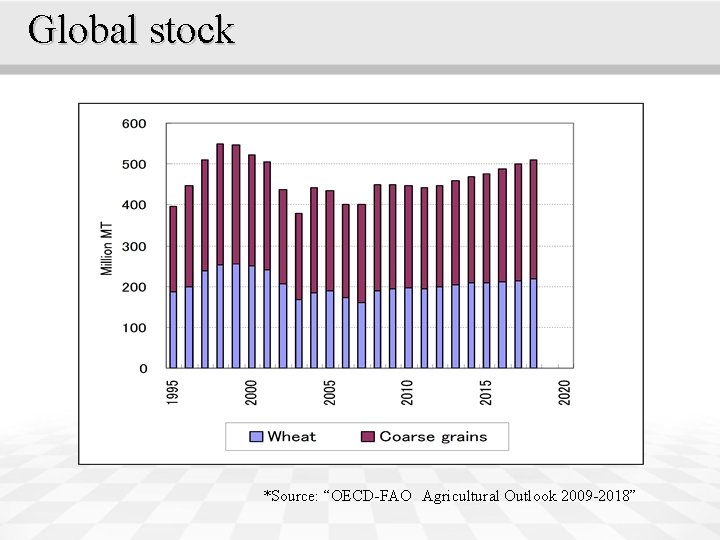
Global stock *Source: “OECD-FAO Agricultural Outlook 2009 -2018”
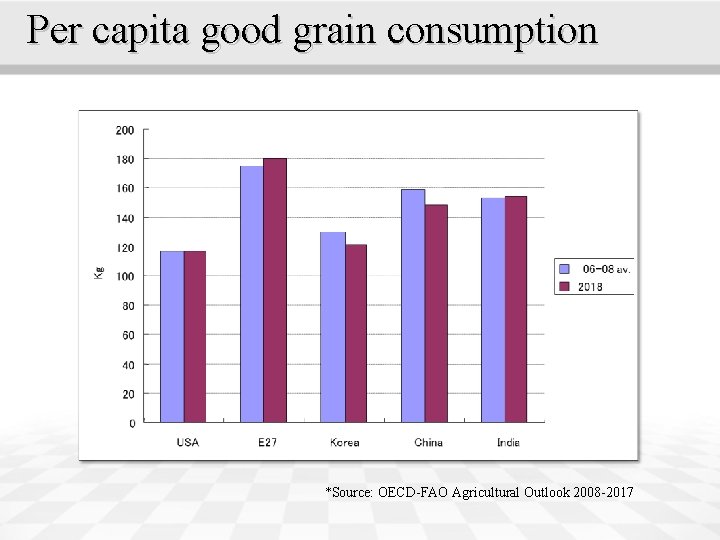
Per capita good grain consumption *Source: OECD-FAO Agricultural Outlook 2008 -2017
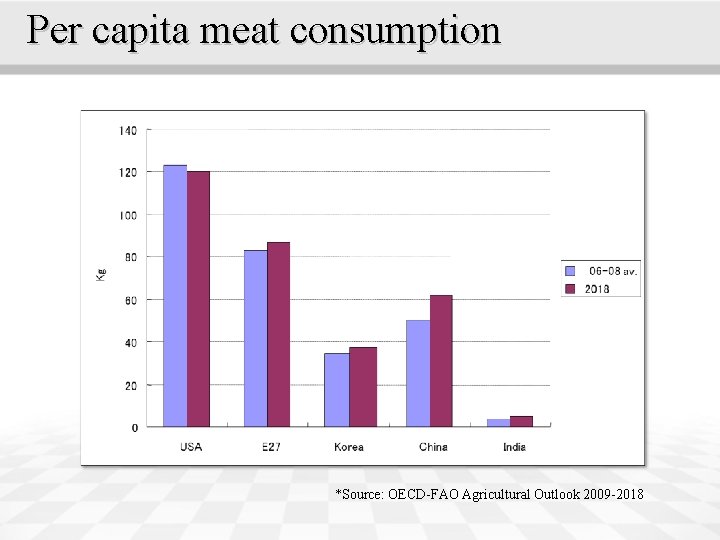
Per capita meat consumption *Source: OECD-FAO Agricultural Outlook 2009 -2018
Annual rice yield increase *Source: “OECD-FAO Agricultural Outlook 2008 -2017”
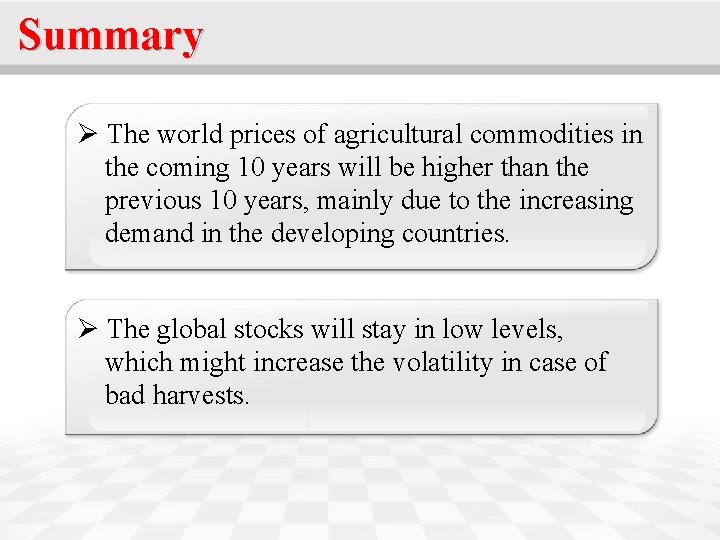
Summary Ø The world prices of agricultural commodities in the coming 10 years will be higher than the previous 10 years, mainly due to the increasing demand in the developing countries. Ø The global stocks will stay in low levels, which might increase the volatility in case of bad harvests.
Summary v Economic growth v Unexpected harvest swing due to weather change v Biofuels v Speculative capital flow v WTO negotiation

Conclusions; Issues for the Future
Challenges for the future Ø According to FAO, the number of the people under hunger of the world recently increased to 1. 02 billion in year 2009. Ø They are concentrated in Asia and Africa, less economically developed areas. Ø Food aid can mitigate the short-term crisis but it does not solve the fundamental problem.
Challenges for the future Ø In order to get out from the chronic hunger situation, the global community has to help those suffering countries in increasing their agricultural productivity. Ø Korea has to disseminate their experience of increasing agricultural productivity through financial and technological assistance to other less-favored Asian countries, for the purpose of sustainable food security of the region.

Thank you for your attention www. af. ac. kr
- Slides: 53