PROPORTIONAL SYMBOL MAPPING Cartographic Design for GIS Geog
 Prof. Hugh Howard American River")
PROPORTIONAL SYMBOL MAPPING Cartographic Design for GIS (Geog. 340) Prof. Hugh Howard American River College

PROPORTIONAL SYBMOL MAP DEFINED

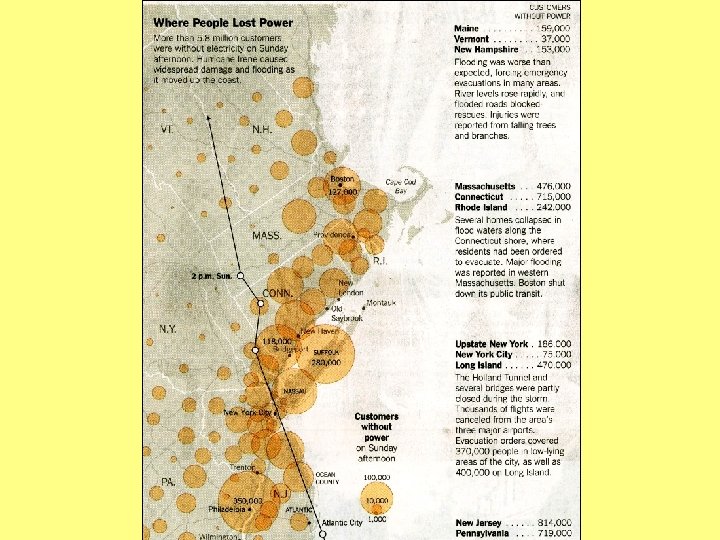
PROPORTIONAL DEFINED • Proportional Symbol Map – Map in which point symbols vary in size according to differences in magnitude of an attribute (variable)
 – The circle is most widely")
PROPORTIONAL DEFINED • Proportional Symbol Map (cont. ) – The circle is most widely used shape, but other shapes can be used
 – Quantitative in nature – Point")
PROPORTIONAL DEFINED • Proportional Symbol Map (cont. ) – Quantitative in nature – Point symbols are unlike those on a dot map, which have the same size and value Dot Map Legend Proportional Symbol Map Legends

PROPORTIONAL DEFINED • Confusing terminology… – Your textbook uses the term “Proportional” – Arc. Map uses “Proportional” or “Graduated, ” depending on the scaling method used • In Arc. Map – Proportional Symbols = Mathematical Scaling – Graduated Symbols = Range-Graded Scaling

APPROPRIATE DATA

TRUE vs. CONCEPTUAL DATA • True Point Data – Data collected at discrete points – Weather stations, seismometers, etc. The point location is known for each feature or phenomenon (x, y or lon, lat)

TRUE vs. CONCEPTUAL DATA • Conceptual Point Data – Data collected for enumeration units – Symbol is placed in the center of polygon The center can be the geometric center (centroid), or the visual center

TRUE vs. CONCEPTUAL DATA • The distinction is sometimes blurry – Enumeration units represented at small scales are treated as points Points are county centroids, but county boundaries are not shown

DATA STANDARDIZATION • Unstandardized, raw data are more commonly used – Standardization can be useful – Compensate for size of enumeration units (conceptual point data), etc.

DATA STANDARDIZATION • When standardizing conceptual point data, consider the choropleth instead – Choropleth maps excel at representing standardized areal data

MAP PROJECTIONS and the PROPORTIONAL SYMBOL MAP
 projections are most appropriate – Distortion of relative")
MAP PROJECTIONS • Equivalent (Equal Area) projections are most appropriate – Distortion of relative sizes of areas can mislead the map user Conformal Equivalent

SYMBOL SHAPES

SYMBOL SHAPES • • Various symbol shapes can be used Two categories of point symbol – Geometric – Pictographic Geometric Do not look like thing being mapped Pictographic Do look like thing being mapped

SYMBOL SHAPES • The circle is the most widely used – Compact and visually stable – Users prefer over other geometric symbols – Easy to construct and scale (PI r 2)

SYMBOL SHAPES • The square is a bit more awkward than the circle – Blocky nature isn’t as efficient with space – Area of a square can be more accurately estimated (L 2)

SYMBOL SHAPES • Pictographic symbols – Can be very effective – Should be closely related to theme – Complex symbols are potentially more difficult to interpret in congested areas

SYMBOL SHAPES • “ 3 D” Symbols – We aren’t good at estimating volumes – Employ 3 D symbols for aesthetic purposes, but don’t expect the map user to estimate volumes

SCALING METHODS

SCALING METHODS • There are three primary methods of scaling, or sizing, proportional symbols – Mathematical (Directly Proportional) – Perceptual – Range Graded

SCALING METHODS • Mathematical – The area of the point symbol is directly proportional to the data value 350 / 175 = 2 Area of the circle representing 350 is twice that of the circle representing 175
 – Equivalent to an unclassed choropleth – Legend")
SCALING METHODS • Mathematical (cont. ) – Equivalent to an unclassed choropleth – Legend shows representative values
 – Difficult to interpret, because the map user")
SCALING METHODS • Mathematical (cont. ) – Difficult to interpret, because the map user can only differentiate a given number of symbol sizes— 10 at most – Studies indicate that map readers tend to underestimate the areas of larger symbols

SCALING METHODS • Perceptual – Symbols are systematically enlarged toward the higher end of the range
 – Compensates for the map user’s tendency to")
SCALING METHODS • Perceptual (cont. ) – Compensates for the map user’s tendency to underestimate areas of larger symbols Perceptual scaling is not widely used today

SCALING METHODS • Range-Graded – Involves the organization of data values into classes, or ranges Values are classified much like a choropleth map
 – Ranges are associated with a limited number")
SCALING METHODS • Range-Graded (cont. ) – Ranges are associated with a limited number of easily differentiated symbols
 – Equivalent to a classed choropleth – Employs")
SCALING METHODS • Range-Graded (cont. ) – Equivalent to a classed choropleth – Employs a limited number of symbol sizes, allowing the map user to determine the general value using the legend
 – Map-design research has provided guidelines for selecting")
SCALING METHODS • Range-Graded (cont. ) – Map-design research has provided guidelines for selecting symbol sizes that are easily differentiated
 Possibly the best scaling method – Readers")
SCALING METHODS • • Range-Graded (cont. ) Possibly the best scaling method – Readers can easily discriminate symbol sizes and match them to legend symbols Range. Graded Mathematical Range graded provides greater contrast in circle sizes, but the result is more generalized
 Especially useful for pictographic symbols – It")
SCALING METHODS • • Range-Graded (cont. ) Especially useful for pictographic symbols – It is difficult to estimate areas of complex shapes • • Classification can be achieved using any data classification method Doesn’t work well if the map user fails to consult the legend

SYMBOL OVERLAP

SYMBOL OVERLAP • Trial-and-error is required to produce a map with suitable symbol overlap Neither “too full, ” nor “too empty”

SYMBOL OVERLAP • Symbols can be differentiated by applying contrast No contrast White outlines
 Black outlines")
SYMBOL OVERLAP • Symbols can be differentiated by applying contrast (cont. ) Black outlines Transparency with outlines…

REDUNDANT SYMBOLOGY

REDUNDANT SYMBOLOGY • The use of more than one visual variable to differentiate point symbols – To reinforce the idea of increasing magnitudes Quantitative Visual Variables

REDUNDANT SYMBOLOGY • In addition to varying sizes of symbols, lightness and hue can be incremented Lightness (Monochromatic Sequential) Hue-Lightness (Part-Spectral Sequential)

REDUNDANT SYMBOLOGY • • Lighter colors: lower values Darker colors: higher values

LEGEND DESIGN

LEGEND DESIGN • Representative symbols can be arranged in two fashions – Linear – Nested Linear-Legend Arrangement Nested-Legend Arrangement

LEGEND DESIGN • Linear-Legend Arrangement – Symbols placed adjacent to one another – Vertical or horizontal orientation More = Higher More logical ordering of ranges
 – Symbols placed adjacent to one another")
LEGEND DESIGN • Linear-Legend Arrangement (cont. ) – Symbols placed adjacent to one another – Vertical or horizontal orientation Values progress like on a number line Illogical ordering of ranges

LEGEND DESIGN • Nested-Legend Arrangement – Smaller symbols drawn within larger – Requires less available space than linear More logical ordering of ranges More = Higher Less logical ordering of ranges

LEGEND DESIGN • Placement of legend definitions Adjacent to Symbols Adjacent with Leader Lines Within Symbols

LEGEND DESIGN • • Which representative symbols should be included? Range-Graded Scaling – One for each class – Easy visual discrimination
 Mathematical or")
LEGEND DESIGN • • Which representative symbols should be included? (cont. ) Mathematical or Perceptual Scaling – Largest, smallest, and intermediate – Easy visual discrimination Alternatively, include symbols that are similar in size to the most common sizes on the mapped area

LEGEND DESIGN • Nested-legend used to differentiate between increase and decrease

LABELING PROPORTIONAL SYMBOLS

LABELING SYMBOLS • Proportional symbols should be labeled as ordinary point symbols – According to the guidelines presented in the Typography lecture Sequence of Preferred Locations

TIPS FOR LABELING AREAS

LABELING AREAS • Default labeling style
![LABELING AREAS • Convert to upper case UCase([STATE_NAME])](http://slidetodoc.com/presentation_image_h/9ec0b960592f94484c086975edd51c93/image-56.jpg "LABELING AREAS • Convert to upper case UCase([STATE_NAME])")
LABELING AREAS • Convert to upper case UCase([STATE_NAME])

LABELING AREAS • Exaggerate letter/word spacing
 (Water labels should be 100% Cyan)")
LABELING AREAS • Screen back (it’s base information) (Water labels should be 100% Cyan)

TIP FOR FILTERING LABELS

FILTERING LABELS • Use VBScript in label expression – To show only certain labels Function Find. Label ([CNTRYNAME]) if ([CNTRYNAME] = "France" OR [CNTRYNAME] = "Italy") then Find. Label = Ucase([CNTRYNAME]) end if End Function

FILTERING LABELS • Use VBScript in label expression – To hide certain labels Function Find. Label ([CNTRYNAME]) if ([CNTRYNAME] <> "France") then Find. Label = Ucase([CNTRYNAME]) end if End Function

TIPS FOR FILTERING FEATURES

FILTERING FEATURES • All cities

FILTERING FEATURES • Belgian cities

FILTERING FEATURES • Large Belgian cities

FILTERING FEATURES • Large Belgian and large Dutch cities
 Prof. Hugh Howard American River")
PROPORTIONAL SYMBOL MAPPING Cartographic Design for GIS (Geog. 340) Prof. Hugh Howard American River College
- Slides: 67