Properties of Interference and Noninterference Crossover Pathways in

 Assays Genetic Cytological chiasmata Recombination Nodules (RNs) MLH 1 foci")
")
 needs at least")
 needs at least")
 needs at least")
 needs at least")
 needs at least")
 100’s of DSBs 10’s")
 100’s of DSBs 10’s")


")
")


 procedure - Cherry Tomato microsporocytes collected at pachytene of")
 procedure - Cherry Tomato microsporocytes collected at pachytene of")

 procedure - Cherry Tomato microsporocytes collected at pachytene of")


 and MLH 1 - RNs")
 DSB")
 DSB recombination Intermediate")


 have no MLH")
 MUS 81 Complex. Class II COs MLH 1 -MLH")

 on the synaptonemal complex")
- Slides: 60
Properties of Interference and Non-interference Crossover Pathways in Tomato Lorinda Anderson Colorado State University Fort Collins, CO
Meiotic Crossover (CO) Assays Genetic Cytological chiasmata Recombination Nodules (RNs) MLH 1 foci
Meiosis: Structural Level Synaptonemal Complex Chromatin loops Lateral element Transverse filaments Recombination nodule (RN) RN = CO Central element
Crossing Over During Meiosis 1. Each pair of homologous chromosomes (bivalent) needs at least one crossover to assure proper segregation at anaphase I. Obligate crossover. maize
Crossing Over During Meiosis 1. Each pair of homologous chromosomes (bivalent) needs at least one crossover to assure proper segregation at anaphase I. 2. Crossovers are not distributed evenly on chromosomes. Chang et al. 2007 Genetics
Crossing Over During Meiosis 1. Each pair of homologous chromosomes (bivalent) needs at least one crossover to assure proper segregation at anaphase I. 2. Crossovers are not distributed evenly on chromosomes. Without Interference X X X X frequency 3. Crossovers display genetic interference (Sturtevant 1915; Muller 1916). The presence of one crossover reduces the likelihood of another crossover nearby. With Interference X X X frequency Distance between COs
Crossing Over During Meiosis 1. Each pair of homologous chromosomes (bivalent) needs at least one crossover to assure proper segregation at anaphase I. 2. Crossovers are not distributed evenly on chromosomes. Without Interference X X X X frequency 3. Crossovers display genetic interference (Sturtevant 1915; Muller 1916). The presence of one crossover reduces the likelihood of another crossover nearby. With Interference X X X frequency Distance between COs
Crossing Over During Meiosis 1. Each pair of homologous chromosomes (bivalent) needs at least one crossover to assure proper segregation at anaphase I. Mouse spermatocyte SCs = white MLH 1 = red 2. Crossovers are not distributed evenly on chromosomes. 3. Crossovers display genetic interference. The presence of one crossover reduces the likelihood of another crossover nearby. 4. There are several pathways for crossing over. In plants, animals, and yeast: - Major pathway = interfering Class I COs - MLH 1 - Minor pathways = non-interfering Class II COs - MUS 81 Tomato microsporocyte SCs = red MLH 1 = green
Meiosis – Molecular level Arabidopsis (Pradillo et al. , 2014) 100’s of DSBs 10’s of COs
Meiosis – Molecular level Arabidopsis (Pradillo et al. , 2014) 100’s of DSBs 10’s of COs Aberrant intermediates
Evidence for two types of COs in plants Double strand breaks MLH 1/MLH 3 Pathway 1 (80%) COs Interfering Produces the obligatory CO MUS 81 Pathway 2 (20%) COs Non-interfering 1. Mutants: - Arabidopsis mlh 3 mutants have residual crossovers (Jackson et al. 2006). - Arabidopsis mus 81 mutants have increased interference (Berchowitz et al. 2007)
Evidence for two types of COs in plants 2. Mathematical modeling: - Linkage maps in Arabidopsis (Copenhaver et al. Genetics 2002) - RN positions in maize (Falque et al. Plant Cell 2009) Modeling infers about 15% of COs in Maize are Class II No interference model Two-pathways model Density of pairs Maize chr. 10 Single-pathway model Distance between successive COs
Evidence for two types of COs in plants 3. Cytological observations: RN maps available for tomato (Sherman and Stack 1995). MLH 1 foci mapped and compared to RN map (Lhuissier et al. 2007). Average number of MLH 1 foci is lower than the average number of RNs. MLH 1 SC This comparison indicated that most, but not all, RNs are MLH 1 -positive in tomato. Other RNs = class II COs? kc kc
Evidence for two types of COs in plants 3. Cytological observations: Lhuissier et al. 2007 EM: Immunogold shows some RNs with MLH 1 and some RNs without MLH 1 Gold beads mark MLH 1 protein No gold beads on this RN
Evidence for two types of COs in plants Different approaches (mutants, mathematical modeling, cytology) are all consistent plants have two classes of COs with different characteristics. Remaining quantitative questions in wild-type organisms: - How are the two classes of crossovers (especially class II COs) specifically distributed along chromosomes? - Do the two CO classes interact with each other? If so, how does this affect interference relationships?
Evidence for two types of COs in plants Different approaches (mutants, mathematical modeling, cytology) are all consistent plants have two classes of COs with different characteristics. Remaining quantitative questions in wild-type organisms: - How are the two classes of crossovers (especially class II COs) specifically distributed along chromosomes? - Do the two CO classes interact with each other? If so, how does this affect interference relationships? Answering these questions requires mapping individual COs by class in the samples.
Approaches to studying different CO classes and how they interact: 1. Linkage mapping – cannot distinguish between the 2 types of COs. 2. Mutants – relative proportions (and distributions) can be different if one or the other pathway is missing. e. g. mus 81 -/- mice have increases in MLH 1 foci without a corresponding change in chiasma counts (Holloway et al. 2008). 3. Cytological – very labor-intensive, limited sample sizes, but still…
Cytological approach: 1. Lhuissier et al. 2007 compared numbers and distributions of MLH 1 foci (class I COs) with those of RNs (all COs), but on different samples from different labs. 2. To investigate interference between class I and class II COs, both types must be observed on the same SC samples.
Cytological approach: 1. Plan: Label with antibodies to MUS 81 and MLH 1 at the same time.
Cytological approach: 1. Plan: Label with antibodies to MUS 81 and MLH 1 at the same time. MUS 81
Cytological approach: 1. Plan: Label with antibodies to MUS 81 and MLH 1 at the same time. MUS 81 No correspondence between MUS 81 foci and RNs
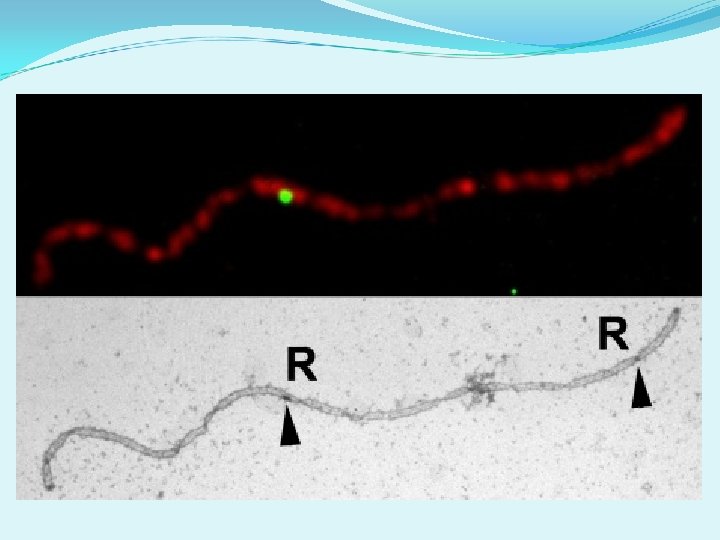
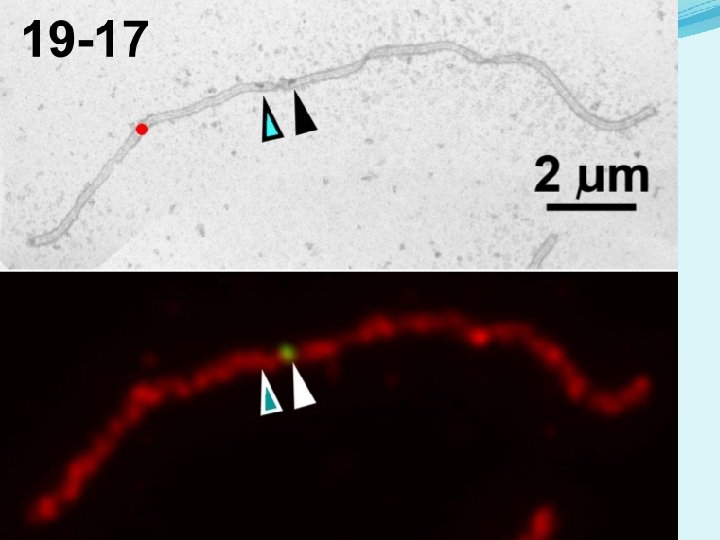
Cytological approach: MLH 1 immunolabeling to identify Class I COs and EM to identify all COs (RNs). Unlabeled RNs ~ Class II COs RN labeled with MLH 1 & 5 nm gold Immunogold: - Perfect for a few examples - Too laborious and expensive for quantitative analyses - Lack of sensitivity for weak foci
Cytological approach: MLH 1 immunolabeling to identify Class I COs and EM to identify all COs (RNs). Unlabeled RNs ~ Class II COs RN labeled with MLH 1 & 5 nm gold Immunogold: - Perfect for a few examples - Too laborious and expensive for quantitative analyses - Lack of sensitivity for weak foci We developed a new correlative approach that uses both immunofluorescence LM and EM. Faster, more sensitive MLH 1+ RNs = Class I All RNs
Correlative microscopy (LM to EM) procedure - Cherry Tomato microsporocytes collected at pachytene of Meiosis I, and SC spreads prepared on plastic-coated slides. - Fluorescent immunolabeling of SMC 1 (marks lateral element of SC in red) and MLH 1 (marks class I COs in green). - Imaging with fluorescence light microscopy (LM). SMC 1 MLH 1
Correlative microscopy (LM to EM) procedure - Cherry Tomato microsporocytes collected at pachytene of Meiosis I, and SC spread on plastic-coated slides. - Fluorescent immunolabeling of SMC 1 (marks lateral element of SC in red) and MLH 1 (marks class I COs in green). - Imaging with fluorescence light microscopy (LM). - Cover glass removed, and slides stained with phosphotungstic acid (PTA). - Phase contrast microscopy used to identify the correct SC spreads and place grids over them, then plastic lifted from the slides onto grids for EM. - Electron microscope (EM) imaging of the same SCs at 3, 000× magnification. Annotation of RNs and kinetochores (to identify SCs).
k = kinetochore R = recombination nodule k k k k twists k k RN CE LEs k
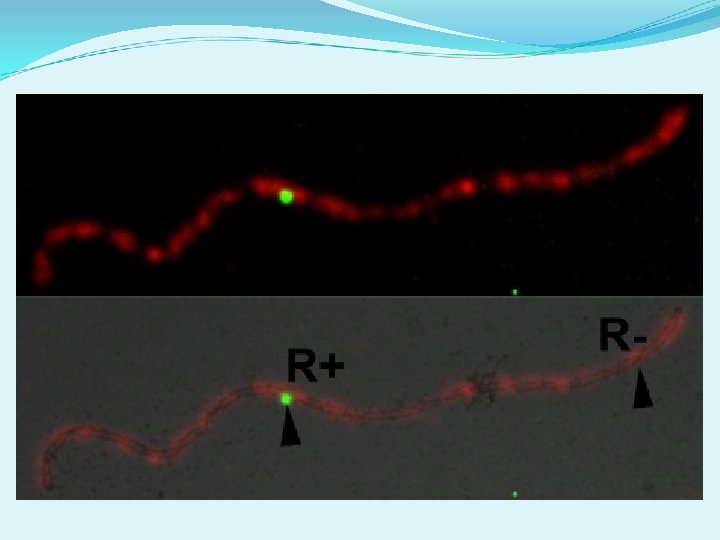
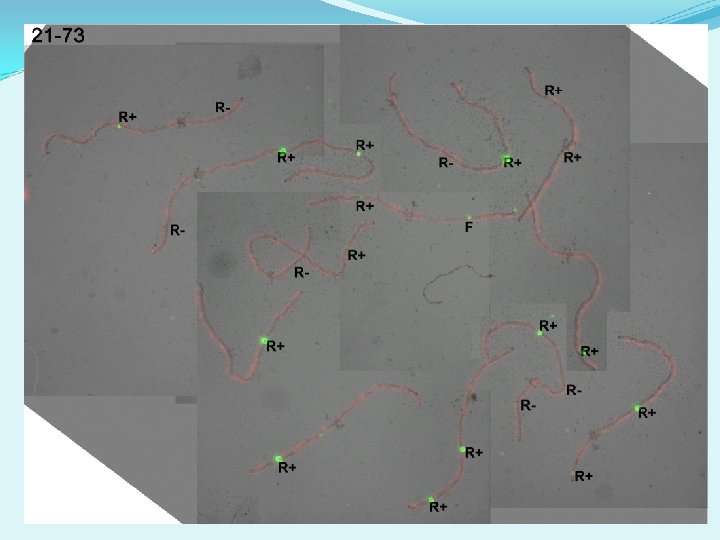
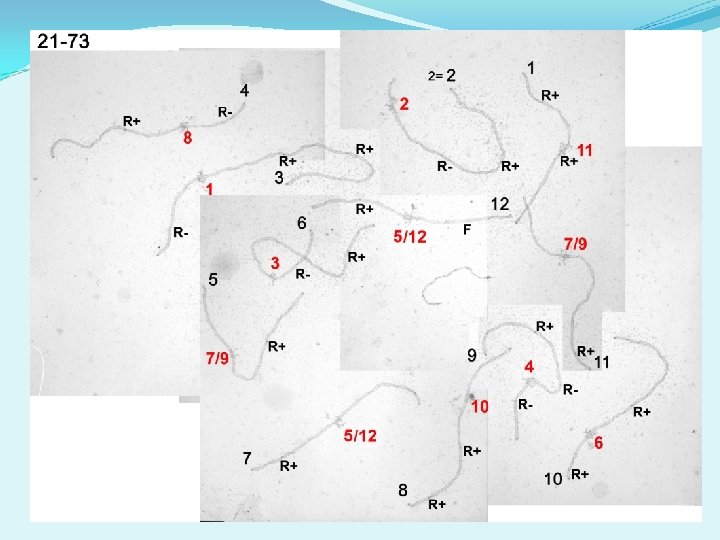
Correlative microscopy (LM to EM) procedure - Cherry Tomato microsporocytes collected at pachytene of Meiosis I, and SC spread on plastic-coated slides. - Fluorescent immunolabeling of SMC 1 (marks lateral element of SC in red) and MLH 1 (marks class I COs in green). - Imaging with fluorescence light microscopy (LM). - Cover glass removed, and slides stained with phosphotungstic acid (PTA). - Phase contrast microscopy used to identify the correct SC spreads and place grids over them then plastic lifted from the slides onto grids for EM. - Electron microscope (EM) imaging of the same SCs at 3, 000× magnification. Annotation of RNs and kinetochores (to identify SCs). - Fluorescent image layered over the EM image. - Each previously identified RN was assessed for MLH 1 fluorescent signal. - 2955 RNs from more than 1800 SCs were identified by class and mapped onto SCs that were identified by relative length and arm ratio
Proportions of MLH 1+ and MLH 1 - RNs N = 150 nuclei (complete sets of SCs) Average = 18. 8 RNs per nucleus 15. 3 MLH 1+ RNs (82%) 3. 5 MLH 1 - RNs (18%) ~ 75% of all SCs have no MLH 1 - RNs
MLH 1+ RNs and MLH 1 - RNs and Chiasmata Predict chiasma frequency from RNs: 1 RN = 1 CO = 1 chiasma 1 or more RNs per arm ~ 1 chiasma Ring = 2 Rod = 1
MLH 1+ and MLH 1 - RNs and Chiasmata Predict chiasma frequency from RNs: Chiasmata per nucleus 1 RN = 1 CO = 1 chiasma 1 or more RNs per arm ~ 1 chiasma Observed Ring = 2 Rod = 16. 0 Predicted All RNs = 16. 4 MLH 1+ = 14. 6
MLH 1+ and MLH 1 - RNs and Chiasmata Predict chiasma frequency from RNs: Chiasmata per nucleus 1 RN = 1 CO 1 or more RNs per arm = 1 chiasma Observed Ring = 2 Rod = 16. 0 Predicted All RNs = 16. 4 MLH 1+ = 14. 6 Confirms: MLH 1 - RNs = CO
Are there other differences between R+ and R-? 1 2 3 5 4 6
1 2 3 4 5 6
Size difference between MLH 1+ and MLH 1 - RNs RN Class No. Obs. Ave. Length (nm) Ave. Width (nm) MLH 1 + 669 157 ± 36 93 ± 24 MLH 1 - 140 127 ± 41 81 ± 23 p < 0. 001 t-test
Distribution of MLH 1+ and MLH 1 - RNs 158 SCs 332 RNs 2. 1 RNs / SC 1. 7 MLH 1+ 0. 4 MLH 1 - (tot SC length=31 µm)
The shapes of the distributions for MLH 1+ and MLH 1 - RNs are significantly different for all chromosomes Kolmogorov-Smirnov test p < 0. 04
Distribution of MLH 1+ and MLH 1 - RNs 158 SCs 332 RNs 2. 1 RNs / SC 1. 7 MLH 1+ 0. 4 MLH 1~45% ~22% (tot SC length=31 µm)
For most tomato chromosomes: MLH 1 - RNs are disproportionately located in pericentromeric regions (heterochromatin) and in short arms. MLH 1+ RNs are disproportionately observed in long arms.
Distribution of MLH 1+ and MLH 1 - RNs ~60% ~10% MLH 1 - RNs are disproportionately located in pericentromeric regions and in short arms of acrocentric tomato chromosomes. Why is this important? fancm and rec. Q A/B mutants increase class II COs in Arabidopsis – (Crismani et al. 2012; Seguela-Arnaud et al. 2015) Plant breeding applications: It may be possible to specifically increase CO in low recombination regions to mobilize genes present around the centromere.
Metacentric chromosomes differ from acrocentric chromosomes. Less difference between MLH 1+ and MLH 1 - distributions.
What could explain differences in arm preferences? Short Arm Long Arm Synaptic patterns: Which arm synapses first? Ch 9 Ch 12 Chr. No. obs. Long arm synapsed first Expected Observed ratio (L/S) 9 31 77% 1. 8 3. 4 10 124 80% 2. 1 4. 0* 12 54 56% 1. 05 1. 25
What could explain differences in arm preferences? Short Arm Long Arm Ch 9 Ch 12 Long arms synapse first – higher frequency of MLH 1+ RNs Short arms synapse later – higher frequency of MLH 1 - RNs Heterochromatin synapses last – higher frequency of MLH 1 - RNs
Interference: Numbers of MLH 1+ and MLH 1 - RNs per nucleus Observed and expected (if no interference) frequencies of MLH 1+ and MLH 1 - RNs per SC set Number of RNs per nucleus
Interference: Interference Using distance between COs to evaluate interference MLH 1 -negative RNs MLH 1 -positive RNs (Gamma model) The parameter nu is a quantitative measurement of interference strength nu > 1 Significant positive interference nu = 1 No significant interference [nu-Inf ; nu-Sup] : 95% confidence interval
Interference: Interference Among pairs of MLH 1+ RNs Density of inter-CO distances Same data shuffled to remove interference effects Interference due to MLH 1+ / MLH 1+ interactions Inhibition up to about 13 µm
Interference due to MLH 1+ / MLH 1 - interactions Inhibition up to about 8 µm Density of inter-CO distances Interference: Interference due to MLH 1+ / MLH 1+ interactions Inhibition up to about 13 µm
Summary In wild-type tomato, MLH 1+ (class I COs) and MLH 1 - RNs (class II COs) differ in: 1. Numbers: MLH 1 -dependent COs represent about 82% of all COs. 2. Size: MLH 1 -positive RNs are larger than MLH 1 - RNs. Protein composition. 3. Distribution: Class I COs are disproportionately located in long arms while Class II COs are disproportionately located in pericentromeric regions (heterochromatin) and in short arms. a. Associated with patterns of synapsis b. Possible importance to plant breeding: fancm and rec. Q A/B mutants increase class II COs in Arabidopsis 4. Interference: a. Class I COs interfere with each other (up to ~13 µm SC). b. Class II COs do not interfere between themselves. c. Class I COs and class II COs interfere but less strongly (up to ~8 µm SC).
Long arm/Short arm differences centromeres “Shotgun” model for crossing over Protein complex (EN) DSB recombination Intermediate CO Inactivated recomb. Intermed. - NCO RN MLH 1+ CO (I) MLH 1 - CO (II) Short arm Long arm
Heterochromatin difference centromeres “Shotgun” model for crossing over Protein complex (EN) DSB recombination Intermediate CO Inactivated recomb. Intermed. - NCO Aberrant recomb. Intermed. RNs MLH 1+ CO (I) MLH 1 - CO (II) Short arm Long arm
Thank you for your attention… Funding : Dept of Biology, Colorado State University Fort Collins, CO Lorinda K. Anderson Leslie D. Lohmiller Xiaomin Tang D. Boyd Hammond Lauren Javernick Lindsay Shearer Stephen Stack Quantitative Genetics and Evolution – Le Moulon Gif-sur-Yvette, France Sayantani Basu-Roy Matthieu Falque Olivier Martin
MLH 1 -negative RNs represent class II COs For SCs with only two RNs: Distribution of MLH 1+ and MLH 1 - RNs differs from distribution of two MLH 1+ RNs
MLH 1 -negative RN MLH 1 -positive RN Most SCs (75%) have no MLH 1 - RNs. MLH 1 focus size variability is not related to RN size.
Zakharyevich et al. 2012 (yeast) MUS 81 Complex. Class II COs MLH 1 -MLH 3 Complex MLH 1 Class I COs FANCM
LM to EM SMC 1 MLH 1
Meiosis: Structural Level Synaptonemal Complex Lateral element Recombination nodule (RN) on the synaptonemal complex (SC) RN = CO