Properties and Changes of Matter Property Anything about


Properties and Changes of Matter

Property • Anything about matter that helps to identify it.

Properties of Matter • Intensive Properties: □ Independent of the amount of the matter that is present. • Density, boiling point, color, etc. • Extensive Properties: □ Dependent upon the amount of the matter present. • Mass, volume, energy, etc.

Properties of Matter • Physical Properties: □ Can be observed without changing a substance into another substance. • Boiling point, density, mass, volume, etc. • Chemical Properties: □ Can only be observed during a chemical reaction. If a chemical reaction occur a new substance is produced. • Flammability, corrosiveness, reactivity with acid, etc.

In your notebook, make a table, name and classify each property and give the definition NAME OF PROPERTY TYPE OF PROPERTY Intensive or extensive DEFINITION Brittleness Physical Intensive Tendency to crack or break

Physical Properties • Can be observed without changing the substance’s identity. • Characteristics: Can be intensive or extensive. • Can be observed without producing a new substance. • Can be used to identify matter

Chemical Properties • Properties that can only be observed if there is a chemical reaction. • A Chemical reaction occurs when a substance is changed into another substance.

Characteristics • They are observable when a NEW SUBSTANCE is produced. • Examples • Combustibility: ability to burn in the presence of oxygen • Flammability: ability to produce flames

• Formation of rust • Rust : oxide that metals form in their surface.

• How to distinguish between properties and changes? • DO NOW • OBSERVE THE SAMPLES ON THE TEACHER’S DESK AND DESCRIBE THEM WITH THE MOST DETAIL POSSIBLE, THEN OBSERVE THE EXPERIMENT AND RECORD THE CHANGES IN YOUR LOG.

Changes of Matter • Any change requires the input of energy • Physical Changes: □ Changes in matter that do not change the composition of a substance. • Changes of state, temperature, volume, etc. • Chemical Changes: □ Changes that result in new substances. • Combustion, oxidation, decomposition, etc.

What are indications that a chemical change had occurred? • Change in color, release of gas (bubbles), formation of a precipitate. • When a substance decomposes, a chemical change has occurred.

Recognizing Chemical Changes Ø How can you tell whether a chemical change has taken place? 1. Transfer of energy Energy may be given off in the form of heat or light 2. Change in color Substances may ‘brown’ Indicators

3. Precipitate A solid that settles out of a liquid mixture 4. Gas production Indicated by the formation of ‘gas bubbles’

Chemical Reactions In the course of a chemical reaction, the reacting substances are converted to new substances.

General Properties of Metals • Metals are good conductors of heat and electricity. • Metals are shiny - metallic luster. • Metals are ductile (can be stretched into thin wires). • Metals are malleable (can be pounded into thin sheets). • A chemical property of metal is its reaction with water which results in corrosion.

Vocabulary • • DENSITY LUSTER DUCTILITY MALLEABILITY HARDNESS INSULATOR BRITTLENESS • • INTENSIVE EXTENSIVE RUST ELASTICITY MELTING POINT FREEZING POINT BOILING POINT

Some definitions • Luster: shininess • Malleability: ability to change shape without breaking. Metals can be hammered into thin sheets without breaking. • Ductility: ability to be drawn into wires • Conductivity: ability to allow electricity to move through

Chemical Properties • Combustibility: ability to burn in the presence of oxygen • Tendency to corrode: capacity to form rust

Descriptions • John is two years old and is a sweet boy. • There is 200 ml of a blue liquid in the bottle.

Descriptions Qualitative Quantitative • Non numerical description • Numerical description

Directions 1. One person of the group will pick up an acorn, ruler, and a piece of string. Return to your group. 2. Using your observational skills and supplies given complete the list of qualitative and quantitative measurements. 3. Return the acorn to the beaker. 4. Once everybody return their acorn to the beaker each group will try to find theirs again.

Units of Measurement
 units;")
SI Units • There are two types of units: – fundamental (or base) units; – derived units. • There are 7 base units in the SI system.

SI Units • Système International d’Unités • Uses a different base unit for each quantity

Metric System Prefixes convert the base units into units that are appropriate for the item being measured.

Vocabulary review • Mass : amount of matter in an object. • It is measured with a balance. • Unit in the SI system: grams g • Weight: a measure of the pull that the gravity exerts over an object. • If we stay in the same planet (same gravity) is used to measure the mass.
3. – SI")
Volume • The units for volume are given by (units of length)3. – SI unit for volume is 1 m 3. • We usually use • 1 m. L = 1 cm 3. • Other volume units: – 1 L = 1 dm 3 = 1000 cm 3 = 1000 m. L.

Volume • The space that an object occupies. • Unit of volume in SI Liter = L • It can be measured with a graduate cylinder.

• Objective: How to do metric system conversions?

Ladder Method 1 2 3 KILO 1000 HECTO DEKA 100 Units 10 Units Meter s Liters Grams How do you use the “ladder” method? 1 st – Determine your starting point. 2 nd – Count the “jumps” to your ending point. 3 rd – Move the decimal the same number of jumps in the same direction. DECI 0. 1 Unit CENTI 0. 01 MILLI Unit 0. 001 Unit 4 km = _____ m Starting Ending Point How many jumps does it take? 4. __. __. = 4000 m 1 2 3

Conversion Practice Try these conversions using the ladder method. 1000 mg = _______ g _______ mm 1 L = _______ m. L 14 km = _______ m 109 g = _______ kg 160 cm = 250 m = _______ km Compare using <, >, or =. 56 cm 6 m 7 g 698 mg
 Kilogram _____")
Metric Conversion Challenge Write the correct abbreviation for each metric unit. 1) Kilogram _____ 4) Milliliter _____ 2) Meter _____ 5) Millimeter _____ 3) Gram _____ 6) Liter _____

• How to calculate the volume of a solid with regular shape?

Activity • Form groups of 4 and find the volume of a metal cube and the volume of a wooden block. • Try to be the most accurate you can. • Record your results in your notebook. • Tips : remember the units that we use in science!

• How to determine with how many numbers we express the result of a calculation done with actual measurements?

Uncertainty in Measurement
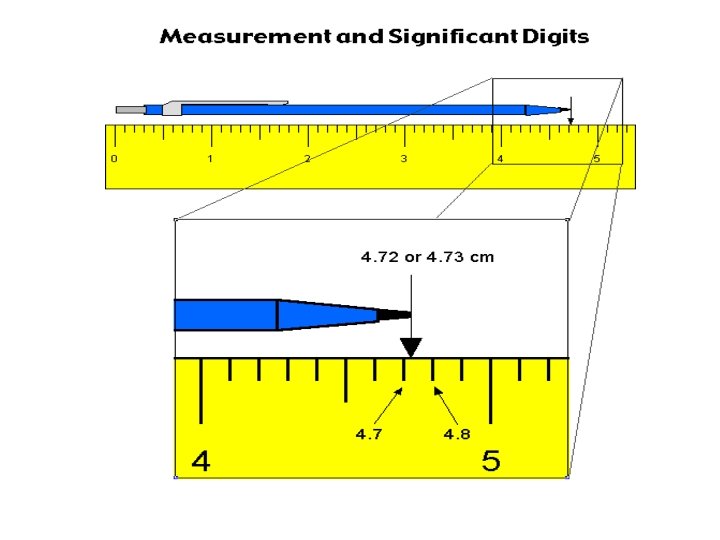

Significant Figures • The number of digits reported in a measurement reflect the accuracy of the measurement and the precision of the measuring device. • All the figures known with certainty plus one extra figure (estimated digit) are called significant figures.

Significant figures The number of figures that are certain in a measurement are limited by the smallest interval of the measuring device

Degree of certainty • Precision – reliability or reproducibility of a measurement • Accuracy – closeness to the known or accepted value

Significant Figures • The term significant figures refers to digits that were measured. • When rounding calculated numbers, we pay attention to significant figures so we do not overstate the accuracy of our answers.

Uncertainty in Measurement • All scientific measures are subject to error. • These errors are reflected in the number of figures reported for the measurement. Precision and Accuracy • Measurements that are close to the “correct” value are accurate. • Measurements that are close to each other are precise.

• ACCURACY DEALS • PRECISSION DEALS WITH THE EXACTESNESS OF THE MEASUREMENT, HOW CLOSE IT IS TO THE , TRUE, ACCEPTED OR STANDARD VALUE WITH REPRODUCIBILITY OF A MEASUREMENT. • IF SEVERAL MEASUREMENTS GIVE A SIMILAR RESULT IT IS SAID THAT THE MEASUREMENT IS PRECISE

Accuracy versus Precision • Accuracy refers to the proximity of a measurement to the true value of a quantity. • Precision refers to the proximity of several measurements to each other.

Significant Figures • The number of digits reported in a measurement reflect the accuracy of the measurement and the precision of the measuring device. • All the figures known with certainty plus one extra figure (estimated digit) are called significant figures. • In any calculation, the results are reported to the fewest significant figures (for multiplication and division) or fewest decimal places (addition and subtraction).

Significant Figures 1. All nonzero digits are significant. 2. Zeroes between two significant figures are themselves significant. 3. Zeroes at the beginning of a number are never significant. 4. Zeroes at the end of a number are significant if a decimal point is written in the number or if they are to the right of a decimal point.

0. 0030 has 2 sf 400. Has 3 sf 700. 00 has 5 sf

Examples: How many significant figures are in each of the following? 1. 52300 m 2. 0. 000487 kg 3. 29. 0400 s 4. 507 people 5. 230, 050 cm 6. 45. 600 A

• Objective : How do scientist calculate errors in measurement? • Do Now : go over hw questions on sig fig

Tell the number of significant digits in each of the following measurements. 1. 48 cm _____ 2. 306. 2 g _____ 3. 0. 329 m _____ 4. 83. 9520 °C _____ 5. 3700 mm _____ 6. 400. cm 3_____ 7. 71. 60 g _____ 8. 0. 00432 mm _____ 9. 10. 0 kg _____ 10. 3. 60 × 1015 sec _____ 11. 6. 24 × 10 -4 m _____ 12. 82. 000 g _____

Tell the number of significant digits in each of the following measurements. 1. 48 cm _____ 2. 306. 2 g _____ 3. 0. 329 m _____ 4. 83. 9520 °C _____ 5. 3700 mm _____ 6. 400. cm 3_____ 7. 71. 60 g _____ 8. 0. 00432 mm _____ 9. 10. 0 kg _____ 10. 3. 60 × 1015 sec _____ 11. 6. 24 × 10 -4 m _____ 12. 82. 000 g _____

• How do scientist express the accuracy of a measurement? • DO NOW : Observe the two instruments in my desk to measure volume, determine which would determine the volume of an Al cylinder with greater accuracy and explain in your notebook why.

Calculation with Significant Figures • When addition or subtraction is performed, answers are rounded to the least significant decimal place. • When multiplication or division is performed, answers are rounded to the number of digits that corresponds to the measurement with the least number of significant figures. © 2012 Pearson Education, Inc.

• Copy and perform the following operation indicating the right number of sig fig 12 1. 2 0. 2 -----------

5 x 100 = 0. 00022 x 745 = 3469/ 5799=
 3. 482 cm + 8. 51 cm + 16. 324 cm __________ 2)")
1) 3. 482 cm + 8. 51 cm + 16. 324 cm __________ 2) 48. 0032 g + 9. 17 g + 65. 4321 g __________ 3) 80. 4 cm - 16. 532 cm __________ 4) 106. 5 m. L - 30. m. L __________ 5) 48. 2 cm × 1. 6 cm × 2. 12 cm __________ 6) 8. 3 m × 4. 0 m × 0. 9823 m
 64. 34 cm 3 ÷ 8. 149 cm __________ 8) 4. 93 mm")
7) 64. 34 cm 3 ÷ 8. 149 cm __________ 8) 4. 93 mm 2 ÷ 18. 71 mm __________ 9) 0 57 m. L x 760 mm/740 mm x 273 K/250 K 10) 5 13 g x 44 962 amu/15 874 a m u

Percent Error • To determine the accuracy of a measurement. It tells us how far our measured stands from an accepted or known value. % error = I measured value – accepted value I X 100 ______________________ accepted value

Example • Calculate the percent error of the measurement for a student that determined that the density for Al is 2. 5 g/m. L. Hint use table T to determine the accepted value!

• 1. According to an accepted chemistry reference. the heat of vaporization of water is 540. calories per gram. A student determined in the laboratory that the heat of vaporization of water was 620. calories per gram. The student's results had a percent error of (1) 12. 9, (2) 80. 0, (3) 14. 8, (4) 87. 1 • 2. Which measurement contains a total of three significant figures? • (1) 0. 01 g (2) 0. 0100 g (3) 0. 010 g (4) 0. 01000 g

3. In an experiment the gram atomic mass of magnesium was determined to be 24. 7. Compared to the accepted value 24. 3, the percent error for this determination was (1) 0. 400, (2) 24. 7, (3) 1. 65, (4) 98. 4 4. A student determined the melting point of a substance to be 55. 2°C. If the accepted value is 50. 1°C the percent error in her determination is (1) 5. 10, (2) 10. 2, (3) 9. 24, (4) 12. 0 5. Using the rules for significant figures, the sum of 0. 027 gram and 0. 0023 gram should be expressed as (1) 0. 029 gram, (2) 0. 03 gram, (3) 0. 0293 gram, (4) 0. 030 gram
 0. 3010")
6. Which milligram quantity contains a total of four significant figures? (1) 0. 3010 mg (2) 3100 mg (2) 3010 mg (4) 30001 mg
 14. 8 % 2")
Answers to uncertainty in measurement worksheet • • 1 (3) 14. 8 % 2 (2) 0. 0100 g 3 (3) 1. 65 4 (2) 10. 2 5 (1) 0. 029 g 6 (1) 0. 3010 mg 7 (4) 8 (1) 1. 25 cm

Scientific Notation • Numbers written in scientific notation include a numeral with one digit before the decimal point, multiplied by some power of ten (6. 022 x 1023) • In scientific notation, all digits are significant. • You should be able to convert from non-scientific notation to scientific and vice-versa.

What is density? • Density is a comparison of how much matter there is in a certain amount of space.

What is density? • Density = mass volume or • mass ÷ volume. Units for density: g cm 3 • Why are these the units for density? . ALWAYS REMEMBER UNITS!

• Density is an intensive physical property and it is used to identify a sample. • All samples of the same material will have the same density. • Table S in your reference tables has the density for all the elements in the periodic table.

Which one is more dense? • Now which one is more dense?

Measuring Volume by water displacement

Let’s try a density problem together • A yellow rock has a mass of 8 g and a volume of 4 cm 3. What is its density? • Using table S determine what element could it be

Examples: 1. An object with a mass of 17. 95 g occupies a volume of 11. 8 m. L. What is its density? 2. A sample with a density of 3. 75 g cm-3 occupies a volume of 10. 44 cm 3. What is the mass of the sample? 3. A graduated cylinder is filled with 15. 0 cm 3 of water. An object with a mass of 29. 66 g causes the total volume to increase to 23. 4 m. L. What is the density of the sample?

Water density • 1 g/m. L or 1 g/cm 3 • That means that a gram of water has a volume of 1 m. L • 1 g=1 m. L • Only for water!

Liquid Layers • If you pour together liquids that don’t mix and have different densities, they will form liquid layers. • The liquid with the highest density will be on the bottom. • The liquid with the lowest density will be on the top.

Liquid Layers • . Which layer has the highest density? • Which layer has the lowest density? • Imagine that the liquids have the following densities: – 10 g/cm 3. 3 g/cm 3. – 6 g/cm 3. 5 g/cm 3. • Which number would go with which layer?

Liquid Layers – Try with your neighbor • Which liquid has the highest density? • Which liquid has the lowest density? • Which liquid has the middle density?

Review • What is the formula for density? • What happens if you pour together liquids that have different densities? • Will the liquid on the top have the highest or lowest density? • Will the liquid on the bottom have the highest or lowest density?

Do Now Liquid Layers – Try on your own! • Given the following densities: – 15 g/cm 3 – 3 g/cm 3 – 7 g/cm 3 10 g/cm 3 9 g/cm 3 12 g/cm 3 • Match the colors to the correct densities. 3 g/cm 3 7 g/cm 3 9 g/cm 3 10 g/cm 3 12 g/cm 3 15 g/cm 3

Density worksheet answers • • • 1=1 d= 0. 900 g/L 2=2 3=2 d=4. 50 g/cm 3 Ti 4=4 D of Mg 1. 738 g/cm 3 5=2 6=2 28 g
- Slides: 80