Project Time Management Schwalbe 2013 PMBOK 5 ed
, PMBOK 5 ed (2013). Nicholas & Styen (2012)")
Project Time Management Schwalbe (2013), PMBOK 5 ed (2013). Nicholas & Styen (2012)

What made the speedy completion possible? abundant resources: 150 people 14 months of planning, including many iterations of network analysis. On March 13, 1999, the Manukau (New Zealand) Chapter of Habitat for Humanity (the non-profit organization dedicated to eliminating poverty housing) set the new record for building a house: 3 hours and 45 minutes. a systematic computerized method

Project Time Management Monitoring & Controlling Processes Planning Processes Initiating Processes Enter phase/ Start project Closing Processes Exit phase/ End project Executing Processes Process Knowledge Area Time Initiating Planning Plan Schedule Activity Definition Activity Sequencing Activity Resource Estimating Activity Duration Estimating Schedule Development Executing Monitoring & Control Schedule Control Closing

Project Time Management Every system is constrained by policies, procedures, and standards; available materials, knowledge, and technology; and limited time, funding, and resources. Managers often cite delivering projects on time as one of their biggest challenges Time has the least amount of flexibility; it passes no matter what happens on a project Schedule issues are the main reason for conflicts on projects, especially during the second half of projects

Importance of Project Schedules The process required to manage completion of the project timely Project time management start with planning by the project management team (not shown as a discrete process) In small project, defining & sequencing activities, estimating activity resource & duration, developing schedule are viewed as a single process. 5

Project Time Process Planning schedule management involves determining the policies, procedures, and documentation that will be used for activites in project life scyle. Defining activities involves identifying the specific activities that the project team members and stakeholders must perform to produce the project deliverables e. g expected duration, cost, and resource requirements.

Project Time Process Sequencing activities involves identifying and documenting the relationships between project activities. The main outputs of this process include project schedule network diagrams and project documents updates.

Estimating activity resources involves estimating how many resources— people, equipment, and materials. The main outputs of this process are activity resource requirements, a resource breakdown structure, and project documents updates. Estimating activity durations involves estimating the number of work periods that are needed to complete individual activities. Outputs include activity duration estimates and project documents updates.

Developing the schedule involves analyzing activity sequences, activity resource estimates, and activity duration estimates. Controlling the schedule involves controlling and managing changes to the project schedule.
 Accuracy range Performance measure Plan Schedule Inputs")
Contingency Unit of measure (km, kg, etc) Accuracy range Performance measure Plan Schedule Inputs 1. Project Management plan 2. Project Charter 3. Enterprise environmental factors 4. Organizational process assets Tools & Techniques 1. Expert judgment 2. Analytical technique 3. Meetings Outputs 1. Schedule management plan
 Inputs 1. Schedule management plan")
Define Activities Work package decomposed into activities (schedule activities) Inputs 1. Schedule management plan 2. Scope baseline 3. Enterprise environmental factors 4. Organizational process assets Tools & Techniques 1. Decompositions 2. Rolling wave planning 3. Expert judgment Outputs 1. Activity list 2. Activity attributes 3. Milestone list In the real word sometime we skip define activities since we take WBS down to the activity level. This is not a wrong practice but not a PMBOK practice.
 Rolling Wave Planning: progressive elaboration planning where you do")
Define Activities (Tools & Techniques) Rolling Wave Planning: progressive elaboration planning where you do not to plan activities until you start the project management process for that phase is in the project life cycle Activity Attributes: Use for schedule development, selecting, ordering, sorting the planned Used to identify e. g. responsible activities apportioned effort (AE), Date schedule person, place, level of effort (LOE), Milestone: a significant point or event in the project. • Not a work activity • No duration • Checkpoint to help control the project • Additional milestone can be add in Sequence Activities & Develop Schedule process

Sequence Activities Process of identifying and documenting among the project activities Inputs 1. Schedule management plan 2. Activity list 3. Activity attributes 4. Milestone list 5. Project scope statement 6. Enterprise environmental factors 7. Organizational process assets Tools & Techniques 1. Precedence diagramming method (PDM) 2. Dependency determination 3. Applying leads and lags relationship Outputs 1. Project schedule network diagram 2. Project document updates
 or Activity-on-Node (AON) Method used in Critical No dummy activities")
Precedence Diagramming Method (PDM) or Activity-on-Node (AON) Method used in Critical No dummy activities Logical relationship: Path Methodology(CPM)

Start to start Finish to finish Finish to start Start to finish

Applying Leads & Lags • Use leads and lags to support realistic and achievable project schedule. • Each activity is connected at least to one predecessor and one successor except the start and the end. A B C predecessor Successor Leads. May be added to start an activity before complete. Lags Leads Inserted the predecessor activity is A Lags A waiting time between activities B B
 Example of PDM which showing logical relationship and leads or")
Precedence Diagramming Method (PDM) Example of PDM which showing logical relationship and leads or lags Other method to draw network diagram: Arrow Diagramming Method (ADM) GERT: allows loops between activities

Dependency Determination To define sequence among activity, these type of dependency are used: 1. 2. 3. Mandatory (hard logic) Inherent in the nature of work being done or required by the contract E. g. You must design Discretionary (preferred, preferential, or soft logic) Define base Can be changed if needed Important when how to shorten or re-sequence the project on knowledge External 4. before you can develop Based on the need t of the party outside the project Internal Based on the internal project team control You must determine dependencies in order to use critical path analysis

PDM ES = Early Start LS = Latest Start EF = Early Finish LF = Late Finish EF = ES + D -1 LS = LF – D +1 Float (F) = LS – ES = LF – EF

Estimate Activity Resources Process of estimating the type and quantities of material, people, equipment or supplies required to perform each activity. Inputs 1. Schedule management plan 2. Activity list 3. Activity attributes 4. Resource Calendars 5. Risk Register 6. Activity cost estimates 7. Enterprise environmental factors 8. Organizational Tools & Techniques 1. Expert judgment 2. Alternatives analysis 3. Published estimating data 4. Bottom-up estimating 5. Project management software Outputs 1. Activity resource requirements 2. Resource breakdown structure 3. Project document updates
 Resource Calendar: Information (skill, location, etc) in which")
Estimate Activity Resource (Tools & Techniques) Resource Calendar: Information (skill, location, etc) in which resource (people, equipment, material, etc) are potentially available. Published estimating data: Use company’s rates Bottom up estimating: Activity is decomposed to be more confidence in

Estimate Activity Durations Process of approximating the number of work periods to complete individual with estimated resources. Schedule shall be as believable and realistic as possible (do not allow activities padding) Inputs 1. Schedule Management plan 2. Activity list 3. Activity attributes 4. Activity resource requirements 5. Resource Calendars 6. Project scope statement 7. Risk Register 8. Resource breakdown structure Tools & Techniques 1. Expert judgment 2. Analogous estimating 3. Parametric estimating 4. Three-point estimates 5. Group decision making techniques 6. Reserve analysis Outputs 1. Activity duration estimates 2. Project document updates

Activity Duration Estimating Duration includes the actual amount of time worked on an activity plus elapsed time Effort is the number of workdays or work hours required to complete a task Effort does not normally equal duration! People doing the work should help create estimates, and an expert should review them 23
 Analogous Estimating (Top down): use actual duration of")
Estimate Activity Durations (Tools & Techniques) Analogous Estimating (Top down): use actual duration of previous activity (historical) that has similarity Parametric Estimating: use statistical relationship between historical data and other variables (e. g. learning curve) The result can become heuristics (experience based technique/rule of thumb) Reserve analysis (buffer): includes contingency reserves
 PERT is a network analysis technique used to")
Program Evaluation and Review Technique (PERT) PERT is a network analysis technique used to estimate project duration when there is a high degree of uncertainty about the individual activity duration estimates PERT uses probabilistic time estimates Duration estimates based on using optimistic, most likely, and pessimistic estimates of activity durations, or a three-point estimate 25
 Also called Program Evaluation and Review technique (PERT) Use for")
3 -Points Estimate (PERT) Also called Program Evaluation and Review technique (PERT) Use for time and cost estimation Expected calculated from Most-likely, Optimistic, Pessimistic Range of estimate = EAD (Expected Activity Duration) +/- SD (Standard Deviation) Expected Standard deviation cannot be sum. Standard Deviation Variance

PERT Formula and Example PERT weighted average = optimistic time + 4 X most likely time + pessimistic time 6 Example: PERT weighted average = 8 workdays + 4 X 10 workdays + 24 workdays 6 where optimistic time = 8 days = 12 days most likely time = 10 days, and pessimistic time = 24 days Therefore, you’d use 12 days on the network diagram instead of 10 when using PERT for the above example 27

Why Projects Are Often Late? Many project managers estimate project duration and cost by simply adding up most likely estimates of activity durations and costs; people procrastinate and waste available slack student’s syndroms Multitask contractor or vendor Another reason for overruns is human behavior. (tendering) stage of the project, champions and supporters do their best to “sell” the project Everyone is optimistic it also leads to underestimating project duration and cost.

6. 5 Develop Schedule Inputs 1. Schedule Management plan 2. Activity list 3. Activity attributes 4. Project schedule network diagram 5. Activity resource requirements 6. Resource Calendars 7. Activity duration estimates 8. Project scope statement 9. Risk Register 10. Project Staff asignment 11. Resource Breakdown structure Tools & Techniques 1. Schedule network analysis 2. Critical path method 3. Critical chain method 4. Resource optimization tehcniques 5. Modeling tehcniques 6. Applying leads and lags 7. Schedule compression 8. Scheduling tool Outputs 1. Project schedule 2. Schedule baseline 3. Schedule data 4. Project Calendar 5. Project Management Plan update 6. Project document updates

Gantt Charts Gantt charts provide a standard format for displaying project schedule information by listing project activities and their corresponding start and finish dates in a calendar format Symbols include: Black diamonds: milestones Thick black bars: summary tasks Lighter horizontal bars: durations of tasks Arrows: dependencies between tasks 30

Gantt Chart for Software Launch Project 31

Adding Milestones to Gantt Charts Many people like to focus on meeting milestones, especially for large projects Milestones emphasize important events or accomplishments on projects Normally create milestone by entering tasks with zero duration, or you can mark any task as a milestone 32 a
 CPM is a network diagramming technique used to predict total")
Critical Path Method (CPM) CPM is a network diagramming technique used to predict total project duration A critical path for a project is the series of activities that determines the earliest time by which the project can be completed The critical path is the longest path through the network diagram and has zero amount of slack or float Slack or float is the amount of time an activity may be delayed without delaying a succeeding activity or the project finish date There can be more than one critical path if the lengths of two or more paths are the same The critical path can change as the project progresses 33

Critical Path is the longest duration path • Identify the shortest time needed to complete a project There can be more than one critical path We don’t want critical path, it Don’t leave a project with a negative schedule increase risk float, you would compress the Near-critical path is the path that has close in duration to critical path Float (Slack) • Total float: the amount of time an activity can be delayed without delaying the project end date or intermediary milestone. • Free float: the amount of time an activity can be delayed without delaying the early start date of its successor(s).

Determining the Critical Path for Project X 35

Critical Path Method Basic K • Dummy activity = 0 resource & 0 duration • Critical activities - all activities in the critical path - Delay in the completion of these activities will lengthen the project timescale - Has float = 0 Activity Precedenc e Duratio n A 2 B 3 C A 1 D B 4 E B 2 F C 1 G D, F 5 H E 2 I H 2 J G, I, E 0

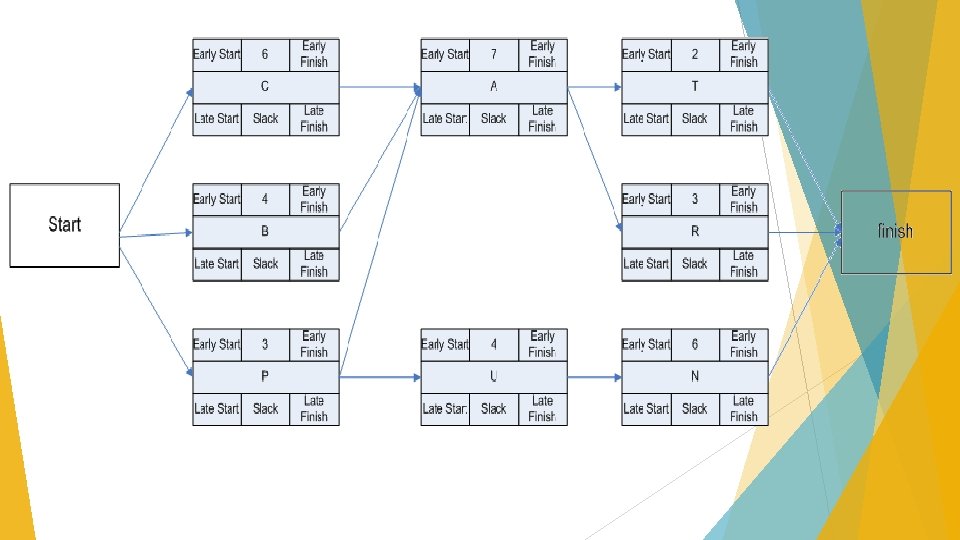
Critical Path using PDM Forward Pass Calculation • Forward Pass: ES + D = ES(successor) • use highest value on join • • Backward Pass: LS – D (predecessor) = LS (predecessor) • Use lowest value on join • Backward Pass

Exercise Questions: What is the critical path? What is critical path duration? What is float (slack) duration of activity A 30? Answers: • • • -

Critical Chain Scheduling Critical chain scheduling A method of scheduling that considers limited resources when creating a project schedule and includes buffers to protect the project completion date Uses the Theory of Constraints (TOC) A management philosophy developed by Eliyahu M. Goldratt and introduced in his book The Goal Attempts to minimize multitasking When a resource works on more time than one task at a 39

Multitasking Example 40

Buffers and Critical Chain A buffer is additional time to complete a task Murphy’s Law states that if something can go wrong, it will Parkinson’s Law states that work expands to fill the time allowed In traditional estimates, people often add a buffer to each task and use it if it’s needed or not Critical chain scheduling removes buffers from individual tasks and instead creates: Project buffers or additional time added before the project’s due date Feeding buffers or additional time added before tasks on the critical path 41

Example of Critical Chain Scheduling 42

Schedule Compression Fast Tracking Performing critical path activities in parallel. Usually increase risk and requires more attention communication. May need a rework. to E. g. Design is half finished and start coding. Crashing Analyze cost and schedule trade-offs. Determine most compression for least cost. Crash the tasks that cost the least first, focusing on minimizing project cost. Always results in increased cost.
 After fast tracking (total time 8)")
Fast track Before fast tracking (total time 10) After fast tracking (total time 8) Crashing
. or without dependencies (logical Presented as Summary")
Project Schedule can be shown with relationship). or without dependencies (logical Presented as Summary form e. g. Master Schedule, Milestone schedule Detailed form Format: Network diagram Milestone chart Bar chart (Gantt chart)

Schedule Data Includes at least: Schedule milestone Schedule activities Activity attributes Assumptions & Constraints Additional information can be added, such as Resource histograms Cash-flow projections Order & delivery schedules Alternative schedules

Control Schedule Inputs 1. Project Management Plan 2. Project Schedule 3. Work performance data 4. Project calendars 5. Schedule data 6. Organizational process assets Tools & Techniques 1. Performance reviews 2. Project Management Software 3. Resource optimization techniques 4. Modeling techniques 5. Adjusting leads & lags 6. Schedule compression 7. Schedule tooling Outputs 1. Work performance information 2. Schedule forecasts 3. Organizational process assets updates 4. Change requests 5. Project management plan updates 6. Project document updates

Schedule Control Suggestions Perform reality checks on schedules Allow for contingencies Don’t plan for everyone to work at 100% capacity all the time Hold progress meetings with stakeholders and be clear and honest in communicating schedule issues 48

Controlling the Schedule Goals are to know the status of the schedule, influence factors that cause schedule changes, determine that the schedule has changed, and manage changes when they occur Tools and techniques include: Progress reports A schedule change control system Project management software, including schedule comparison charts like the tracking Gantt chart Variance analysis, such as analyzing float or slack Performance management, such as earned value (Chapter 7) 49

Reality Checks on Scheduling First review the draft schedule or estimated completion date in the project charter Prepare a more team detailed schedule with the project Make sure the schedule is realistic and followed Alert top management well in advance if there are schedule problems 50

Two Methods to Calculate the Forward and Backward Passes in a Network Diagram Zero Method assumption: All starts and ends are at the end of a time period. One Method assumption: All starts are at the beginning of a time period, and all finishes are at the end of a time period.

Contoh Soal!

ES D EF ES TF EF B A LS D LF LS TF LF
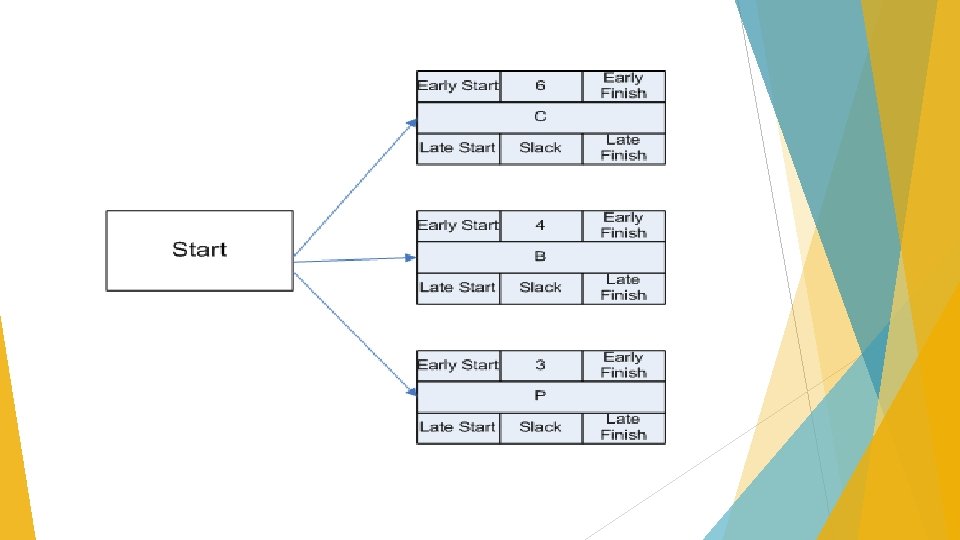

Forward Pass EF= ES + D - 1
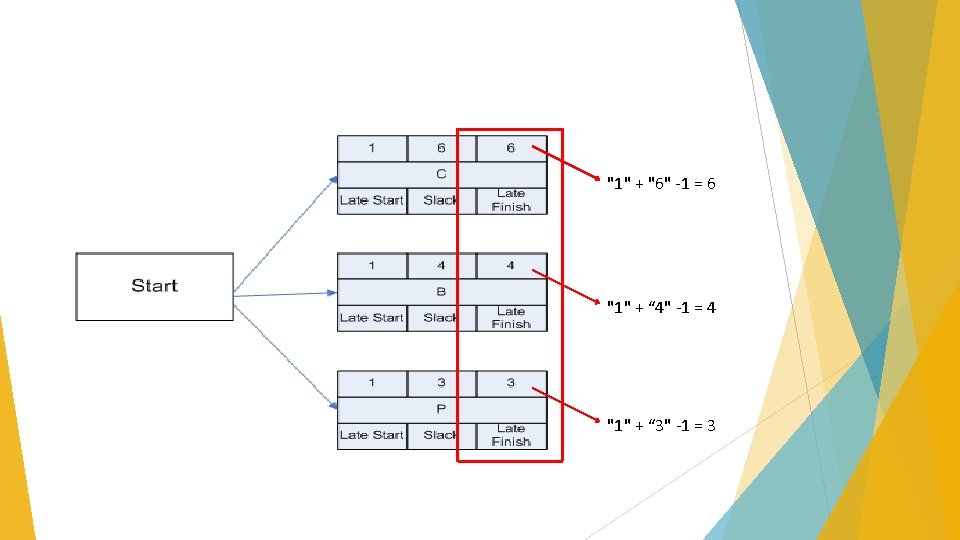

Ambil yang terbesar lalu ambahkan “ 1” 6 “ 7" + “ 7" -1 =13 4 3 “ 4" + “ 4" -1 =7
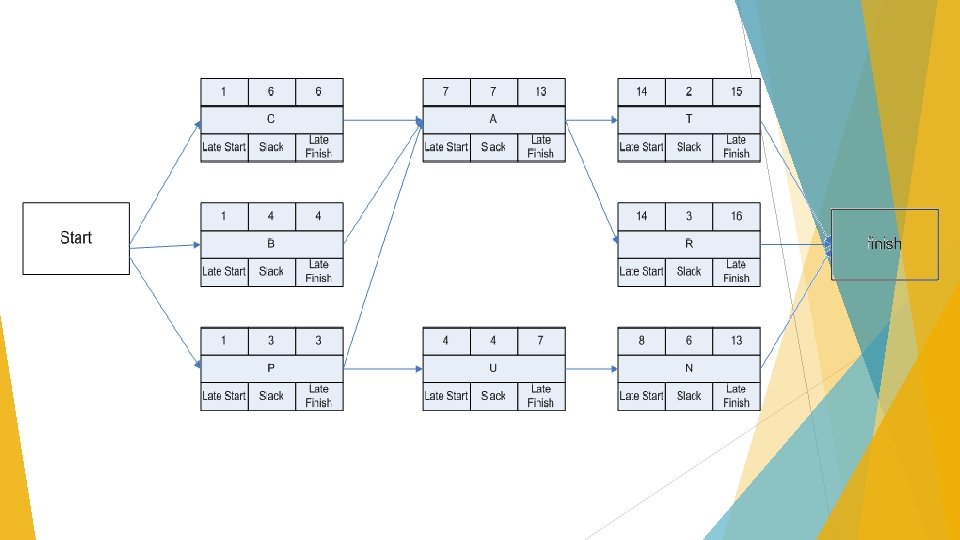

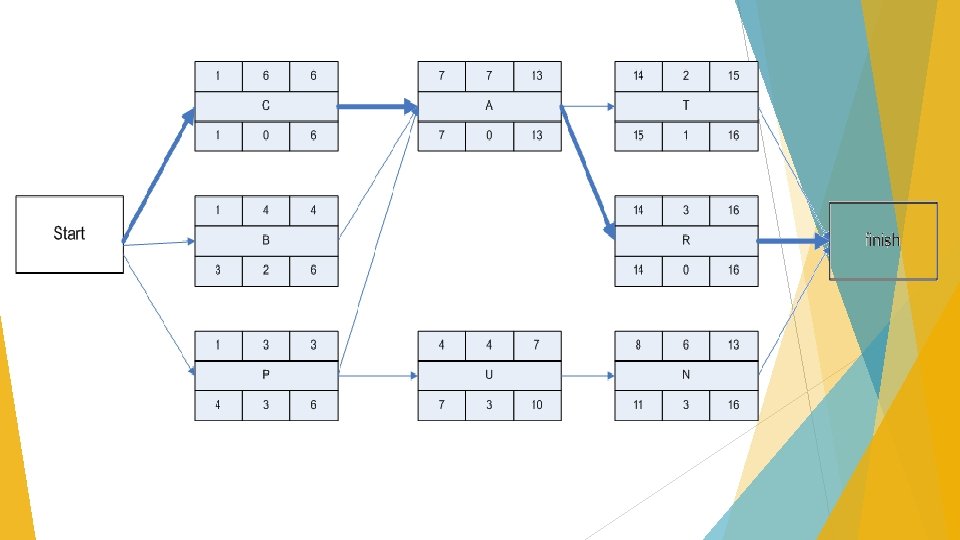
“ 16" - “ 2" +1 = 15 “ 16" – “ 3" +1 = 14 “ 16" – “ 6" +1 = 11 Backward Pass LS= LF - D + 1
 15 “ 13\"")
Ambil yang terkecil lalu kurangi “ 1” (14 -1= “ 13”) 15 “ 13" – “ 7” +1 = 7 14

Apa bedanya? You are using the Zero Method if: The finish is the same number as the start of the next activity on your critical path. You are using the One Method if: You increased the finish number by one to calculate the start of the next activity on your critical path.
- Slides: 63