Project Scheduling GanttPert Charts What is a Project

 sequence of unique, complex, and")
 sequence of unique, complex, and")


 - Arrows represent activities while nodes stand")


 can take a variety")


![Critical Path and Time Notation: [Task name, expected time, variance]](https://slidetodoc.com/presentation_image_h/b614b93c05179291557668a5eb269242/image-29.jpg "Critical Path and Time Notation: [Task name, expected time, variance]")


- Slides: 48
Project Scheduling: Gantt/Pert Charts
What is a Project? A project is a (temporary) sequence of unique, complex, and connected activities that have one goal or purpose and that must be completed by a specific time within budget, and according to specification.
What is a Project? A project is a (temporary) sequence of unique, complex, and connected activities that have one goal or purpose and that must be completed by a specific time within budget, and according to specification.
Scheduling • A schedule is the conversion of a project action plan into an operating timetable • It serves as the basis for monitoring and controlling project activity – work changes daily, so this is essential • With the plan and budget, it is the major tool for the management of projects – most scheduling is at the WBS level (tasks), not the work package level – only the most critical work packages may be shown on schedule
Network Scheduling Techniques • PERT was developed in 1958 for the Polaris missile/submarine project • The Critical Path Method (CPM) was developed by Du. Pont during the same time period • Initially, CPM and PERT were two different approaches – CPM used deterministic time estimates and allowed project crunching – PERT used probabilistic time estimates • Microsoft Project (and others) have blended CPM and PERT into one approach
Terminology • Activity - A specific task or set of tasks that are required by the project, use up resources, and take time to complete • Event - The result of completing one or more activities. An identifiable end state occurring at a particular time. Events use no resources. • Network - The combination of all activities and events that define a project – Drawn left-to-right – Connections represent predecessors
Terminology Continued • Path - A series of connected activities • Critical - An activity, event, or path which, if delayed, will delay the completion of the project • Critical Path - The path through the project where, if any activity is delayed, the project is delayed – There is always a critical path – There can be more than one critical path
Terminology Continued • Sequential Activities - One activity must be completed before the next one can begin • Parallel Activities - The activities can take place at the same time • Immediate Predecessor – an activity that must be completed before a particular activity can begin • An activity can be in any of these conditions: – It may have a successor(s) but no predecessor(s) starts a network – It may have a predecessor(s) but no successor(s) ends a network – It may have both predecessor(s) and successor(s) in the middle of a network
Terminology Continued • Activity on Arrow (AOA) - Arrows represent activities while nodes stand for events • Activity on Node (AON) - Nodes stand for events and arrows show precedence
AON and AOA Format
Constructing an AON Diagram 1. Begin with the START activity 2. Add activities without predecessors – There will always be one – There may be more than one 3. Add activities that have existing activities as predecessors 4. Repeat step 3 until no more activities
Gantt Charts • Developed by Henry L. Gantt in 1917 • Shows planned and actual progress • Easy-to-read method to show current status
Gantt Charts: Advantages and Disadvantages • Easily understood • Provide a picture of the current state of a project • Difficult to follow with complex projects
Simple Schedule – Gantt Chart © 2006 John Wiley
Class Individual Exercise
Class Individual Exercise - 2. Create a new Project Create the 12 Tasks from the previous slide • enter their names and durations • enter the task dependencies Now enter resources as follows: 2. Jason 3. Jeff, Emily 4. Emily 5. Jeff 6. Emily 7. Ariel 8. Pat 9. Emily 10. Marsha 11. Marc Save your work!
The Work Breakdown Structure • The Work Breakdown Structure (WBS) can take a variety of forms that serve a variety of purposes – The total program can be described as a summation of subdivided elements. – Planning can be performed. – Costs and budgets can be established. – Time, cost, and performance can be tracked. – Schedules and status-reporting procedures can be established. (=> Gantt chart) – Responsibility for each element can be assigned.
The Work Breakdown Structure - 2 • The WBS often appears as an outline with Level 1 tasks on the left and successive levels appropriately indented • The WBS may picture a project subdivided into hierarchical units of tasks, subtasks, work packages, etc.
The Work Breakdown Structure - 3 LEVEL DESCRIPTION 1 2 3 4 5 6 Total Program Usually specified by the client and managed the Project(s) project manager. Task(s) Subtask(s) Usually specified by the functional Work Package(s) manager(s). Level of Effort Most common type: Six-Level Indented Structure
Gozinto Chart for a Toy Bus
A WBS with more Breadth
The Work Breakdown Structure - 4 • Summary: The WBS is an important document and can be tailored for use in a number of different ways – It may illustrate how each piece contributes to the project in terms of performance, responsibility, schedule, and budget – It may list the vendors or subcontractors associated with specific tasks – It may serve as the basis for cost or schedule estimates – It may be used to document that all parties have signed off on their various commitments to the project
The Work Breakdown Structure Steps for designing and using the WBS: 1. Using the action plan, list the task breakdown in successively finer levels of detail. Continue until all meaningful tasks or work packages have been identified. 2. For each such work package, identify the data relevant to the WBS: personnel and organizations responsible for each task. 3. All work package information should be reviewed with the individuals or organizations who have responsibility for doing or supporting the work to verify the accuracy of the WBS
WBS Linear Responsibility Chart
Simplified Linear Responsibility Chart
In-class Group Exercise • Create a WBS for your project
The AON Network
Critical Path and Time Notation: [Task name, expected time, variance]
Critical Path Calculation To find the critical path: 1. start with set of children of the Start node 2. for each node: use the earliest start time (the greatest “earliest finish time of all this node’s predecessors), add in the duration to calculate the earliest finish time 3. repeat step 2 for the children of each node in the set
Slack Calculation To find the slack: 1. start with End node and note its LS time 2. for each predecessor node: set the LF time to the lowest LS time of the successor(s) and subtract the duration to get the EF time 3. repeat step 2 for the children of each node in the set
Critical Path, Time, and Slack
Slack Values
Resulting Gantt Chart
Resulting AON Network
Calculating Activity Times Notes: • • a is the optimistic estimate b is the pessimistic estimate m is an estimate of the mode TE is a calculation of the mean • σ2 is the variance; a representation of the uncertainty • σ is the standard deviation
The Results
Uncertainty of Project Completion Time • Assume activities are statistically independent – is this reasonable? • The variance of a set of activities is the sum of the individual variances • We are most interested in variances along the critical path!
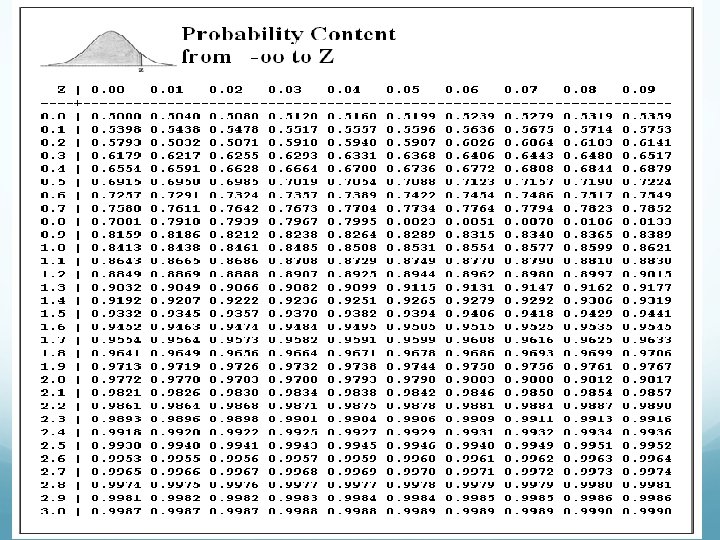
Fun With Statistics! • What is the probability of completing a project on time, given a measure of variance and a critical path? • We can answer that by calculating Z (# of standard deviations) as follows: Z = (D - ) / where D = desired project completion time = critical time of the project = variance of the critical path
Example Continued • If we want to complete the project in 50 days then D = 50, μ = 43, = 33
Example - 2. • The likelihood of completing the project in 50 days is 88. 88% (see Table next slide) • If we want 95% certainty of on-time completion: D=μ+σ*Z = 43 + 5. 745 * 1. 645 = 52. 45 days • For 99% certainty D = 43 + 5. 745 * 2. 33 = 56. 39 days
Implications • As D => μ, Z => 0 • When Z = 0, probability of on-time completion is 50% • Implication? – If you want a high probability of being on time, you need some slack in the schedule! • What about non-critical paths? – Any path that has low slack and significant variance is a potential trouble spot.
Implications - 2. • This is a great tool for you as a manager! • Your boss will want estimates. What is your basis for making them? Guesses?
In Class Group Exercise Look at the WBS that you created for your project. From this, create a Gantt chart for your project. Determine the durations and dependencies for each of your project tasks. You only need to do “expected” duration for now.
In-class Group Exercise - 2 Calculate the total duration for your group project (and, hence, your critical path). Now, create a spreadsheet. For each project task, list: its optimistic, pessimistic, and expected durations you will have to do some educated guessing at this stage; that is normal
In-class Group Exercise - 3 • Calculate TE, , and for each task • Save this in your spreadsheet. • Note for the critical path
In-class Group Exercise - 4. • Determine D for your project. Calculate Z. • What is your probability of completing at time D? • Submit your Gantt chart, your spreadsheet and an explanation of the WBS and the assumptions behind your estimates before next class.