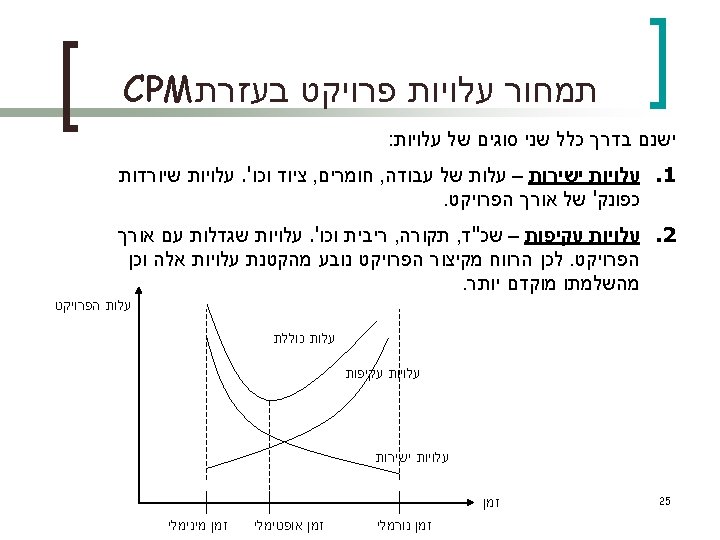
Project Scheduling 1 Critical Path Method CPM 1
 Critical Path Method (CPM) 1")

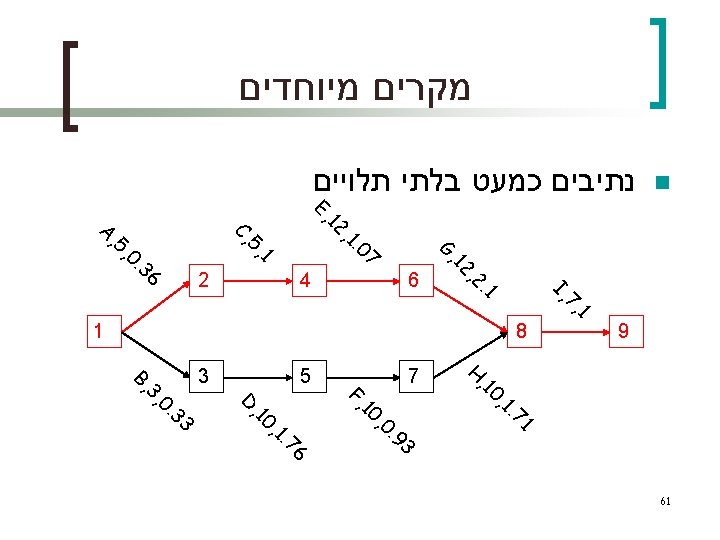
 2. PERT – Project")


 פעילות תיאור קדימות ישירה משך A Perform market survey -")

 WP ti קדימות ES EF LS LF Slack A 3")


 Project Data Sheet (Example עלות קיצור בשבוע עלות מקסימלית עלות נורמלית משך")


 WP Nr. D. Fin. D Min D. Nr. C C.")


 4, 000 1")

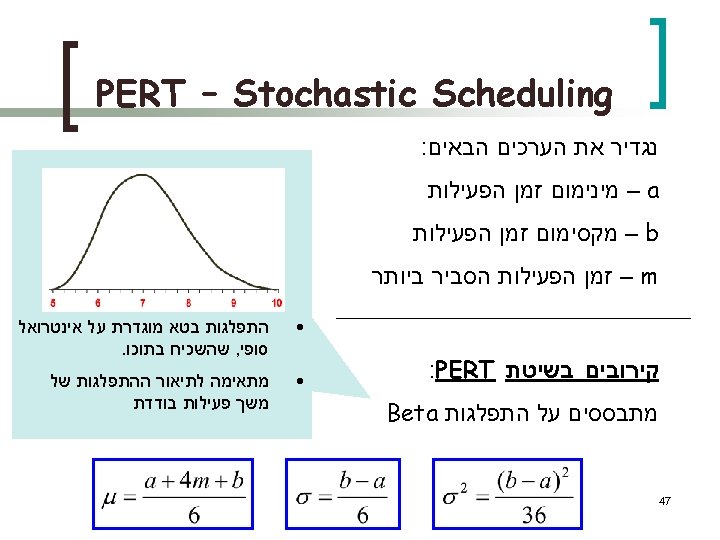
 PERT 45")

 נתון מחושב Activity a m b 2 A 2 3 4")

![Project Duration Calculations ההתפלגות הנורמלית P(T t)=P[(T- )/ (t- )/ ]=P[z (t- )/ ]](https://slidetodoc.com/presentation_image_h2/e45094ab3f53cb0765da1a1bd2ff645e/image-47.jpg "Project Duration Calculations ההתפלגות הנורמלית P(T t)=P[(T- )/ (t- )/ ]=P[z (t- )/ ]")


 =0. 9 , t=? n n n P[z (t-26)/2.")

 WP True A 3 3. 4 B 4. 67 4 C")


- Slides: 56
Project Scheduling (1) Critical Path Method (CPM) 1
2
השיטות העיקריות 1. CPM – Critical Path Method (deterministic) 2. PERT – Project Evaluation and Review Technique (allows uncertainty) 5
8 מהם הקשרים בין הפעילויות? 18: 00 17: 30 17: 00 16: 30 16: 00 15: 30 15: 00 14: 30 14: 00 13: 30 13: 00 12: 30 12: 00 Gantt Chart: A B C D E
רשת פעילויות : תיאור הפרויקט כרשת Activities on Arrows – AOA A 2 C 1 4 B 3 E 5 D Activities on Nodes – AON A n n C 0 E B D 9
10
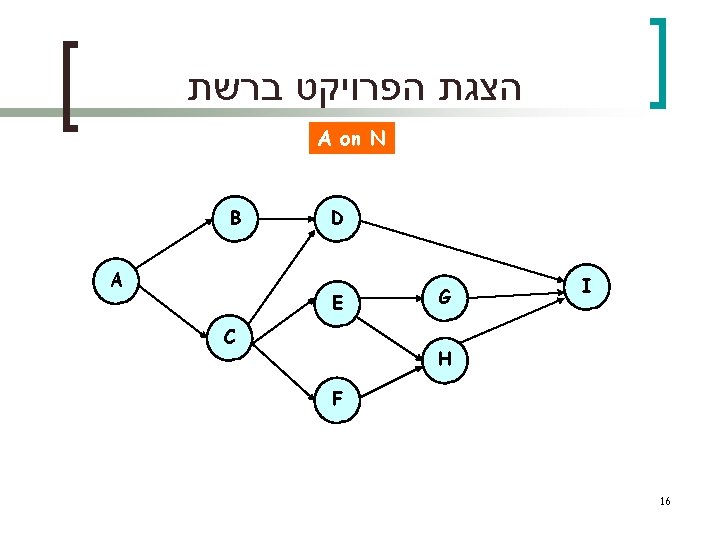
Project Data Sheet (Example) פעילות תיאור קדימות ישירה משך A Perform market survey - 3 B Design graphic icons A 4 C Develop flowchart A 2 D Design input/output screens B, C 6 E Module 1 coding C 5 F Module 2 coding C 3 G Module 3 coding E 7 H Module 4 coding E, F 5 I Merge modules and graphics and test program D, G, H 8 14
הצגת הפרויקט ברשת A on A B 1 A 3 2 D 7 P 1 C E 4 F I 8 G 5 P 2 H 6 15
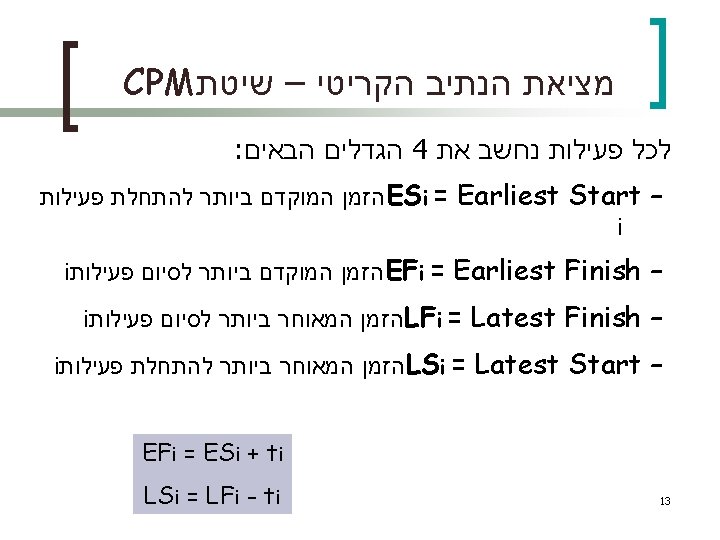
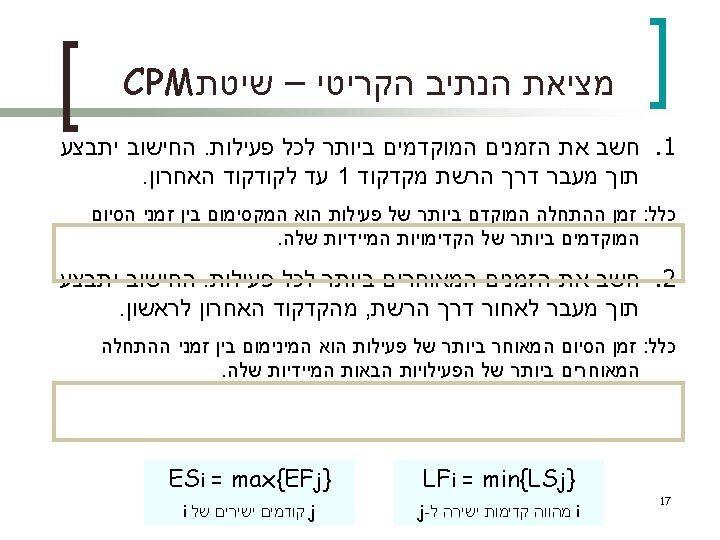
Project Data Sheet (Example) WP ti קדימות ES EF LS LF Slack A 3 -- 0 3 0 B 4 A 3 7 7 11 4 C 2 A 3 5 0 D 6 B, C 7 13 11 17 4 E 5 C 5 10 0 F 3 C 5 8 9 12 4 G 7 E 10 17 0 H 5 E, F 10 15 12 17 2 I 8 D, G, H 17 25 0 Critical Path Length = CPL = max EFi = 25 Slacki = LSi - ESi = LFi - EFi 18
PERT Chart With Critical Path B, 4 A, 3 D, 6 E, 5 C, 2 G, 7 I, 8 H, 5 F, 3 The Critical Path: A C E G I 19
Gantt Chart: Early Start Scheduling 1 2 3 4 5 6 7 8 9 10 11 12 13 14 15 16 17 18 12 20 21 22 23 A B slack C slack D E F slack G H slack I 20 24 25
Solving Critical Path Problems with Linear Programming Latest start times ונקצ ית מ טרה Earliest start times פ איל וצים 21
Example B 1 A 2 3 D 7 P 1 C E 4 F I 8 G 5 P 2 H 6 22
) Project Data Sheet (Example עלות קיצור בשבוע עלות מקסימלית עלות נורמלית משך מינימלי משך נורמלי קדימות פעילות 1, 000 3, 000 1 3 - A 2, 000 6, 000 4, 000 3 4 A B - 2, 000 2 2 A C 1, 500 6, 000 3, 000 4 6 B, C D 1, 300 3, 800 2, 500 4 5 C E 1, 500 3, 000 1, 500 2 3 C F 1, 200 8, 100 4, 500 4 7 E G 600 3, 000 4 5 E, F H 1, 600 12, 800 8, 000 5 8 D, G, H I 48, 300 29, 500 26 Total
Early Start Scheduling 1 A 2 3 4 5 6 7 8 9 10 11 12 13 14 15 16 17 12 20 21 22 23 24 25 333 333 B 1000 C 1000 D 500 500 500 E 500 500 500 F 500 500 G 643 643 H 600 600 600 I Tot 18 1000 1000 333 333 2000 1500 1000 1743 1243 643 1000 1000 Critical Path A C E G I 27
Duration & Cost for Normal n n n Total duration: 25 weeks Overhead cost is 1, 500 per time unit Overhead cost: 25 1, 500=37, 500 Direct cost: 29, 500 Normal cost: 29, 500+37, 500=67, 000 28
עלויות עבור זמנים מינימליים WP Min ti קדימות ES EF LS LF TF A 1 -- 0 1 0 B 3 A 1 4 4 7 3 C 2 A 1 3 0 D 4 B, C 4 8 7 11 3 E 4 C 3 7 0 F 2 C 3 5 5 7 2 G 4 E 7 11 0 H 4 E, F 7 11 0 I 5 D, G, H 11 16 0 30
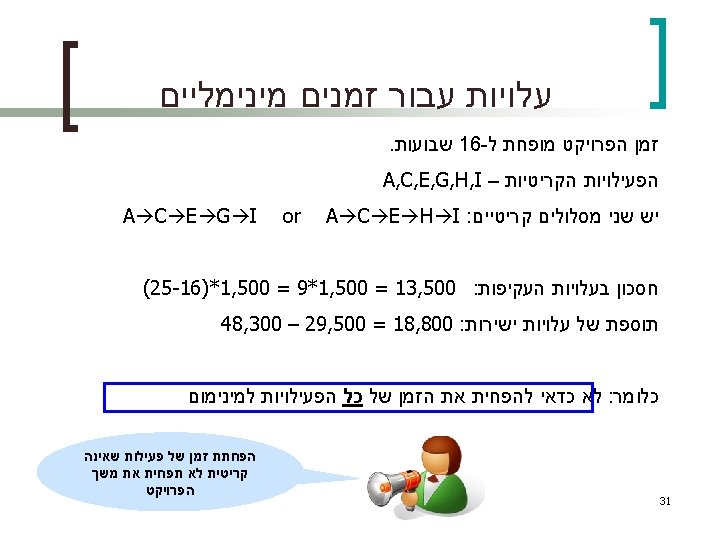
A Was Crashed In 2 Time Units 23 22 21 20 19 18 17 16 11 15 14 13 12 643 643 643 600 600 10 5 4 3 2 1 9 8 7 6 500 500 643 G 600 H 300 0 1000 B 1000 C D 500 500 E 500 500 F I 1000 1000 643 1000 1000 33 A 300 2000 1500 1000 1743 1243 643 0 זמן הפרויקט מופחת ל 23 - שבועות. המסלול הקריטי נותר – A, C, E, G, I חסכון בעלויות העקיפות (25 -23)*1, 500 = 2*1, 500 = 3, 000 : תוספת של עלויות ישירות 31, 500 – 29, 500 = 2, 000 : ההפחתה כדאית. Tot
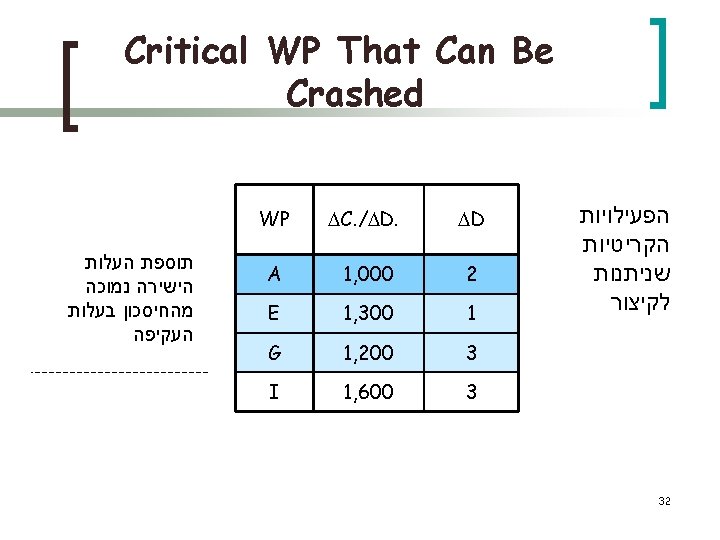
Project Data Sheet (Optimal) WP Nr. D. Fin. D Min D. Nr. C C. / D. Fin. C A 3 1 1 1, 000 3, 000 B 4 4 3 4, 000 2, 000 4, 000 C 2 2, 000 - 2, 000 D 6 6 4 3, 000 1, 500 3, 000 E 5 4 4 2, 500 1, 300 3, 800 F 3 3 2 1, 500 G 7 5 4 4, 500 1, 200 6, 900 H 5 5 4 3, 000 600 3, 000 I 8 8 5 8, 000 1, 600 8, 000 Total 29, 500 35, 200 39
Duration & Cost for Crash n n Overhead cost is 1, 500 per time unit Direct cost: 35, 200 ¡ n Overhead cost: 20 1, 500=30, 000 ¡ n n Direct cost increase: 35, 200 -29, 500=5, 700 Overhead cost reduction: 37, 500 -30, 000=7, 500 Optimal cost: 35, 200+30, 000=65, 200 Cost Reduction: 67, 000 -65, 200=1, 800 40
Time-Cost Chart 41
Solving the Cost-Time Problem: Linear Programming פונקצית מטרה אילוצים 42
Example Activity Node Representation aij bij Mij Nij A (1, 2) 4, 000 1 3 B (2, 3) 12, 000 3 4 C (2, 4) 2, 000 -- 2 2 D (3, 7) 12, 000 1, 500 4 6 E (4, 5) 9, 000 1, 300 4 5 F (4, 6) 6, 000 1, 500 2 3 G (5, 7) 12, 900 1, 200 4 7 H (6, 7) 6, 000 600 4 5 I (7, 8) 20, 800 1, 600 5 8 43
Example 44
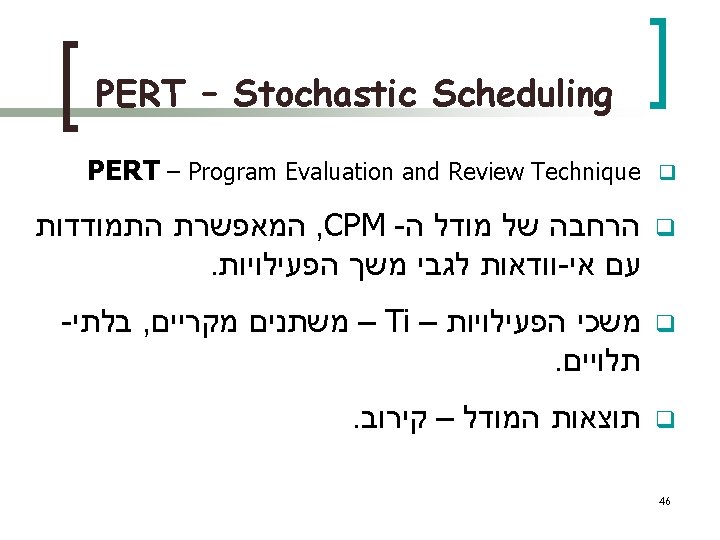
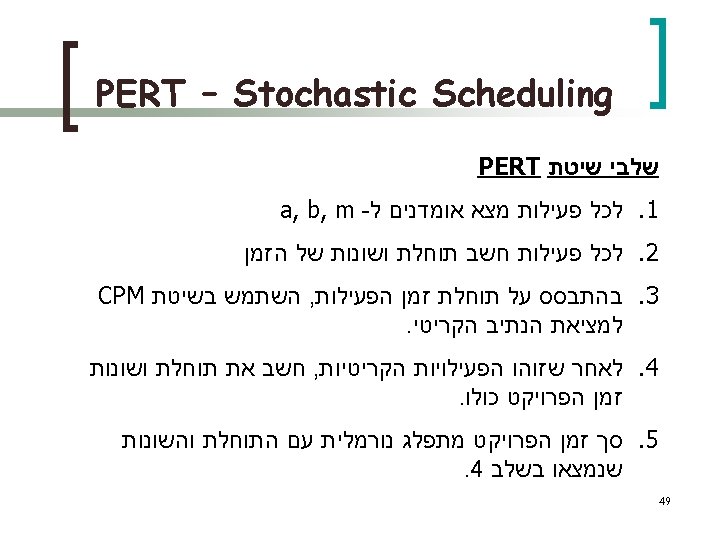
Project Scheduling (2) PERT 45
Stochastic Scheduling (Example) נתון מחושב Activity a m b 2 A 2 3 4 3 0. 33 0. 11 B 2 4 10 4. 67 1. 33 1. 78 C 2 2 0. 00 0 D 4 6 12 6. 67 1. 33 1. 78 E 2 5 8 5 1. 00 F 2 3 8 3. 67 1. 00 G 3 7 10 6. 83 1. 17 1. 36 H 3 5 9 5. 33 1. 00 I 5 8 18 9. 17 2. 17 4. 69 50
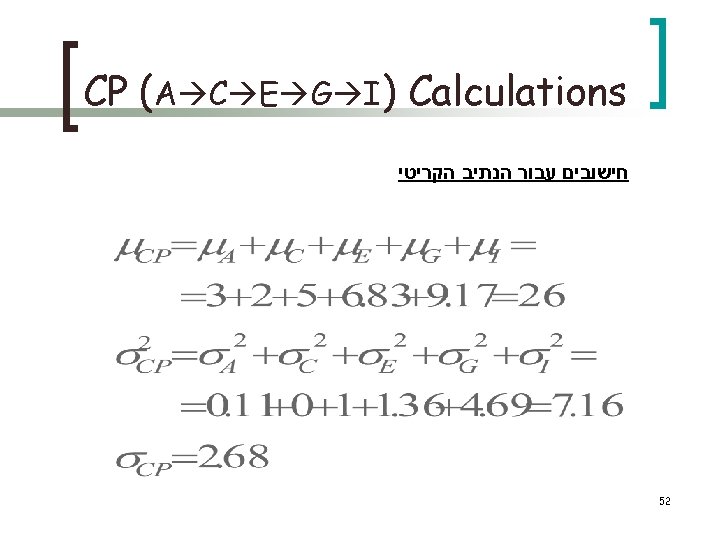
PERT Chart With Critical Path B, 4. 67 A, 3 D, 6. 67 E, 5 C, 2 G, 6. 83 I, 9. 17 H, 5 F, 3. 67 In this example the critical path did not change even though the average times did change (from m to ) 51
Project Duration Calculations ההתפלגות הנורמלית P(T t)=P[(T- )/ (t- )/ ]=P[z (t- )/ ] When: T~N( , ) P(z -a)=P(z ≥a) P(z -a)=1 -P(z <a) z~N(0, 1) (symmetric distribution) 53
54
Project Duration Calculations n מה ההסתברות שהפרויקט יארך 22 יום לכל היותר? מה ההסתברות שיארך יותר מ -28 יום? = ) P(T 22) =P(z (22 -26)/2. 68 P(z -1. 5)=P(z>1. 5)=1 -P(z 1. 5) =1 -0. 9332 =0. 0668 = ) P(T >28) =P(z > (28 -26)/2. 68 P(z >0. 75)=1 -P(z 0. 75) =1 -0. 7733 =0. 2267 55 n n
Project Duration Calculations P(T t) =0. 9 , t=? n n n P[z (t-26)/2. 68] =0. 9 (t-26)/2. 68 =Z 0. 9 (t-26)/2. 68 =1. 28 t-26 =3. 43 t=29. 43 56
Stochastic Scheduling (Example) WP True A 3 3. 4 B 4. 67 4 C 2 2 D 6. 67 7 E 5 3. 5 F 3. 67 5 G 6. 83 6. 2 H 5. 33 7. 2 I 9. 17 13 58
PERT Chart With Critical Path B, 4 A, 3. 4 D, 7 E, 3. 5 C, 2 G, 6. 2 I, 13 H, 7. 2 F, 5 In this example the critical path did change in true durations 59
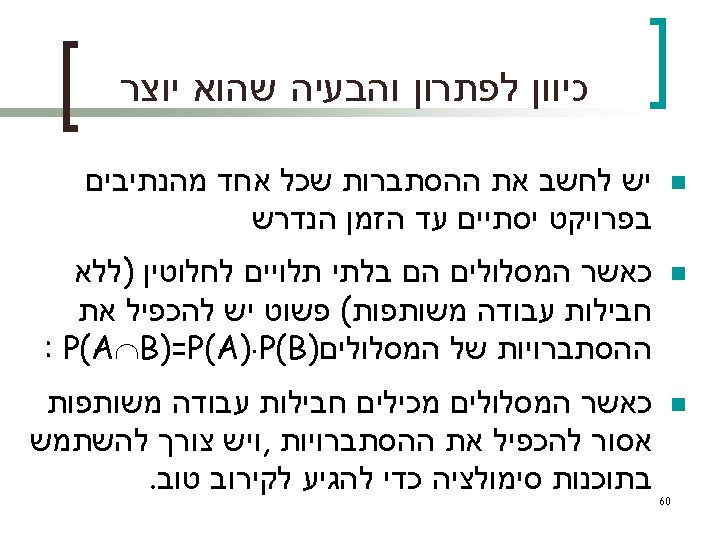
ההסתברויות להשלמת הפרויקט עד t=43 n ACEGI=5+5+12+12+7=41 n ACEGI=√ 0. 13+1+1. 15+4. 4+1=2. 77 n BDFHI=3+10+10+10+7=40 n BDFHI=√ 0. 11+3. 1+0. 86+3+1=2. 84 n T=Max (TACEGI , TBDFHI) n P(T 43)=P(TACEGI 43) P(TBDFHI 43)= P[z (43 -41)/2. 77] P[z (43 -40)/2. 84]= P(z 0. 72) P(z 1. 05)=0. 7642 0. 8413=0. 6429 62