Project Manager Brietta Perez Assistant Project Manager Mujahid

Project Manager: Brietta Perez Assistant Project Manager: Mujahid Hussein GIS Analysts: Jeffrey Cuevas and Nick Waters 1

Tree Planting in Austin, Texas An Analysis of the Austin Community Tree Program 2

Outline • • • Introduction Task 1: Canopy growth and significance testing Task 2: CO 2 and energy benefit totals Task 3: Extrapolation Conclusion

Task 1: Canopy Growth Work Completed • Found the total canopy growth and reduction in the neighborhood planning areas as a whole • Reduction subtracted from growth to account for canopy that disappeared between 2006 and 2010 • Percentage of 16. 5% overall tree canopy growth from 2006 to 2010 • Sample map of Old West Austin neighborhood
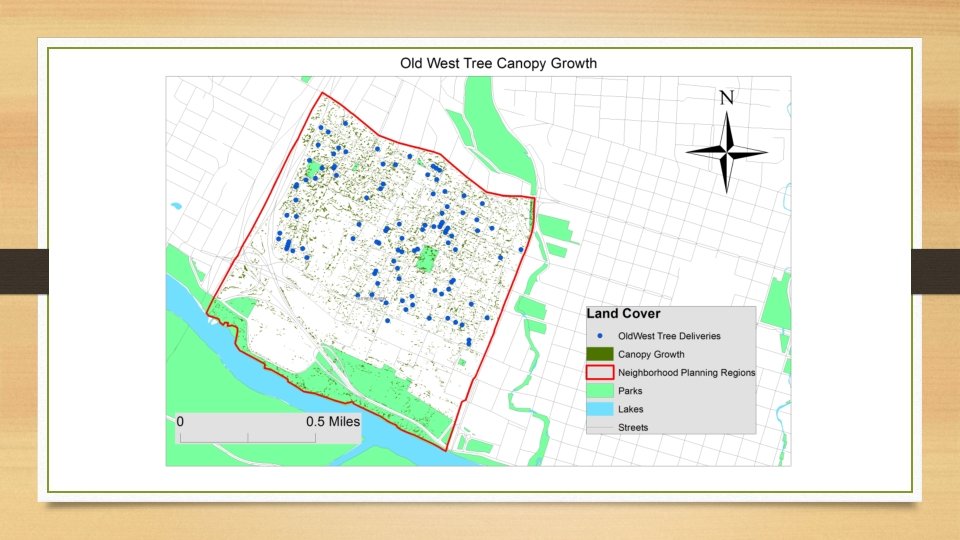

Task 1: Canopy Growth Current and Future Work • Current: plan visual representation, including data display and aesthetics • Future: finalize and implement consistent layout for each neighborhood in the map book, to include: • Map page for each neighborhood • Locator map • Neighbor labels

Task 1: Significance Testing • Find out statistically weathere is a significant increase in canopy • • growth Wilcoxon Signed Rank Test • Paired sampling • Data not normally distributed Two sample sets: areas of canopy extent in each neighborhood in 2006 and 2010 Critical value of 0. 05 Final decision to be presented in the final deliverables

Task 2: CO 2 and Energy Benefit Totals Work Completed • Total CO 2 sequestered and energy conserved/delivery address/year: • Assumed 1 in. tree trunk diameter (National Tree Benefit Calculator) • CO 2 or k. Wh * tree type (e. g. large broadleaf deciduous) = Total CO 2 or k. Wh/address/year (e. g. , Total Large Broadleaf Deciduous CO 2 lbs. sequestered in one year at one address) • Total CO 2 sequestered and energy conserved/delivery 2006 -2015: • Initial data updated to 2014; added one year to total years in ground • (Years in Ground + 1) * Total CO 2 or k. W h/address/year = Total CO 2 or k. W h/address/2006 -2015 • No longer conducting significance testing: necessary data unavailable

Task 2: CO 2 and Energy Benefit Totals Planning Area Coronado Hills Crestview* East Cesar Chavez East Congress Franklin Park Mc. Kinney Montopolis* N. Austin Civic Assn. Old West Austin Rosewood St. John Sweetbriar West Congress Wooten Totals Total CO 2 in Pounds 8, 696 27, 540 7, 580 14, 130 10, 890 5, 034 25, 152 10, 620 10, 152 14, 448 2, 016 9, 982 16, 842 9, 020 173, 034 Total Energy in k. Wh’s 3, 532 10, 800 3, 400 5, 306 4, 524 2, 079 10, 590 4, 244 4, 293 5, 008 880 3, 724 6, 650 3, 270 68, 657

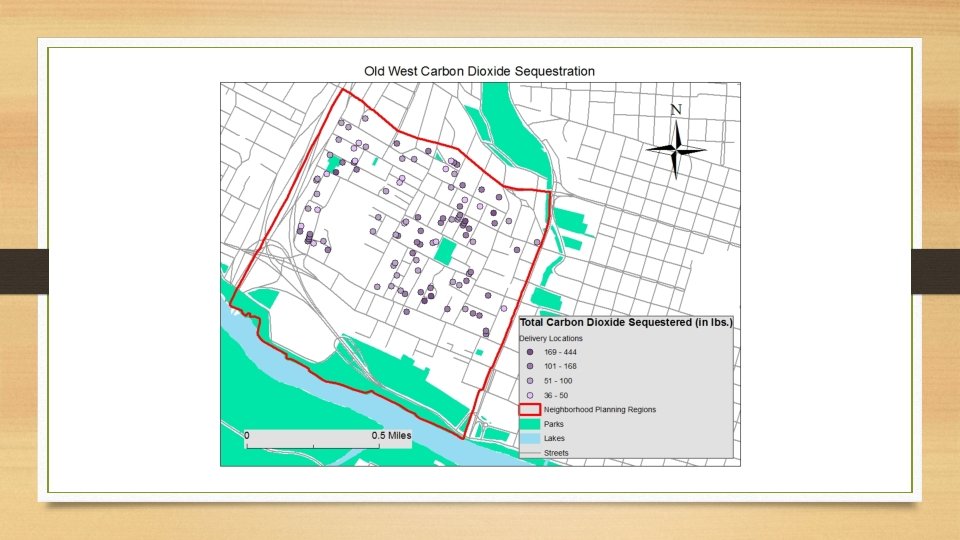
Task 2: CO 2 and Energy Benefit Totals Current and Future Work • Currently assessing best possible method for visually displaying benefit totals • Point symbols, graduated color • 2 series of maps: delivery locations showing CO 2 and k. Wh totals (natural breaks) • Finalize consistent layout for the CO 2 and energy benefits sections of the map book, to include: • Number of ACT trees delivered within each planning area • Overall total lbs. and k. Wh’s as of 2015 • Locator map • Neighbor labels

Task 3: Extrapolation • Performed extrapolation to find canopy growth representative of 2015 and 2025 • Assumed a tree canopy growth of one square foot per year • Tree delivery data representative of 2014 • Total amount of trees in a neighborhood multiplied by the field “years in ground” in order to assign a starting canopy extent value in square feet • Total canopy extent provided by ACT trees in 2014 was 20, 405 ft 2

Task 3: Extrapolation • One year = one square foot of canopy growth; can simply extrapolate by multiplying the number of years we want to predict • 1 year was added to the “years in ground” field to represent 2015 • Canopy extent in 2015 = 24, 908 ft 2 • 11 years were added to the “years in ground” field to represent 2025 • Canopy extent in 2025 = 69, 938 ft 2

Extrapolation Results Planning Area N. Austin Civic Association Wooten Crestview St. John Coronado Hills Old West Austin Rosewood E. Cesar Chavez Montopolis Mc. Kinney Franklin Park East Congress West Congress Sweetbriar Totals Years in Canopy Extent Total Trees Ground (2014) Ground (2015) Ground (2025) (2014) (2015) (2025) 749 134 408 68 307 175 253 231 598 231 497 295 347 210 4503 1 9 9 3 3 8 7 4 5 2 2 6 6 6 2 10 10 4 4 9 8 5 6 3 3 7 7 7 12 20 20 14 14 19 18 15 16 13 13 17 17 17 749 ft 2 1, 206 3, 672 204 921 1, 400 1, 771 924 2, 990 462 994 1, 770 2, 082 1, 260 20, 405 ft 2 1, 498 ft 2 1, 340 4, 080 272 1, 228 1, 575 2, 024 1, 155 3, 588 693 1, 491 2, 065 2, 429 1, 470 24, 908 ft 2 8, 988 ft 2 2, 680 8, 160 952 4, 298 3, 325 4, 554 3, 465 9, 568 3, 003 6, 461 5, 015 5, 899 3, 570 69, 938 ft 2 Future work will consist of adding extrapolation results per neighborhood planning area to the map book.

Time Table • Data processing actually completed very shortly after proposal presentation • Data analysis took four weeks rather than three because of the need to revise methodology and recalculate • In all, left with one week than initially planned for interpretation and production of deliverables Week Starting Date Data Collection Data Preprocessing Data Analysis Interpretation and Deliverables 1 2 3 4 5 6 7 8 9 10 11 12 13 14 8/ 24 8/ 31 9/ 7 9/ 14 9/ 21 9/ 28 10/ 5 10/ 12 10/ 19 10/ 26 11/ 2 11/ 9 11/ 16 11/ 23

Conclusion • On track to submit all deliverables by November 30, 2015 • Question over which methodology to use for canopy growth extrapolation to balance accuracy and efficiency (time constraints) • Base on NTBC leaf surface area (LSA) calculation? • Base on assumption of 1 foot growth per year? • Decided to base on assumption of 1 ft. growth per year • No longer conducting significance testing for Task 2 • Transitioning from data analysis to planning and implementing visual display • Map book in three parts: series of map pages featuring canopy growth, CO 2 sequestration, and energy conservation

Questions?
- Slides: 17