PROJECT ANALYSIS AND EVALUATION Chapter 11 Reem Alnuaim


 we have constructed")


 for a given level of output are the sum")


 investment.")


 investments available")

- Slides: 53
PROJECT ANALYSIS AND EVALUATION Chapter 11 Reem Alnuaim
Course Roadmap Chapte Topic r Focus 15 Raising Capital All 14 Cost of Capital All 9 Net Present Value and Other Investment Criteria All 11 Project Analysis and Evaluation All 16 Financial Leverage and Capital All Structure Policy 10 Making Capital Investment Decision All 17 Dividends Theory All Exam Mid-Term
Key Concepts and Skills Understand forecasting risk and sources of value Understand be able to conduct scenario and sensitivity analysis Understand the various forms of break-even analysis Understand operating leverage Understand capital rationing and its effects
Chapter Outline Evaluating NPV Estimates Scenario and Other What-If Analyses Break-Even Analysis Operating Cash Flow, Sales Volume, and Break-Even Operating Leverage Capital Rationing
Evaluating NPV Estimates NPV estimates are just that – estimates A positive NPV is a good start – now we need to take a closer look � Forecasting risk – how sensitive is our NPV to changes in the cash flow estimates; the more sensitive, the greater the forecasting risk � Sources of value – why does this project create value?
There are two primary reasons for a positive NPV (1) we have constructed a good project or (2) we have done a bad job of estimating NPV.
Scenario Analysis What happens to the NPV under different cash flow scenarios? At the very least, look at: � Best case – high revenues, low costs � Worst case – low revenues, high costs � Measure of the range of possible outcomes Best case and worst case are not necessarily probable, but they can still be possible
Example Consider the project discussed in the text The initial cost is $200, 000, and the project has a 5 -year life. There is no salvage. Depreciation is straight-line, the required return is 12%, and the tax rate is 34%. The base case NPV is 15, 567
What-If Analyses
What-If Analyses
Scenario and Other What-If Analyses 1. 2. Our basic approach to evaluating cash flow and NPV estimates involves asking what-if questions. Our goal in performing such an analysis: to assess the degree of forecasting risk to identify the most critical components of the success or failure of an investment
Scenario and Other What-If Analyses first thing we do is estimate NPV based on our projected cash flows. We will call this the base case. B. After completing the base case, we thus wish to investigate the impact of different assumptions about the future on our estimates : u One way to organize this investigation is to put upper and lower bounds on the various components of the project. A.
Scenario and Other What-If Analyses For example: suppose we forecast sales at 100 units per year. We know this estimate may be high or low, but we are relatively certain it is not off by more than 10 units in either direction. We thus pick a lower bound of 90 and an upper bound of 110 When we pick these upper and lower bounds, we are not ruling out the possibility that the actual values could be outside
SCENARIO ANALYSIS The determination of what happens to NPV estimates when we ask what-if questions We can consider a number of possible scenarios: 1. A good place to start is with the worst case scenario. This will tell us the minimum NPV of the project. If this turns out to be positive , we will be in good shape. 2. We will go ahead and determine the other extreme, the best case. This puts an upper bound on our NPV.
Sensitivity Analysis What happens to NPV when we change one variable at a time The basic idea with a sensitivity analysis: is to freeze all of the variables except one and then see how sensitive our estimate of NPV is to changes in that one variable. If our NPV estimate turns out to be very sensitive to relatively small changes in the projected value of some component of project cash flow, then the forecasting risk associated with that variable is high.
Sensitivity Analysis This is a subset of scenario analysis where we are looking at the effect of specific variables on NPV The greater the volatility in NPV in relation to a specific variable, the larger the forecasting risk associated with that variable, and the more attention we want to pay to its estimation
Example: To illustrate how sensitivity analysis works, we go back to our base case for every item except unit sales. We can then calculate cash flow and NPV using the largest and smallest unit sales figures.
Example: For comparison, we now freeze everything except fixed costs and repeat the analysis:
Example: What we see here is that given our ranges, the estimated NPV of this project is more sensitive to changes in projected unit sales than it is to changes in projected fixed costs. Under the worst case for fixed costs, the NPV is still positive.
Sensitivity Analysis As we have illustrated, sensitivity analysis is useful in pinpointing which variables deserve the most attention. If we find that our estimated NPV is especially sensitive to changes in a variable that is difficult to forecast (such as unit sales), then the degree of forecasting risk is high. We might decide that further market research would be a good idea in this case.
SIMULATION ANALYSIS v v v Scenario analysis and sensitivity analysis are widely used. With scenario analysis, we let all the different variables change, but we let them take on only a few values. With sensitivity analysis, we let only one variable change, but we let it take on many values. If we combine the two approaches, the result is a crude form of simulation analysis.
SIMULATION ANALYSIS If we want to let all the items vary at the same time, we have to consider a very large number of scenarios, and computer assistance is almost certainly needed. In the simplest case, we start with unit sales and assume that any value in our 5, 500 to 6, 500 range is equally likely. We start by randomly picking one value (or by instructing a computer to do so). We then randomly pick a price, a variable cost, and so on. Once we have values for all the relevant components, we calculate an NPV. We repeat this sequence as much as we desire, probably several thousand times.
SIMULATION ANALYSIS The result is many NPV estimates that we summarize by calculating the average value and some measure of how spread out the different possibilities are. For example, it would be of some interest to know what percentage of the possible scenarios result in negative estimated NPVs.
Break-Even Analysis the crucial variable for a project is sales volume. If we are thinking of creating a new product or entering a new market, for example, the hardest thing to forecast accurately is how much we can sell. For this reason, sales volume is usually analyzed more closely than other variables. Break-even analysis is a popular and commonly used tool for analyzing the relationship between sales volume and
Break-Even Analysis v v There a variety of different break-even measures, and we have already seen several types. An example : payback period can be interpreted as the length of time until a project breaks even, ignoring time value. All break-even measures have a similar goal. we will always be asking, “How bad do sales have to get before we actually begin to lose money? We will also be asking, “Is it likely that things will get that bad? ”
FIXED AND VARIABLE COSTS Variable Costs change as the quantity of output changes, and they are zero when production is zero. For example, direct labor costs and raw material costs are usually considered variable. This makes sense because if we shut down operations tomorrow, there will be no future costs for labor or raw materials. that total variable cost is equal to the cost per unit multiplied by the number of units. In other words, the relationship between total variable cost (VC), cost per unit of output ( v ), and total quantity of output ( Q ) can be written simply
VARIABLE COSTS
Example: The Blume Corporation is a manufacturer of pencils. It has received an order for 5, 000 pencils, and the company has to decide whether to accept the order. From recent experience, the company knows that each pencil requires 5 cents in raw materials and 50 cents in direct labor costs. These variable costs are expected to continue to apply in the future. What will Blume’s total variable costs be if it accepts the order? In this case, the cost per unit is 50 cents in labor plus 5 cents in material for a total of 55 cents per unit.
Example: At 5, 000 units of output, we have:
Fixed Costs Fixed Costs do not change during a specified time period. So, unlike variable costs, they do not depend on the amount of goods or services produced during a period (at least within some range of production). For example, the lease payment on a production facility and the company president’s salary are fixed costs, at least over some period. Naturally, fixed costs are not fixed forever. They are fixed only during some particular time, say, a quarter or a year. Beyond that time, leases can be terminated and executives “retired. ” More to the point, any fixed cost can be modified or eliminated given enough time; so, in the long run, all costs are variable.
Total Costs Total costs (TC) for a given level of output are the sum of variable costs (VC) and fixed costs (FC):
ACCOUNTING BREAK-EVEN The sales level that results in zero project net income. Accounting Break –even is the most widely used measure of break-even.
Example: u Suppose we retail one-petabyte computer disks for $5 a piece. We can buy disks from a wholesale supplier for $3 a piece. We have accounting expenses of $600 in fixed costs and $300 in depreciation. How many disks do we have to sell to break even that is, for net income to be zero?
Example: For every disk we sell, we pick up: $5 - 3=$2 toward covering our other expenses (this $2 difference between the selling price and the variable cost is often called the contribution margin per unit. We have to cover a total of $600 +300 =$900 in accounting expenses. so we need to sell $900/2 =450 disks. We can check this by noting that at a sales level of 450 units our revenues are $5 X 450= $2, 250 our variable costs are $3 x 450 =$1, 350.
Example: Notice that when net income is zero, so are pretax income and, of course, taxes. In accounting terms, our revenues are equal to our costs, so there is no profit to tax.
The quantity that leads to a zero net income NI = (Sales – VC – FC – D)(1 – T) = 0 QP – v. Q – FC – D = 0 Q(P – v) = FC + D Q = (FC + D) / (P – v) P =Selling price per unit v =Variable cost per unit Q =Total units sold S=Total sales P Q VC = Total variable costs v X Q FC = Fixed costs D =Depreciation T = Tax rate
Operating Cash Flow, Sales Volume, and Break-Even Accounting break-even is one tool that is useful for project analysis. Ultimately, however , we are more interested in cash flow than accounting income. for example, if sales volume is the critical variable, then we need to know more about the relationship between sales volume and cash flow than just the accounting break-even. Our goal in this section is to illustrate the relationship between operating cash flow and sales volume.
ACCOUNTING BREAK-EVEN AND CASH FLOW Now that we know how to find the accounting break-even, it is natural to wonder what happens with cash flow. suppose the Wettway Sailboat Corporation is considering whether to launch its new Margoclass sailboat. The selling price will be $40, 000 per boat. The variable costs will be about half that, or $20, 000 per boat, and fixed costs will be $500, 000 per year.
Example The total investment needed to undertake the project is $3, 500, 000. This amount will be depreciated straight-line to zero over the five-year life of the equipment. The salvage value is zero, and there are no working capital consequences. Wettway has a 20 percent required return on new projects. Based on market surveys and historical experience, Wettway projects total sales for the five years at 425 boats, or about 85 boats per year. Ignoring taxes, should this project be launched?
Example
SALES VOLUME AND OPERATING CASH FLOW We know that, ignoring taxes, a project’s operating cash flow, OCF, can be written simply as EBIT plus depreciation:
SALES VOLUME AND OPERATING CASH FLOW
Cash Break-Even We have seen that a project that breaks even on an accounting basis has a net income of zero, but it still has a positive cash flow. At some sales level below the accounting break-even, the operating cash flow actually goes negative. This is a particularly unpleasant occurrence. If it happens, we actually have to supply additional cash to the project just to keep it afloat.
Cash Break-Even The sales level that results in a zero operating cash flow. To calculate the cash break-even (the point where operating cash flow is equal to zero), we put in a zero for OCF: Wettway must therefore sell 25 boats to cover the $500 in fixed costs.
Financial Break-Even The sales level that results in a zero NPV. To the financial manager, this is the most interesting case. What we do is first determine what operating cash flow has to be for the NPV to be zero. We then use this amount to determine the sales volume.
Example Wettway requires a 20 percent return on its $3, 500 (in thousands) investment. How many sailboats does Wettway have to sell to break even once we account for the 20 percent per year opportunity cost? The sailboat project has a five-year life. The project has a zero NPV when the present value of the operating cash flows equals the $3, 500 investment. Because the cash flow is the same each year, we can solve for the unknown amount by viewing it as an ordinary annuity. The five-year annuity factor at 20 percent is 2. 9906, and the OCF can be determined
Example Wettway needs to sell about 84 boats per year. This is not good news. the financial break-even is substantially higher than the accounting break-even. This will often be the case. Moreover, what we have discovered is that the sailboat project has a substantial degree of forecasting risk. We project sales of 85 boats per year, but it takes 84 just to earn the required return.
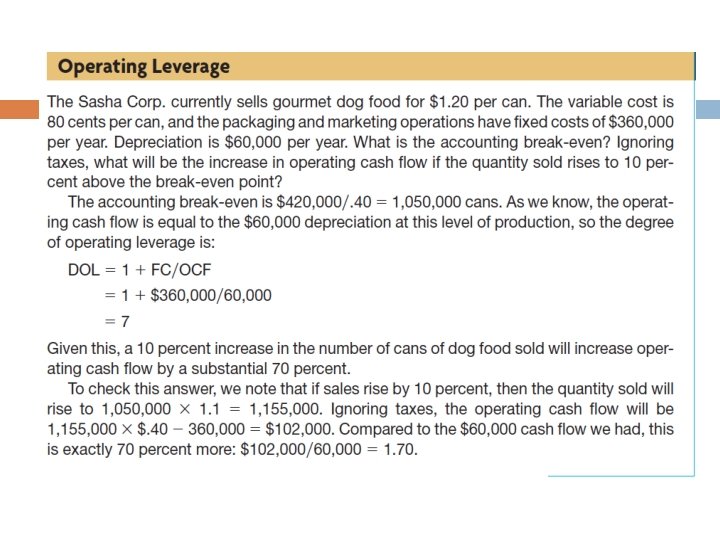
Operating Leverage The degree to which a firm or project relies on fixed costs. A firm with low operating leverage will have low fixed costs compared to a firm with high operating leverage. Projects with a relatively heavy investment in plant and equipment will have a relatively high degree of operating leverage. Such projects are said to be capital intensive.
IMPLICATIONS OF OPERATING LEVERAGE The higher the degree of operating leverage, the greater is the potential danger from forecasting risk. The reason is that relatively small errors in forecasting sales volume can get magnified, or “levered up, ” into large errors in cash flow projections. From a managerial perspective, one way of coping with highly uncertain projects is to keep the degree of operating leverage as low as possible.
MEASURING OPERATING LEVERAGE One way of measuring operating leverage is to ask: If quantity sold rises by 5 percent, what will be the percentage change in operating cash flow? The degree of operating leverage (DOL) is defined such that: Percentage change in OCF=DOL x Percentage change in Q Based on the relationship between OCF and Q , DOL can be written as: DOL = 1+FC/OCF
Capital Rationing is said to exist when we have profitable (positive NPV) investments available but we can’t get the funds needed to undertake them. For example, as division managers for a large corporation, we might identify $5 million in excellent projects, but find that, for whatever reason, we can spend only $2 million.
Soft Rationing: The situation that occurs when units in a business are allocated a certain amount of financing for capital budgeting. Hard Rationing: With hard rationing , a business cannot raise capital for a project under any circumstances. For large, healthy corporations, this situation probably does not occur very often. This