Project 5 Thematic Maps Aaron Henning Carl Sherlock


 § Equal number of features in each class")


- Slides: 22
Project 5 Thematic Maps Aaron Henning & Carl Sherlock
Thematic Maps Basics ► Transfer geographic data into geographic information ► Highlight one attribute’s geographic distribution ► Single purpose or “theme” in mind ► Review: Reference maps portray many attributes and features
Reference vs. Thematic
Thematic Maps Use abstract, graphic symbols that represent the quantities and qualities that make locations meaningful ► The use of colors and symbols to project attribute data ► Attribute data examples: density, counts, rates, etc. ► Cynthia Brewer’s presentation ►
Remember…
Thematic Mapping ► Counts § Showing a symbol for each individual or group of individuals § Fails when many individuals or groups are present and/or when location is unknown
Thematic Mapping ► Porportional Maps Symbol § Also called graduated symbol maps § They represent classes of counts not individual counts § Useful for counts that lack location
Thematic Mapping ► Chloropleth “value” – “place” & § Involves coloring geographic areas to represent categories of rates or densities § Most common type of thematic map
Thematic Mapping Pie Chart ► Rates and densities § Simply one count divided by another count § In densities, the divisor is the magnitude of a geographic area § Can be in various formats Bar Graph
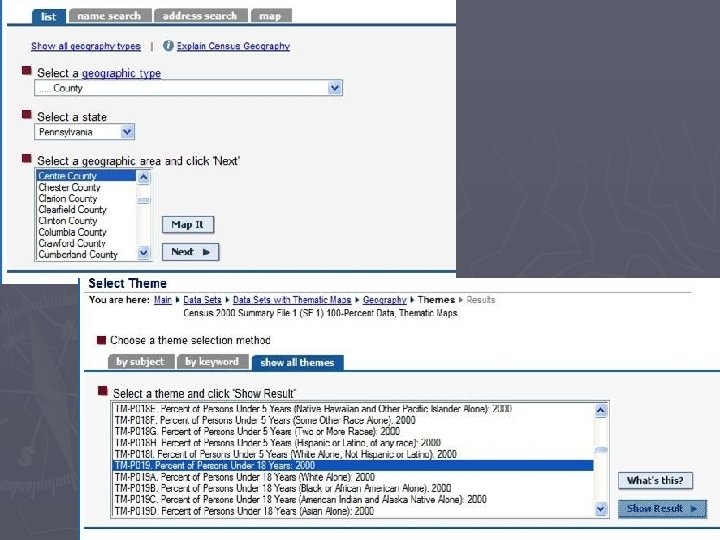
Starting the Project ► Go to factfinder. census. gov ► Left side menu, hover cursor over “DATA SETS” ► Click on “Decennial Census”
► Making sure you are selecting “Census 2000 Summary File 1”, choose “Thematic Maps” on right hand menu Select “county” under geographic type ► Select your state, then select your county, and hit “Next” ► This will display all of the data themes that can be displayed on a map pick one and click “Show Result” ►
► Directly above map where it says “Display map by: ”, select “Census Tract” from dropdown menu ► Adjust zoom and pan to make data as visible as possible
► At top of left side menu under “Change…”, select “data classes” ► From here you can change classing method, color scheme, and number of classes
Classing Methods Review ► Quantile (percentile) § Equal number of features in each class ► Equal Interval § Equal range of values in each class ► Natural Breaks § Divides features and/or range of values according to pre-existing groupings or divisions
► When finished customizing, right click map and select “Save picture as. . . ” (repeat for legend)
► You have now successfully found and downloaded all data for your first map ► For this project, you need a total of 3 maps ► At least one needs to be of ACS Data ► From Fact. Finder homepage, hover “Data Sets” and click on “American Community Survey” and follow same process
► Take a moment to analyze your map – why is the data how it is? ► Why does the tract that corresponds to campus and downtown have the lowest percent of persons under 18? Think about this, it will help you with the write-up Map 1: Percent Persons Under 18 Years of Age
Finding Map Scale ► In bottom left corner of your map image, it will tell you distance across (Dg) ► The actual width of the image is ~6” (Dm) ► Remember the formula? S = Dm / Dg
Review ► Thematic Mapping ► Attribute data transformed into useful geographic information ► Designed with a central purpose or theme ► Different types of data are represented in different ways
References ► ► ► Baxter, Ryan. Census Mapping and Thematic Maps. GEOG 121 Lecture. 11/20/06 Brewer, Cynthia. Cartographic Inspirations for Designing Better Data Visualizations. GEOG 121 Guest Presentation. 10/11/06 Census Bureau Fact. Finder. Accessed 11/20/06. http: //factfinder. census. gov ESRI Virtual Campus: Module 6. Accessed 11/19/06. http: // training. esri. com The Pennsylvanian Marketing and Planning Center. Accessed 11/20/06. http: //www. mapcenter. org/index. html
Help ► Aaron Henning – amh 334@psu. edu ► Carl Sherlock – cfs 5000@psu. edu § http: //www. personal. psu. edu/cfs 5000/geog 121_lab 5. html ► Course Example § http: //www. geog. psu. edu/courses/geog 121/projects/proj 5_example. html