Project 2030 Supporters Blue CrossBlue Shield of Montana

Project 2030 Supporters • • • Blue Cross/Blue Shield of Montana Agricultural Experiment Station Montana Area Agencies on Aging Association Montana Association of Counties Montana Bankers Association Montana Chamber Foundation • Montana State University Extension • North. Western Energy • PPL Montana • University of Montana • Montana Council on Economic Education (MCEE) • ONE MONTANA: Bridging the Rural-Urban Divide 1

Project 2030: Montana’s Aging Population George Haynes Doug Young Myles Watts Montana State University Department of Agricultural Economics and Economics 2 Montana Academy of Nutrition and Dietetics May 28, 2015 (8: 45 – 9: 45 am) Great Northern Hotel - Helena Mountains & Minds

Project 2030 Topics 1. Demographics 2. Migration 3. Fiscal Impacts of Aging 4. Consumption (income/expenditures) 5. Summary, Conclusions, & Implications

Impacts of Aging § Demand • What nutrition-related services to the elderly demand from you? § Supply • What will you be willing to supply?

Demographics • Population • Age Dependency Ratios § TDR § YDR § EDR • Age Dependency Ratios by County 5

Montana Population by Age Group 0 to 17 18 to 64 65+ 700, 000 600, 000 500, 000 400, 000 300, 000 200, 000 100, 000 0 1930 1940 1950 1960 1970 1980 1990 2000 2010 2020 2030 Source: U. S. Census. Years 2020 and 2030 are estimates using the U. S. Census projections re-weighted with 2010 U. S. Census Data 6

Montana Age Groups as a Percent of Total Montana Population 0 to 17 18 to 64 65+ 70 60 50 40 30 20 10 0 1930 1940 1950 1960 1970 1980 1990 2000 2010 2020 2030 Source: U. S. Census. Years 2020 and 2030 are estimates using the U. S. Census projections re-weighted with 2010 U. S. Census Data 7
 § • • TDR =")
Age Dependency Ratios • Total Age Dependency Ratio (TDR) § • • TDR = Non-Working Age ÷ Working Age Non-Working Age Population § 0 to 17 years of age (youth) § 65+ years of age (elder) Working Age Population § 18 to 64 years of age 8
 § YDR = 0 to 17")
Age Dependency Ratios • Youth Dependency Ratio (YDR) § YDR = 0 to 17 Age ÷ Working Age • Elder Dependency Ratio (EDR) § EDR = 65+ Age ÷ Working Age 9

Montana Age Dependency Ratios YDR EDR TDR 1. 00 0. 90 0. 80 0. 70 0. 60 0. 50 0. 40 0. 30 0. 20 0. 10 0. 00 1930 1940 1950 1960 1970 1980 1990 2000 2010 2020 2030 Source: U. S. Census. Years 2020 and 2030 are estimates using the U. S. Census projections re-weighted with 2010 U. S. Census Data 10

Montana Age Dependency Ratios Year 1930 1940 1950 1960 1970 1980 1990 2000 2010 2020 2030 YDR 0. 60 0. 49 0. 56 0. 75 0. 68 0. 49 0. 47 0. 42 0. 36 0. 38 0. 39 EDR 0. 08 0. 10 0. 15 0. 19 0. 18 0. 23 0. 22 0. 24 0. 36 0. 48 TDR 0. 68 0. 59 0. 71 0. 94 0. 86 0. 67 0. 70 0. 64 0. 60 0. 74 0. 87 Sources: U. S. Census. Years 2020 and 2030 are estimates using the U. S. Census projections re-weighted with 2010 U. S. Census Data 11

2010 YDR Montana Counties Distribution Map Source: U. S. 2010 Decennial Census 12

2030 YDR Montana Counties Distribution Map Source: NPA, Inc. Population Projections revised with the 2010 Census 13

2010 EDR Montana Counties Distribution Map Source: U. S. 2010 Decennial Census 14

2030 EDR Montana Counties Distribution Map Source: NPA, Inc. Population Projections revised with the 2010 Census 15

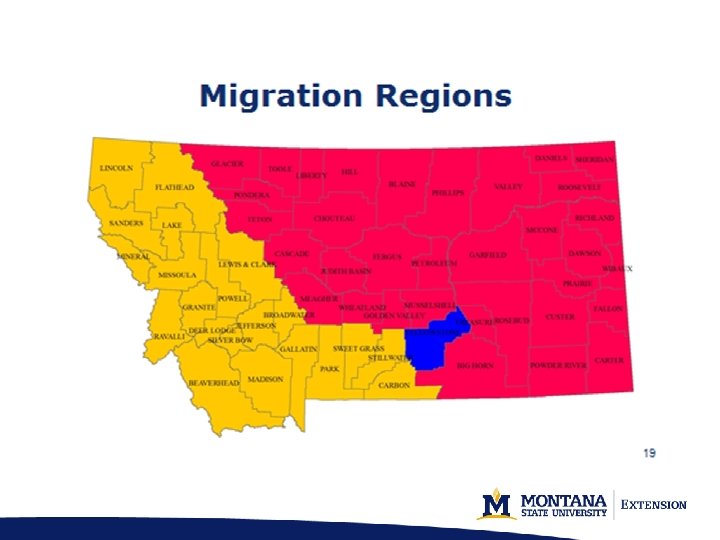
Migration • • Net Migration in Montana 2000 to 2010 • Net Migration to Yellowstone County 2000 to 2010 • Net Migration to Eastern/Northern Montana 2000 to 2010 Net Migration in Western/Southern Montana 2000 to 2010 16

Net Migration Montana 2000 to 2010 Sources: U. S. Census and CDC 18

Net Migration Western/Southern Montana 2000 to 2010 2, 000 1, 500 Persons 1, 000 500 0 -500 10 15 20 25 30 35 40 45 50 55 60 65 70 75 -1, 000 -1, 500 -2, 000 Sources: U. S. Census and CDC Age in 2010 19

Net Migration Yellowstone County 2000 to 2010 500 400 300 Persons 200 100 0 -100 10 15 20 25 30 35 40 45 50 55 60 65 70 75 -200 -300 -400 -500 Sources: U. S. Census and CDC Age in 2010 20

Net Migration Eastern/Northern Montana 2000 to 2010 2, 000 1, 500 Persons 1, 000 500 0 -500 10 15 20 25 30 35 40 45 50 55 60 65 70 75 -1, 000 -1, 500 -2, 000 Age in 2010 Sources: U. S. Census and CDC 21

Fiscal Impacts of Aging § Aging Impacts on Expenditure § Aging Impacts on Revenue • K-12 and Higher Education • Corrections • Medicaid • See the website

Fiscal Impacts on Expenditure K-12 AND HIGHER EDUCATION 23

K-12 Education Expenditure in Fiscal Year 2009 Total Expenditure $ 1, 492, 885, 133 Public School Enrollment Fall 2009 141, 807 Participation Rate: Enrollment/Population 5 to 17 Expenditure per Student Expenditure per Montanan 88. 0% $ 10, 528 $ 1, 509 Sources: Montana Office of Public Instruction, Expenditures by Function by Enrollment Category FY 2010 http: //opi. mt. gov/pub/index. php? dir=School%20 Finance/OPICore. Data. Files/Per. Pupil/&file=Perpupil 1 991_2011. xls Use Tab: 10 obj_NO_ARRA_NO_SFSF Montana Legislative Fiscal Division, OPI summary, Base Fiscal 2010 - Total Costs http: //leg. mt. gov/content/Publications/fiscal/fr_2013/Volume%204/section%20 E/OPI. pdf - Pg 10 Montana Office of Public Instruction, Montana Public School Enrollment Data October 4, 2010 www. opi. mt. gov/pdf/Measurement/Enroll. Book 2010. pdf - Pg 2 U. S. Census 2010 population data 24

Percent of Montana Population Age 5 to 17 Percent of Total Population 16% 16. 29% 16. 18% 16. 28% 15. 99% 15. 36% 15% 14% 2010 2015 2020 2025 2030 Source: 2010 U. S. Census. Years 2015 to 2030 are estimates using the U. S. Census projections re-weighted with 2010 U. S. Census Data. 25

K-12 Expenditures per Montanan Dollars per Montanan $ 1, 550 $ 1, 509 $ 1, 500 $ 1, 499 $ 1, 508 $ 1, 481 $ 1, 450 $ 1, 423 $ 1, 400 2015 2020 2025 2030 Source: 2010 U. S. Census. Years 2015 to 2030 are estimates using the U. S. Census projections re-weighted with 2010 U. S. Census Data. 26

University System Instructional Expenditure Year 2010 Total Appropriations State Appropriation Local Appropriations FTE Resident Enrollment Participation Rate $ 160, 052, 417 $ 151, 947, 492 $ 8, 104, 925 31, 222 33% (Enrollment/Population 18 to 24) Expenditure per Student Expenditure per Montanan Source: Montana State University System $ 5, 126 $162 27

Percent of Montana Population Ages 18 to 24 10. 0% 9. 6% 9. 0% 8. 3% 8. 0% 7. 6% 7. 7% 7. 9% 7. 0% 2010 2015 2020 2025 2030 Source: 2010 U. S. Census. Years 2015 to 2030 are estimates using the U. S. Census projections reweighted with 2010 U. S. Census Data 28

Higher Education Expenditure Per Montanan Dollars Spent per Montanan $180 $162 $160 $140 $129 $130 2025 $133 $120 $100 2015 2030 Instruction only. Excludes MAES, Fire school, Bureau of Mines, Grants and Contracts, etc. Sources: MUS OCHE, Population Data: Year 2010 Census. Years 2015 to 2030 are estimates using the U. S. Census projections re-weighted with 2010 U. S. Census Data 29

Fiscal Impacts on Expenditure CORRECTIONS 30

Participation and Daily Expenditures for Corrections Sources: D. Hall, Montana Department of Corrections for participants by age. B. Peake, Montana Department of Justice for youth court participants. Costs from Montana Department of Corrections 2011 Biennial Report and Montana Judicial Branch Youth Court At-A-Glance 2010 31
 Sources: MT DOC and DOJ 32")
Participation in Montana Correctional System (2012) Sources: MT DOC and DOJ 32

Corrections Expenditure per Montanan by Age $400 $339 $308 $300 $226 $200 $147 $100 $22 $19 $0 10 to 13 14 to 17 18 to 24 25 to 44 Sources: MT DOC and DOJ Population: Year 2010 U. S. Census 45 to 64 65 + 33

Corrections Expenditure per Montanan Dollars Spent per Montanan $170 $166 $162 $160 $157 $151 $150 $146 $140 2012 2015 2020 2025 2030 Sources: MT DOC and DOJ Population: Year 2010 U. S. Census. Years 2012 to 2030 are estimates using the U. S. Census projections re-weighted with 2010 U. S. Census Data (included in 2012 are the 2010 Youth Court Numbers) 34

Fiscal Impacts on Expenditure MEDICAID 35

Montana Medicaid Expenditures in Fiscal Year 2009 - 2010 Description Total Federal and State Expenditures for Medicaid (22. 35%) Number of participants Participation Rate Expenditure per Participant Expenditure per Montanan (989, 415) $915, 129, 130 Elderly Blind and Disabled $177, 535, 051 $430, 110, 691 Adults Children $121, 712, 174 $184, 856, 084 $204, 531, 361 39, 679, 084 $96, 129, 739 $27, 202, 671 $41, 315, 335 81, 597 6, 126 19, 059 11, 433 44, 979 8. 2% 4. 2% 14. 6% 1. 9% 18. 9% $2, 507 $6, 477 $5, 044 $2, 379 $919 $207 $40 $97 $27 $42 Sources: Montana Medicaid Program, State Fiscal Years 2009/2010, Report for the 2011 Legislature, page 9 and Summary of Public Assistance and Medical Care, State Fiscal Year 2010. Montana Department of Public Health and Human Services. www. dphhs. mt. gov/statisticalinformation/tanfstats/sfy 2010/table 1. pdf. 36

Medicaid Expenditures per Montanan, 2010 to 2030 300 250 $206 $217 $230 $243 $250 2025 2030 200 150 100 50 0 2015 2020 Sources: Bureau of Census and Montana Medicaid Program, State Fiscal Years 2009/2010, Report for the 2011 Legislature 37

Medicaid Expenditures per Montanan by Medicaid Group, 2010 to 2030 Elderly Blind and Disabled Adults Children $115 $119 140 120 100 $97 $102 $109 80 60 40 $42 $47 $41 $27 $69 $64 $56 $41 $25 $40 $24 $38 $24 20 0 2015 2020 2025 2030 Sources: Bureau of Census and Montana Medicaid Program, State Fiscal Years 2009/2010, Report for the 2011 Legislature 38

State Medicaid Physical Health Expenditure per Montanan for Long-Term Care and Other Expenditure for Elderly, 2010 to 2030 (no trend) Long-Term Care Dollars per Montanan $80 Other $70 $60 $9 $8 $50 $40 $30 $7 $6 $34 $55 $10 $59 $48 $40 $20 2015 2020 2025 2030 Sources: Bureau of Census and Montana Medicaid Program, State Fiscal Years 2009/2010, Report for the 2011 Legislature; and Kaiser Commission on Medicaid and the Uninsured, the Henry J. Kaiser Family Foundation 39
 Sources: Montana")
State Medicaid Expenditure for the Elderly per County Resident 2010 (no trend) Sources: Montana Department of Public Health and Human Services, Statistical Information for 2010, Table 5 (Nursing Home) and 2010 Decennial Census 40
 Sources: Montana")
State Medicaid Expenditure for the Elderly per County Resident 2030 (no trend) Sources: Montana Department of Public Health and Human Services, Statistical Information for 2010, Table 5 (Nursing Home); 2010 Decennial Census; and NPA, Inc. Population Projections for 2030 41

Fiscal Impacts on Revenue RESIDENTIAL PROPERTY TAXES 42

Percentage of Persons in Each Age Group who are Head of Household 43 Source: U. S. Census 43

Montana Residential Property Taxes by Age $1, 000 $894 $985 $942 $902 $786 $800 $608 $600 $400 $200 $152 $0 Less than 25 25 to 34 35 to 44 45 to 54 55 yo 64 65 to 74 75 + Sources: MDOR, BLS, Year 2010 U. S. Census. Years 2015 to 2030 are estimates using the U. S. Census projections re-weighted with 2010 U. S. Census Data 44

Residential Property Taxes per Montanan $650 $621 $625 $627 $630 $611 $600 $575 2010 2015 2020 2025 2030 Sources: MDOR, BLS, Year 2010 U. S. Census. Years 2015 to 2030 are estimates using the U. S. Census projections re-weighted with 2010 U. S. Census Data 45

Fiscal Impacts on Revenue INDIVIDUAL RESIDENT INCOME TAXES 46

Individual Resident Income Tax Liability per Montanan Dollars per Montanan $745 $735 $724 $728 $735 $723 $715 $708 $705 $702 $695 $685 $675 2009 2010 2015 2020 2025 2030 47
 48")
Summary of Revenue and Expenditure Projections (Dollars per Montana Resident) 48
 • Maintain lifetime consumption patterns")
Consumption Patterns § Life-cycle and permanent income hypotheses (true/false) • Maintain lifetime consumption patterns by. . . v. Saving while earning income v. Dissaving in retirement Elderly – spend less; little evidence of lifetime consumption patterns; maintain wealth by consuming less

Unknowns for the Elderly § Health § Life Expectancy § Household Independence

Income and Expenditures Source: Consumer Expenditure Survey, 2013

Expenditures by age § 25 -34 years old 52 § 75+ years Story: food – 14 to 9%; housing 36 to 26%; trans 19 to 11%; health 5 to 11%;

Food “at home” and “away”

Food “at home”

Summary and Conclusion 55

Summary & Conclusion • Aging will occur most rapidly in many of the rural areas of Eastern and Northern Montana. • Aging will occur least rapidly in the more urbanized areas and on Native American reservations. 56

Summary & Conclusion • Aging alone modest impacts on budgets of state and local governments. • While expenditures on the elderly for Medicaid and other services will rise, they will be offset by lower educational and correctional costs. 57

Summary & Conclusion § And while aging may reduce income tax revenues, these declines are likely to be offset by increased residential property taxes.

Summary & Conclusion The next two decades are likely to be significantly different than the last four, because there will be a smaller “demographic dividend. ” 59

Summary & Conclusion § Income Impacts • On the income side, the Baby Boomers will retire and women’s labor force participation rates are not expected to rise.

Implications for You § Demand • What nutrition-related services to the elderly demand from you? § Supply • What will you be willing to supply?

Questions 62
- Slides: 62