Programme Years Amount Winners Statement 89 On support


 Организации (кол-во публикаций в год")


- Slides: 38
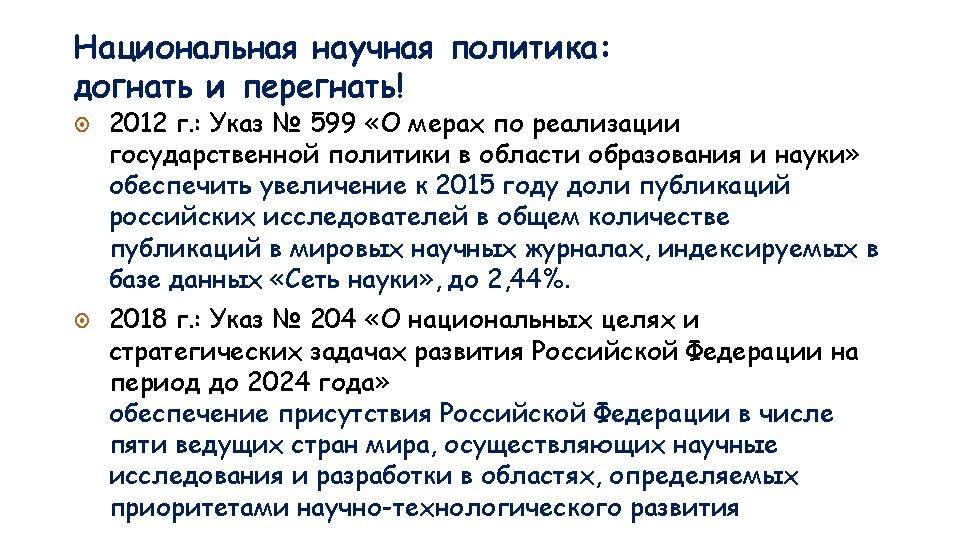
Национальная научная политика: Науку – в вузы! Programme Years Amount Winners Statement № 89 “On support measures for universities performing innovative educational 2006 -2008 $ 1. 5 B Universities FTOP `Educational Development´ 2006 -2010 2011 -2015 2016 -2020 $ 85 mln $ 4. 5 B $2 B Educational system in total Federal Universities 2007 -2009 $2 B Universities FTOP ‘Scientific and Scientific- Teaching Personnel of Innovative Russia’ 2009 -2013 $3 B 2014 -2020 Universities National research universities, National `Education´ project 2009 -2014 $ 1. 5 B Universities Statement № 218 on developing cooperation between universities and high-tech enterprises 2010 -2012 $ 0. 6 B Universities 2010 -… $ 5 M per grant Universities FTOP ‘Innovative Infrastructure’ 2010 -2012 $ 270 M Universities `5 -100 -2020´Competitiveness Improvement Programme 2013 -2019 $ 0. 7 B (2013 -2016) Universities Statement № 220 on attracting foreign scientists Block, M. , & Khvatova, T. (2017). University transformation: explaining policy making and trends in higher education in Russia. Journal of Management Development, 36(6), 761– 779. https: //doi. org/10. 1108/JMD-01 -2016 -0020
0 20 0 0 20 1 0 20 2 03 20 0 20 4 0 20 5 06 20 0 20 7 0 20 8 09 20 1 12 20 1 20 3 1 20 4 15 20 1 20 6 1 20 7 18 20 Растем! 120000 100000 80000 60000 Russian Federation 40000 20000 0
Сектора Chart Title 2017 Other Sectors 22% Other Sectors 26% Academic Institutions 44% Higher Education 29% Higher Education 54% Academic Institutions 24%
Регионы North Caucasus 1, 7% Volga-Vyatka East Siberian 1, 8% 2, 2% Central Black Earth Far East 0, 9% 0, 8% 1996 Central Black Far East Earth North Caucasus 2, 3% 2, 0% 3, 8% Volga-Vyatka 3, 2% East Siberian 2, 9% Volga 3, 3% Ural 4, 8% Central 43, 0% Volga 7, 2% West Siberia 8, 0% North West 12, 8% 2017 Central 59, 0% Ural 6, 9% West Siberia 12, 0% North West 12, 5%
0 0 Города (кол-во публикаций в год от 10) Организации (кол-во публикаций в год от 10) 200 1200 2018 2017 2016 2015 2014 2013 2012 2011 2010 2009 2008 2007 2006 2005 40 2004 60 2003 100 2002 140 2001 160 2000 0 20 1 0 20 2 0 20 3 0 20 4 0 20 5 0 20 6 0 20 7 0 20 8 0 20 9 1 20 0 1 20 1 1 20 2 1 20 3 1 20 4 1 20 5 1 20 6 1 20 7 18 20 Расширение географии 180 1000 800 120 600 80 400 20
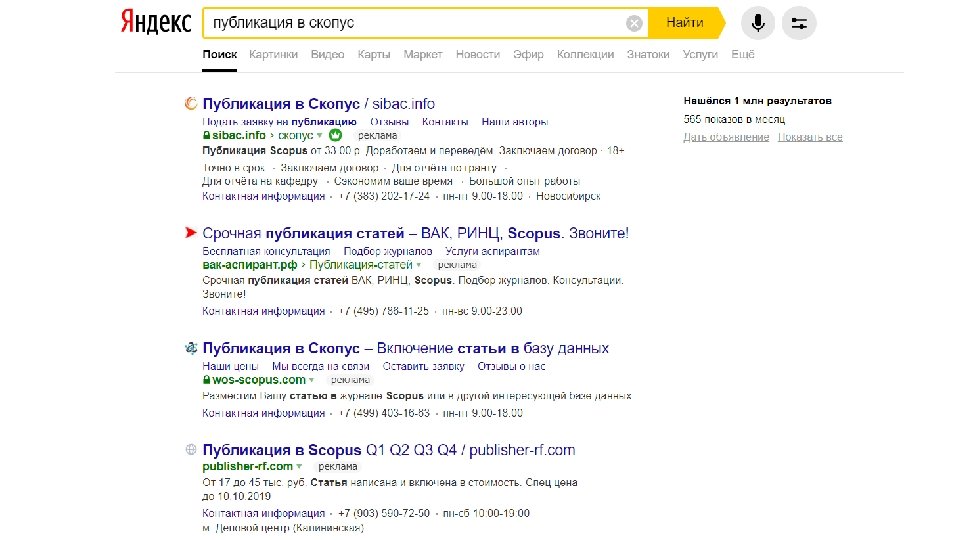
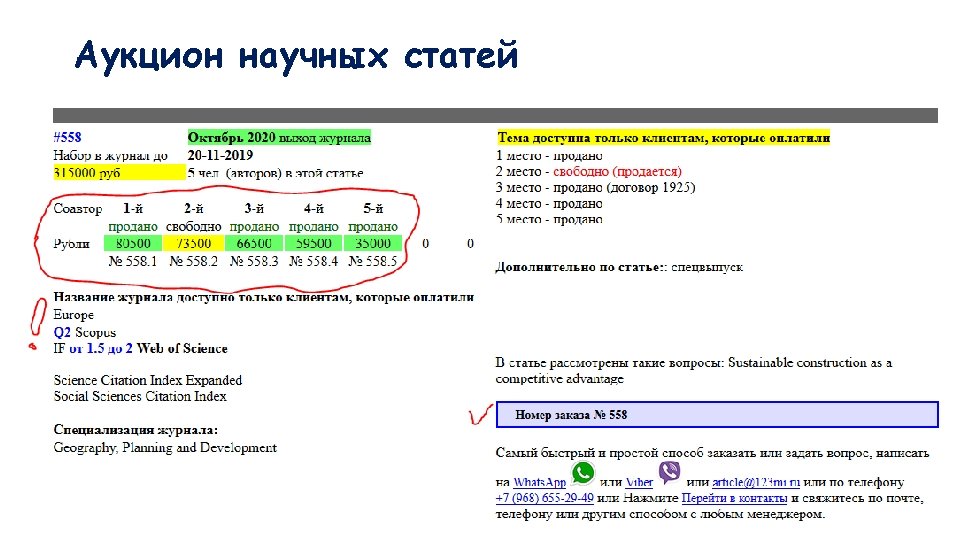
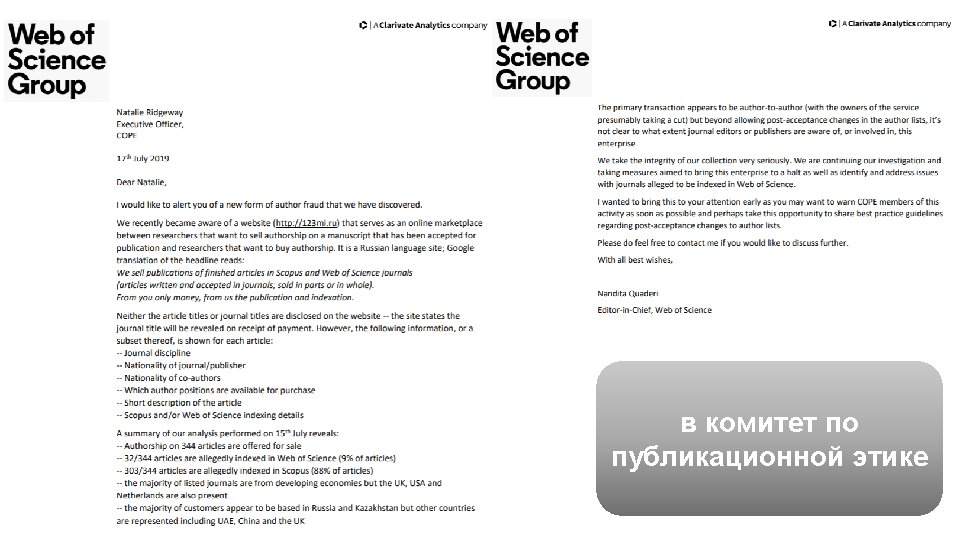
http: //123 mi. ru/
4. Хищнические журналы. Доля статей в 2015 -2017. Macháček V. , Srholec M. Predatory publications in Scopus: Evidence on cross-country differences. Prague: Charles University in Prague, Institute of Economic Studies (IES), 2019. № 20/2019.
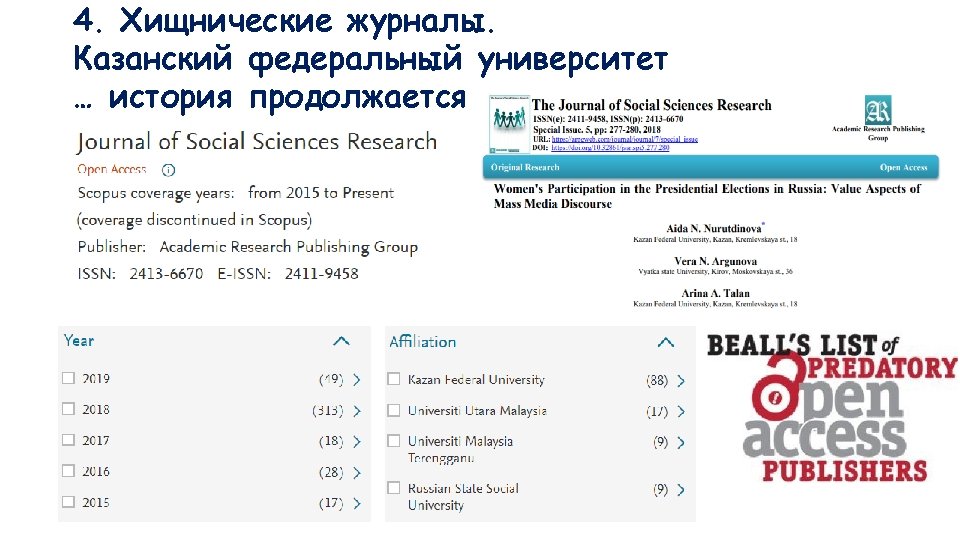
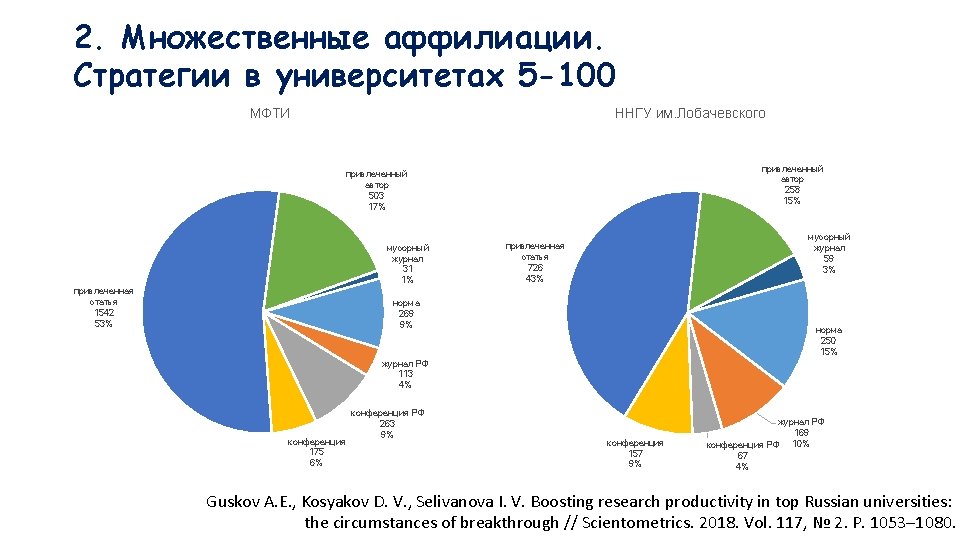
4. Хищнические журналы. Казанский федеральный университет 3000 мусорный журнал 2665 49% 2500 2000 1500 1000 привлеченный автор 297 5% 500 0 2010 норма 914 17% привлеченная статья 605 конференция 11% 148 3% 2011 2012 2013 2014 2015 конференция РФ 326 6% журнал РФ 462 9% 2016 Guskov A. E. , Kosyakov D. V. , Selivanova I. V. Boosting research productivity in top Russian universities: the circumstances of breakthrough // Scientometrics. 2018. Vol. 117, № 2. P. 1053– 1080.
1. Продвижение российских журналов в международные БД Кол-во российских журналов в Scopus 500 450 переводные журналы, издающиеся за рубежом 400 350 300 250 200 150 100 50 2017 2018 2016 2014 2015 2013 2012 2011 2010 2009 2008 2007 2006 2005 2004 2003 2002 2001 2000 0 http: //www. globalizationofscience. com/
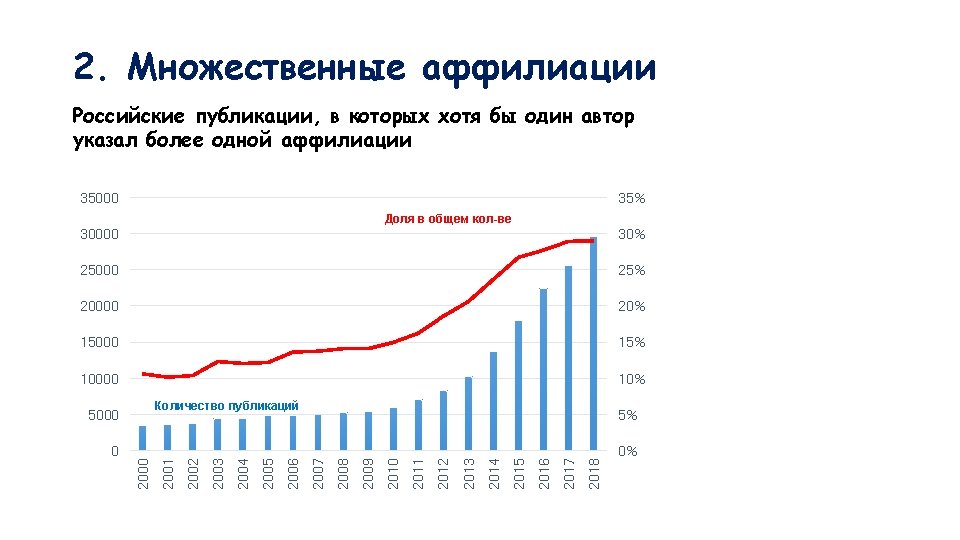
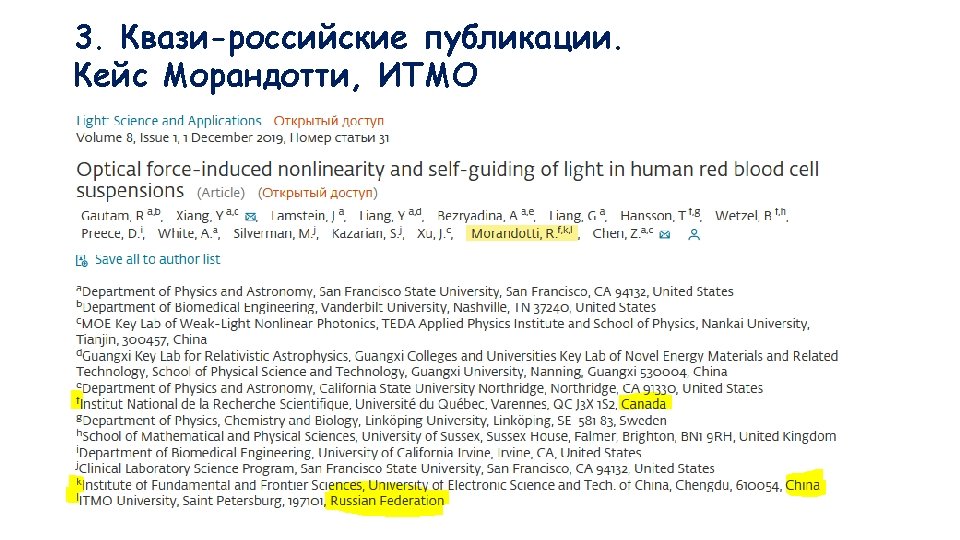
3. Квази-российские публикации, где российская аффилиация - только дополнительная Доля «зарубежных» публикаций в общем кол-ве публикаций в международных коллаборациях 5000 4500 20% 18% 4000 16% 3500 14% 3000 12% 2500 10% Количество «зарубежных» публикаций 2018 2017 2016 2015 2014 2013 2012 2011 2010 2009 0% 2008 0 2007 2% 2006 500 2005 4% 2004 1000 2003 6% 2002 1500 2001 8% 2000 D. Kosyakov, A. Guskov. Synchronous scientific mobility and international collaboration: case of Russia // Proceedings of the 17 th International Conference on Scientometrics & Informetrics ISSI 2019 with a Special STI Indicators Conference Track, 2 -5 September 2019, Sapienza University of Rome, Italy
World Share of CP Russia Share of CP Зарубеж РФ 2018 2017 2016 2015 2014 2013 2012 2010 2009 2008 2007 2006 2005 2004 2003 2002 2001 2000 2018 2017 2016 2015 0 2014 0% 2013 5000 2012 5% 2011 10000 2010 10% 2009 15000 2008 15% 2007 20000 2006 20% 2005 25000 2004 25% 2003 30000 2002 30% 2001 Конференции в РФ (кол-во публикаций) 2000 Доля публикаций в трудах конференций в России и в мире 2011 4. Публикация трудов российских конференций в индексируемых сериях
НАЦИОНАЛЬНЫЙ ИССЛЕДОВАТЕЛЬСКИЙ МОСКОВСКИЙ ГОСУДАРСТВЕННЫЙ СТРОИТЕЛЬНЫЙ УНИВЕРСИТЕТ 17 то с е м Публикации МГСУ Конференции - 2018 1600 город организ ация конференция 1400 Москва МГСУ 21 st International Scientific Conference on Advanced in Civil Engineering: Construction - The Formation of Living Environment, FORM 2018 225 Москва МГСУ 6 th International Scientific Conference on Integration, Partnership and Innovation in Construction Science and Education, IPICSE 2018 215 Хошимин, Вьетнам МГСУ, UAH 2018 International Scientific Conference Environmental Science for Construction Industry, ESCI 2018 127 Самара Сам. ГТУ 2017 International Scientific Conference on High-Rise Construction, HRC 2017 106 Санкт. Петербург СПб. ПУ 2017 International Science Conference on Business Technologies for Sustainable Urban Development, SPb. WOSCE 2017 99 Ростов на Дону МГСУ + 27 th Russian-Polish-Slovak Seminar, Theoretical Foundation of Civil Engineering (27 RSP), TFo. CE 2018 79 Самара Сам. ГТУ 19 th International scientific conference Energy Management of Municipal Transportation Facilities and Transport, EMMFT 2017 64 Владивосток ДВФУ International Multi-Conference on Industrial Engineering and Modern Technologies 2018 52 1200 1000 800 600 кол-во статей 400 Другое 2018 2017 2016 2015 2014 2013 2012 2011 2010 2009 2008 2007 2006 2005 2004 2003 2002 2001 0 200 Конференции
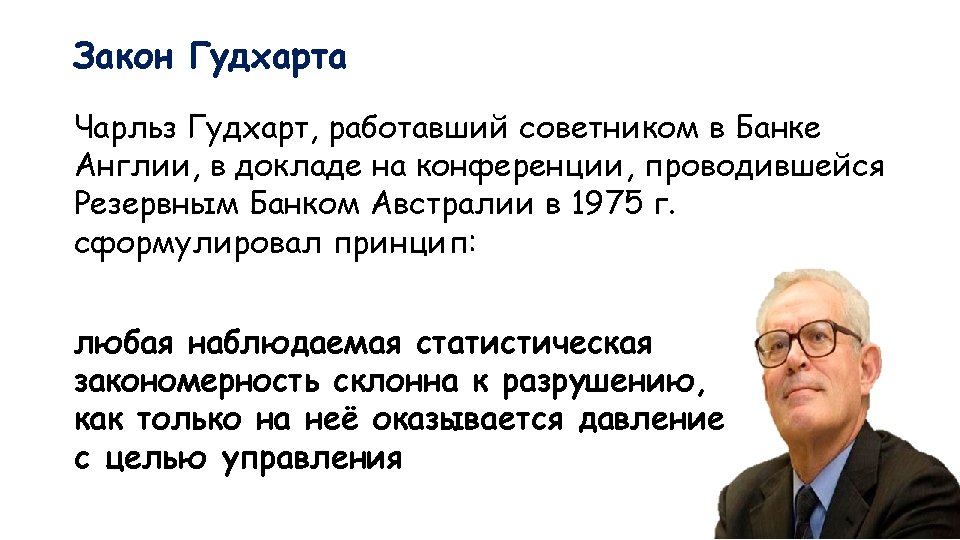
Особый русский путь? Опять нет… The driving force behind the Australian trends appears to lie with the increased culture of evaluation faced by the sector. Significant funds are distributed to universities, and within universities, on the basis of aggregate publication counts, with little attention paid to the impact or quality of that output. In consequence, journal publication productivity has increased significantly in the last decade, but its impact has declined. By analyzing data on over 1, 000 scientists in a Korean university over a nine-year period, the present study suggests that performance-based incentive systems may work effectively in academia. As the university increased its financial rewards for publication quantity and quality, both the number of publications and the average impact factor of the target journal improved. However, raising the minimum publication requirements for promotion increased publication quantity but reduced publication quality. Butler, L. (2003). Explaining australia's increased share of ISI publications - the effects of a funding formula based on publication counts. Research Policy, 32(1), 143155. doi: 10. 1016/S 0048 -7333(02)00007 -0 Kim, D. H. , & Bak, H. -. (2016). How do scientists respond to performance-based incentives? evidence from South Korea. International Public Management Journal, 19(1), 31 -52. doi: 10. 1080/10967494. 2015. 1032460