Programmable Measurement Architecture for Data Centers Minlan Yu

Programmable Measurement Architecture for Data Centers Minlan Yu University of Southern California 1

Management = Measurement + Control • Traffic engineering, load balancing – Identify large traffic aggregates, traffic changes – Understand flow properties (size, entropy, etc. ) • Performance diagnosis, troubleshooting – Measure delay, throughput for individual flows • Accounting – Count resource usage for tenants 2

Measurement Becoming Increasingly Important Dramatically expanding data centers Rapidly changing technologies Provide network-wide visibility at scale Monitor the impact of new technology Increasing network utilization Quickly identify failures and effects 3
Problems of measurement support in today’s data centers 4

Lack of Resource Efficiency Too much data with increasing link speed & scale Operators: Passively analyze the data they have No way to create the data they want Network devices: Limited resources for measurement Heavy sampling in Net. Flow/s. Flow Missing important flows We need efficient measurement support at devices to create the data we want within resource constraints 5
Lack of Generic Abstraction • Researchers design solutions for specific queries – Identifying big flows (heavy hitters), flow changes – DDo. S detection, anomaly detection • Hard to support point solutions in practice – Vendors have no generic support – Operators write their own scripts for different systems We need a generic abstraction for operators to program different measurement queries 6
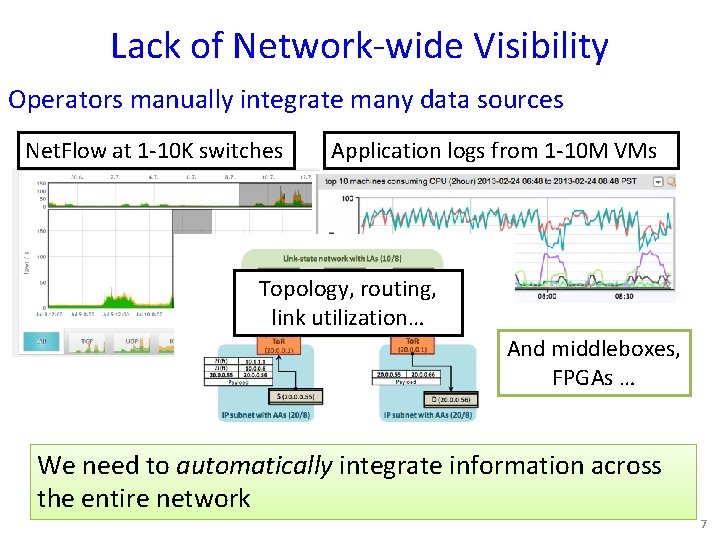
Lack of Network-wide Visibility Operators manually integrate many data sources Net. Flow at 1 -10 K switches Application logs from 1 -10 M VMs Topology, routing, link utilization… And middleboxes, FPGAs … We need to automatically integrate information across the entire network 7

Challenges for Measurement Support Expressive queries (Traffic volumes, changes, anomalies) Network-wide visibility (hosts, switches) Our Solution: Dynamically collect and automatically integrate the right data, at the right place and the right time Resource efficiency (Limited CPU/Mem at devices) 8
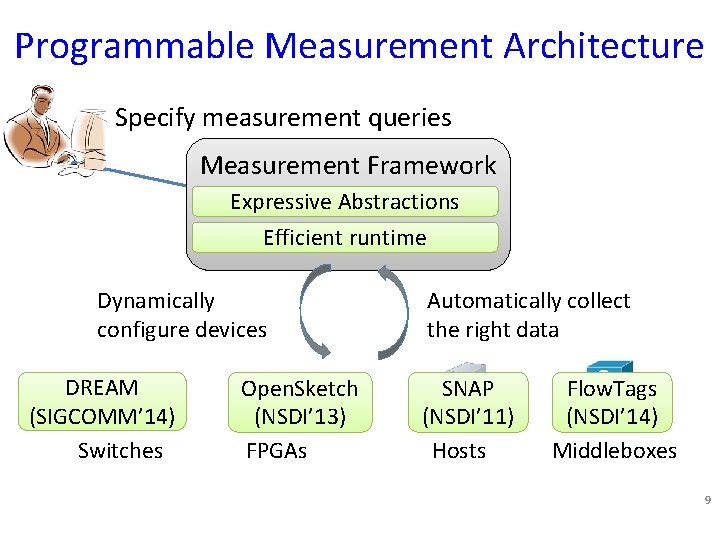
Programmable Measurement Architecture Specify measurement queries Measurement Framework Expressive Abstractions Efficient runtime Dynamically configure devices DREAM (SIGCOMM’ 14) Switches Open. Sketch (NSDI’ 13) FPGAs Automatically collect the right data SNAP (NSDI’ 11) Hosts Flow. Tags (NSDI’ 14) Middleboxes 9
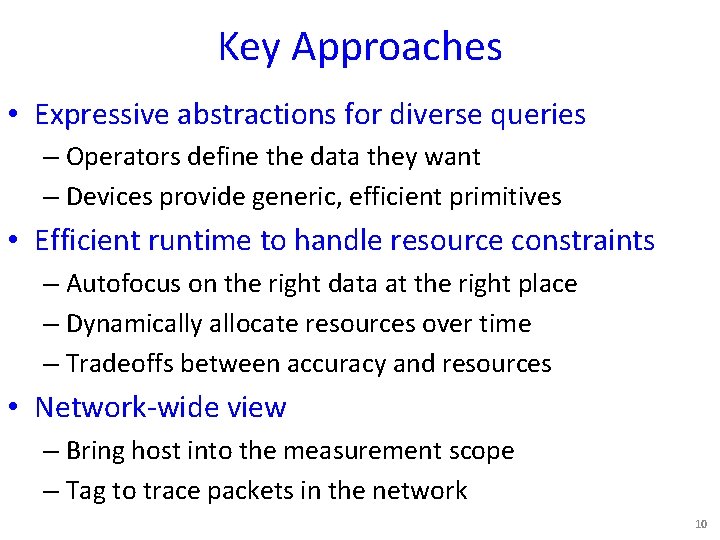
Key Approaches • Expressive abstractions for diverse queries – Operators define the data they want – Devices provide generic, efficient primitives • Efficient runtime to handle resource constraints – Autofocus on the right data at the right place – Dynamically allocate resources over time – Tradeoffs between accuracy and resources • Network-wide view – Bring host into the measurement scope – Tag to trace packets in the network 10

Programmable Measurement Architecture Specify measurement queries Measurement Framework Expressive Abstractions Efficient runtime Dynamically configure devices DREAM (SIGCOMM’ 14) Switches Open. Sketch (NSDI’ 13) FPGAs Automatically collect the right data SNAP (NSDI’ 11) Hosts Flow. Tags (NSDI’ 14) Middleboxes 11
Switches DREAM: dynamic flow-based measurement (SIGCOMM’ 14) 12
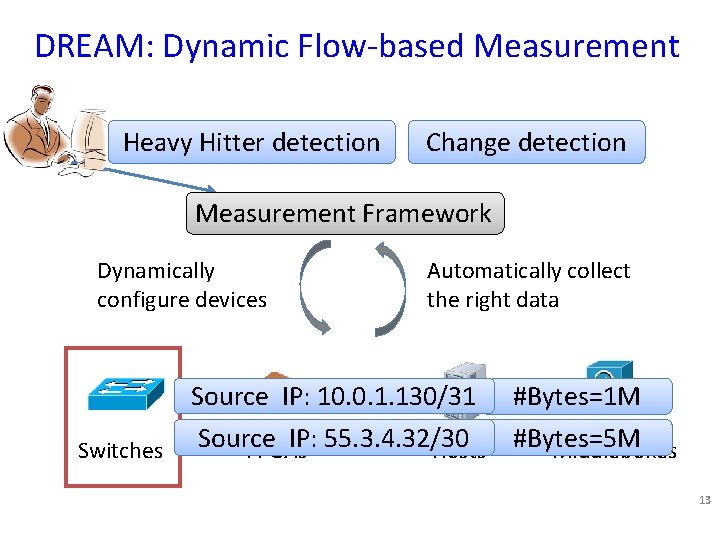
DREAM: Dynamic Flow-based Measurement Heavy Hitter detection Change detection Measurement Framework Dynamically configure devices Automatically collect the right data Source IP: 10. 0. 1. 130/31 #Bytes=1 M IP: 55. 3. 4. 32/30 Switches Source FPGAs Hosts #Bytes=5 M Middleboxes 13
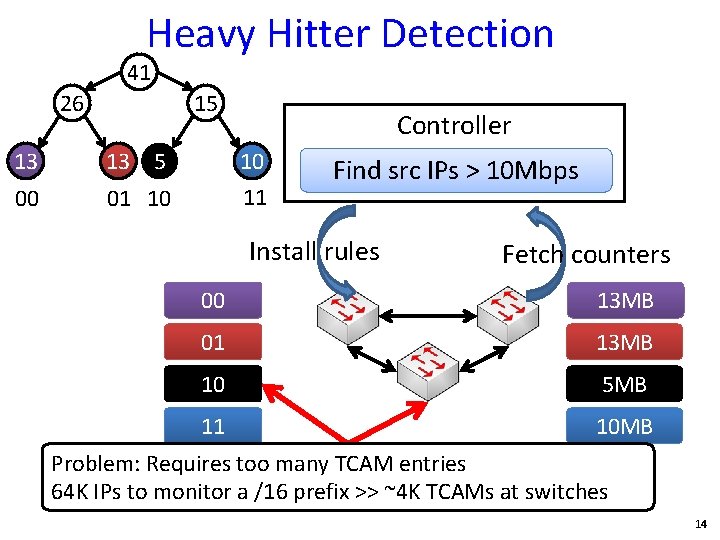
Heavy Hitter Detection 41 26 15 13 13 5 00 01 10 Controller 10 11 Find src IPs > 10 Mbps Install rules Fetch counters 00 13 MB 01 13 MB 10 5 MB 11 10 MB Problem: Requires too many TCAM entries 64 K IPs to monitor a /16 prefix >> ~4 K TCAMs at switches 14
Key Problem How to support many concurrent measurement queries with limited TCAM resources at commodity switches? 15
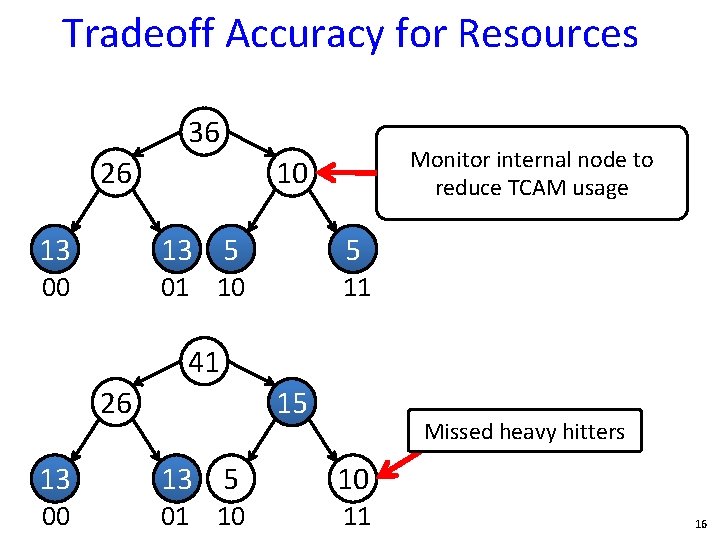
Tradeoff Accuracy for Resources 36 26 Monitor internal node to reduce TCAM usage 10 13 13 5 5 00 01 10 11 41 26 15 Missed heavy hitters 13 13 5 10 00 01 10 11 16
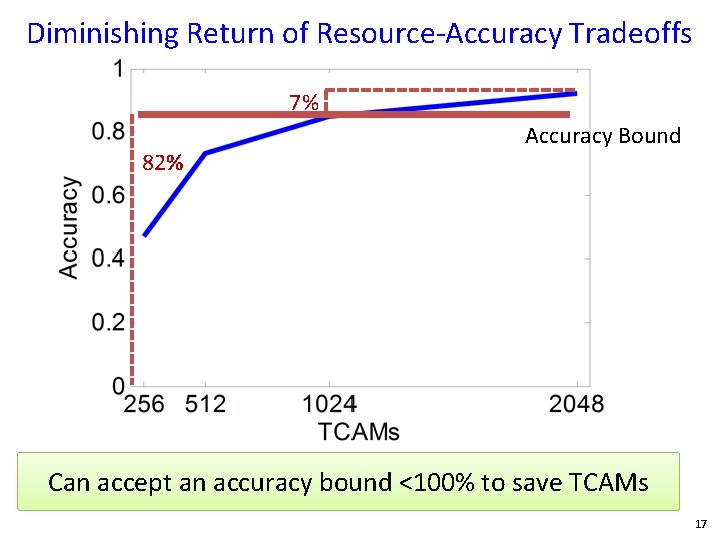
Diminishing Return of Resource-Accuracy Tradeoffs 7% 82% Accuracy Bound Can accept an accuracy bound <100% to save TCAMs 17
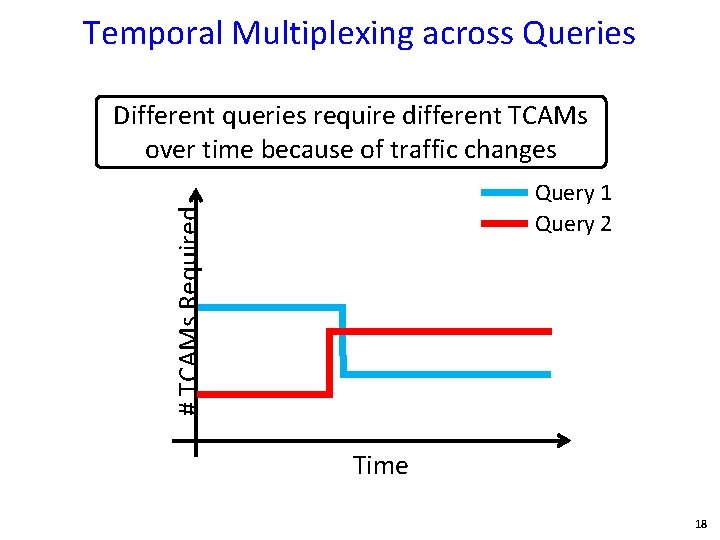
Temporal Multiplexing across Queries Different queries require different TCAMs over time because of traffic changes # TCAMs Required Query 1 Query 2 Time 18
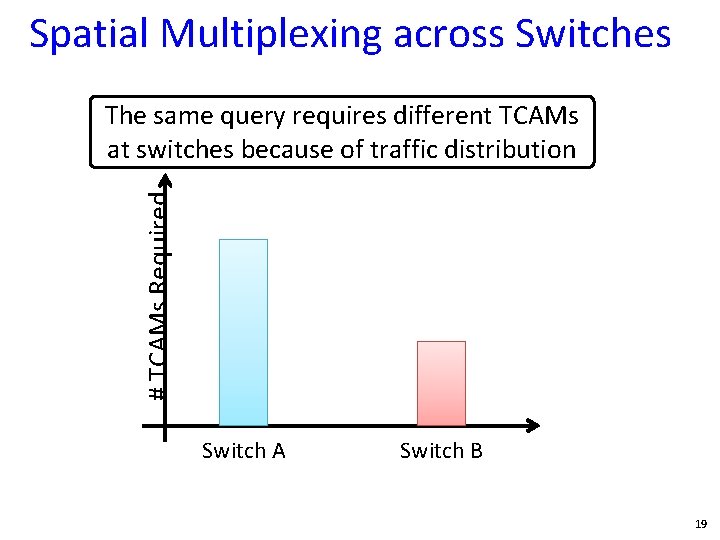
Spatial Multiplexing across Switches # TCAMs Required The same query requires different TCAMs at switches because of traffic distribution Switch A Switch B 19
Insights and Challenges • Leverage resource-accuracy tradeoffs – Challenge: Cannot know the accuracy groundtruth – Solution: Online accuracy algorithm • Temporal multiplexing across queries – Challenge: Required resources change over time – Solution: Dynamic resource allocation algorithm rather than one shot optimization • Spatial multiplexing across switches – Challenge: Query accuracy depends on multiple switches – Solution: Consider both overall query accuracy and perswitch accuracy 20
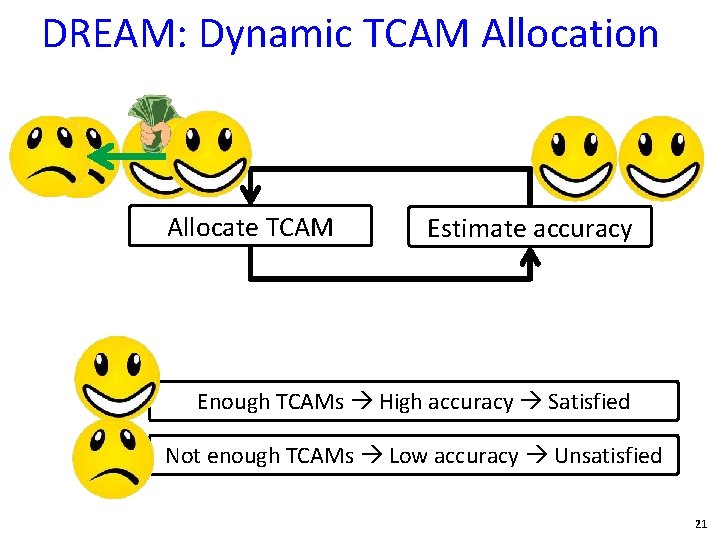
DREAM: Dynamic TCAM Allocation Allocate TCAM Estimate accuracy Enough TCAMs High accuracy Satisfied Not enough TCAMs Low accuracy Unsatisfied 21
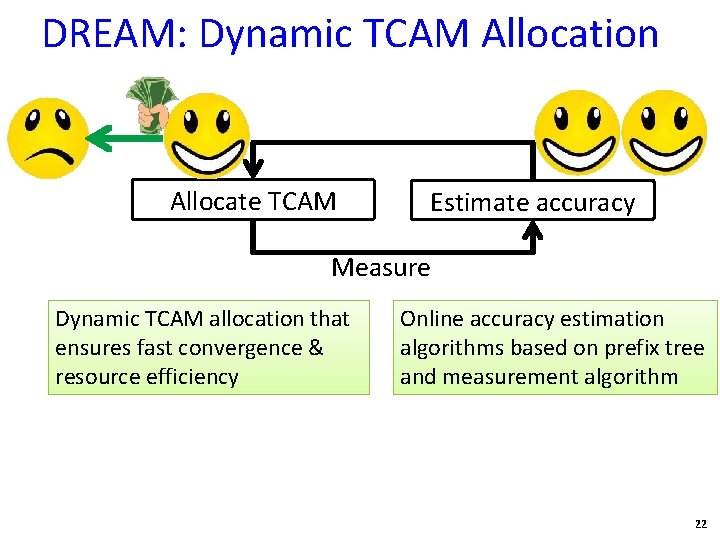
DREAM: Dynamic TCAM Allocation Allocate TCAM Estimate accuracy Measure Dynamic TCAM allocation that ensures fast convergence & resource efficiency Online accuracy estimation algorithms based on prefix tree and measurement algorithm 22
Prototype and Evaluation • Prototype – Built on Floodlight controller and Open. Flow switches – Support heavy hitters, hierarchical HH, and change detection • Evaluation – Maximize #queries with accuracy guarantees – Significantly outperforms fixed allocation – Scales well to larger networks 23
DREAM Takeaways • DREAM: an efficient runtime for resource allocation – Support many concurrent measurement queries – With today’s flow-based switches • Key Approach – Spatial & Temporal resource multiplexing across queries – Tradeoff accuracy for resources • Limitations – Can only support heavy hitters and change detection – Due to the limited interfaces at switches 24
Reconfigurable Devices Open. Sketch: Sketch-based measurement (NSDI’ 13) 25
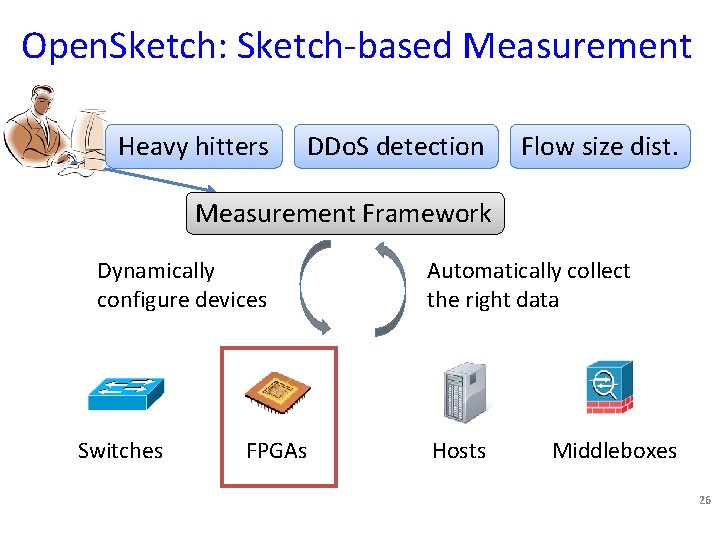
Open. Sketch: Sketch-based Measurement Heavy hitters DDo. S detection Flow size dist. Measurement Framework Dynamically configure devices Switches FPGAs Automatically collect the right data Hosts Middleboxes 26
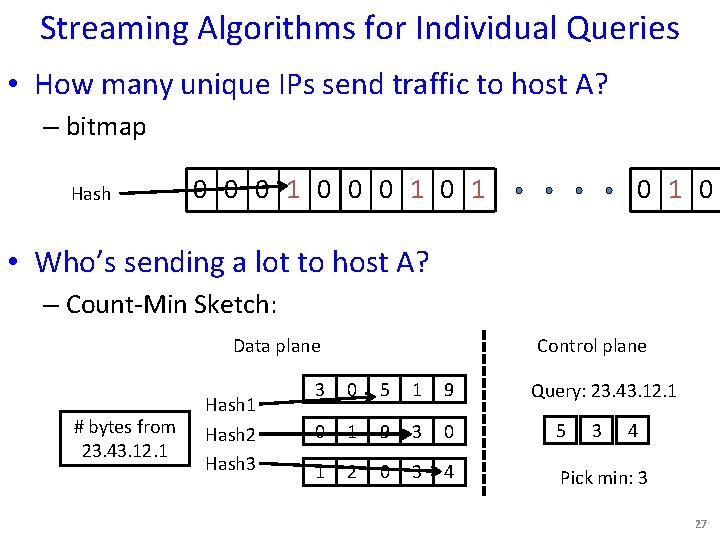
Streaming Algorithms for Individual Queries • How many unique IPs send traffic to host A? – bitmap Hash 0 0 0 1 0 1 0 • Who’s sending a lot to host A? – Count-Min Sketch: Data plane # bytes from 23. 43. 12. 1 Hash 2 Hash 3 Control plane 3 0 5 1 9 0 1 9 3 0 5 1 2 0 3 4 Pick min: 3 Query: 23. 43. 12. 1 3 4 27
Generic and Efficient Measurement • Streaming algorithms are efficient, but not general – Require customized hardware or network processors – Hard to implement all solutions in one device • Open. Sketch: New measurement support at FGPAs – General and efficient data plane based on sketches – Easy to implement at reconfigurable devices – Modularized control plane with automatic configuration 28

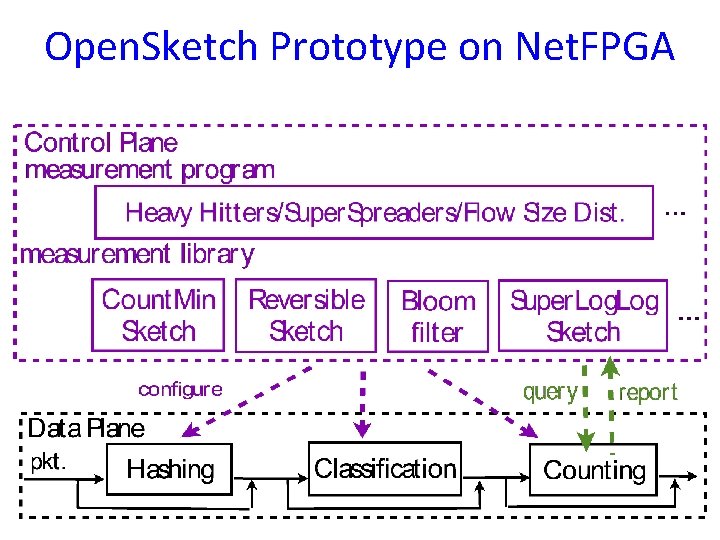
Flexible Data Plane Picking the packets to measure Classifying a set of flows (e. g. , Bloom filter for blacklisting IP set) Filtering traffic (e. g. , from host A) Storing & exporting data Diverse mappings between counters & flows (e. g. , more counters for elephant flows) 29
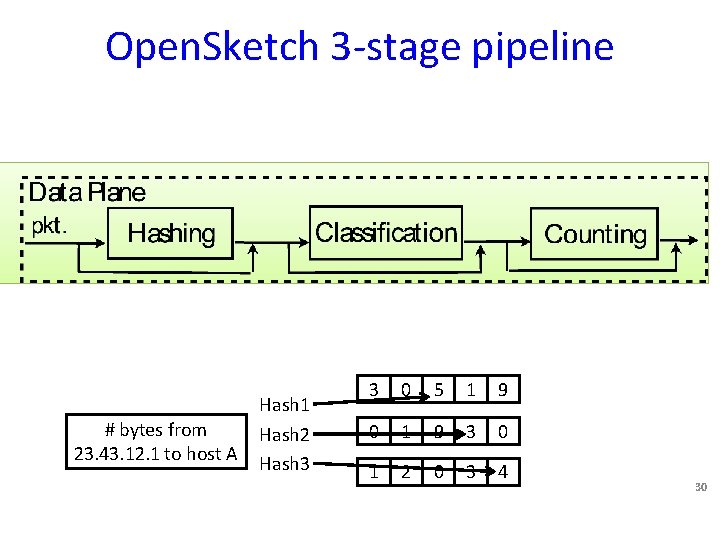
Open. Sketch 3 -stage pipeline # bytes from 23. 43. 12. 1 to host A Hash 1 Hash 2 Hash 3 3 0 5 1 9 0 1 9 3 0 1 2 0 3 4 30
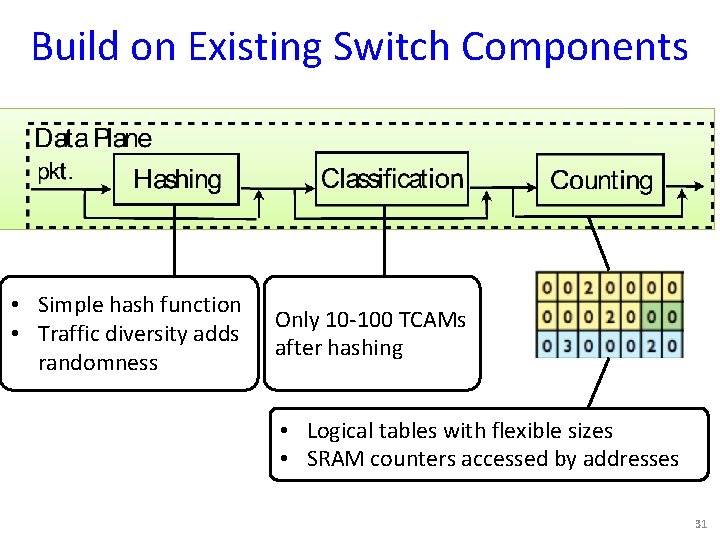
Build on Existing Switch Components • Simple hash function • Traffic diversity adds randomness Only 10 -100 TCAMs after hashing • Logical tables with flexible sizes • SRAM counters accessed by addresses 31
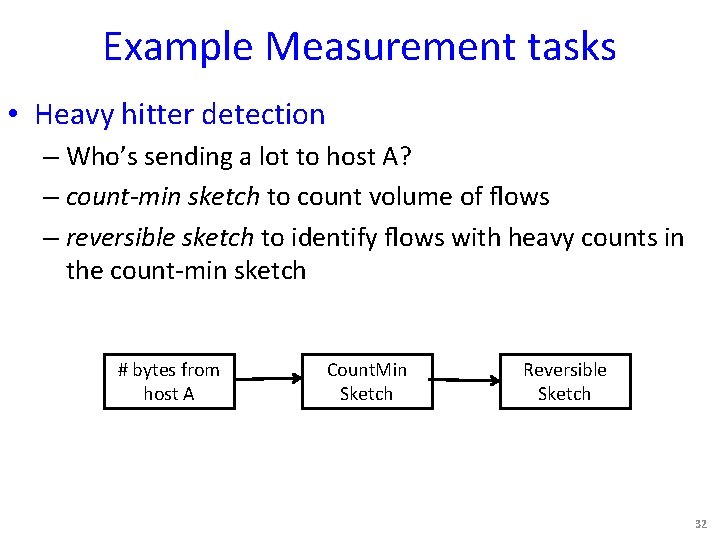
Example Measurement tasks • Heavy hitter detection – Who’s sending a lot to host A? – count-min sketch to count volume of flows – reversible sketch to identify flows with heavy counts in the count-min sketch # bytes from host A Count. Min Sketch Reversible Sketch 32

Support Many Measurement Tasks Measurement Programs Building blocks Line of Code Heavy hitters Count-min sketch; Reversible sketch Config: 10 Query: 20 Superspreaders Count-min sketch; Bitmap; Reversible sketch Count-min sketch; Reversible sketch Config: 10 Query: : 14 Config: 10 Query: 30 Traffic entropy on Multi-resolution classifier; port field Count-min sketch Config: 10 Query: 60 Traffic change detection Flow size distribution multi-resolution classifier; hash Config: 10 table Query: 109 33
Open. Sketch Prototype on Net. FPGA
Open. Sketch Takeaways • Open. Sketch: New programmable data plane design – Generic support for more types of queries – Easy to implement with reconfigurable devices – More efficient than Net. Flow measurement • Key approach – Generic abstraction for many streaming algorithms – Provable resource-accuracy tradeoffs • Limitations – Only works for traffic measurement inside the network – No access to application level information 35
Hosts SNAP: Profiling network-application interactions (NSDI’ 11) 36
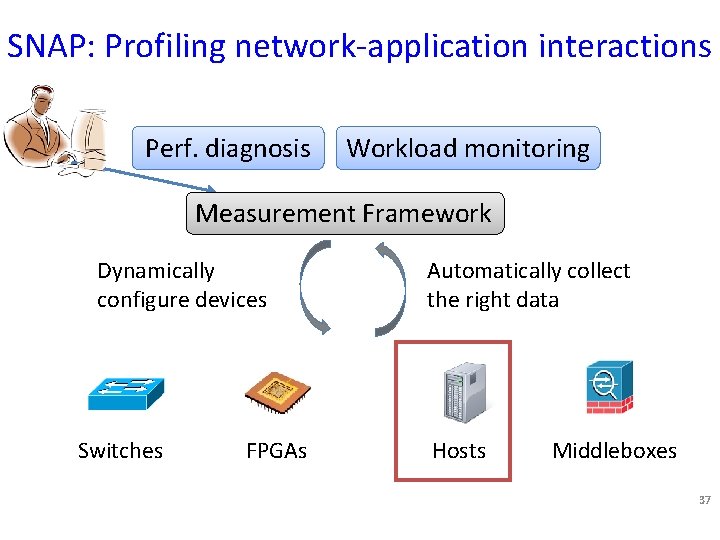
SNAP: Profiling network-application interactions Perf. diagnosis Workload monitoring Measurement Framework Dynamically configure devices Switches FPGAs Automatically collect the right data Hosts Middleboxes 37
Challenges of Datacenter Diagnosis • Large complex applications – Hundreds of application components – Tens of thousands of servers • New performance problems – Update code to add features or fix bugs – Change components while app is still in operation • Old performance problems (Human factors) – Developers may not understand network well – Nagle’s algorithm, delayed ACK, etc. 38
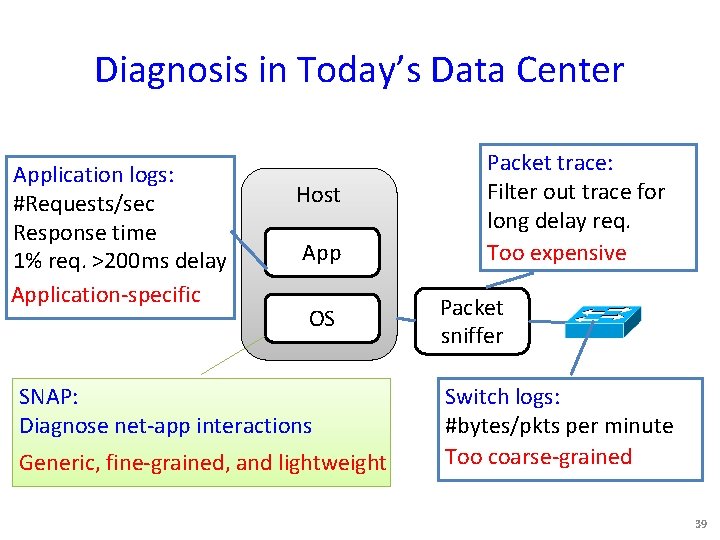
Diagnosis in Today’s Data Center Application logs: #Requests/sec Response time 1% req. >200 ms delay Application-specific Host App OS SNAP: Diagnose net-app interactions Generic, fine-grained, and lightweight Packet trace: Filter out trace for long delay req. Too expensive Packet sniffer Switch logs: #bytes/pkts per minute Too coarse-grained 39
SNAP: A Scalable Net-App Profiler that runs everywhere, all the time 40

SNAP Architecture Online, lightweight processing & diagnosis Offline, cross-conn diagnosis Management System Topology, routing Conn proc/app At each host for every connection Collect data Performance Classifier Crossconnection correlation Offending app, host, link, or switch Adaptively Classifying polling per-socket based on the statistics stagesinof. OS data transfer - Snapshots - Sender (#bytes app send in send buffer) buffer network receiver - Cumulative counters (#Fast. Retrans) 41

Programmable SNAP • Virtual tables at hosts – Lazy update to the controller #Bytes in send buffer, #Fast. Retrans … App CPU usage, App mem usage, … • SQL like query language at the controller def query. Test(): q = (Select(‘app’, ‘Fast. Retrans’) * From('Host. Connection') * Where(('app', '==', ’web service’)) * Every(5 mintue)) return q 42
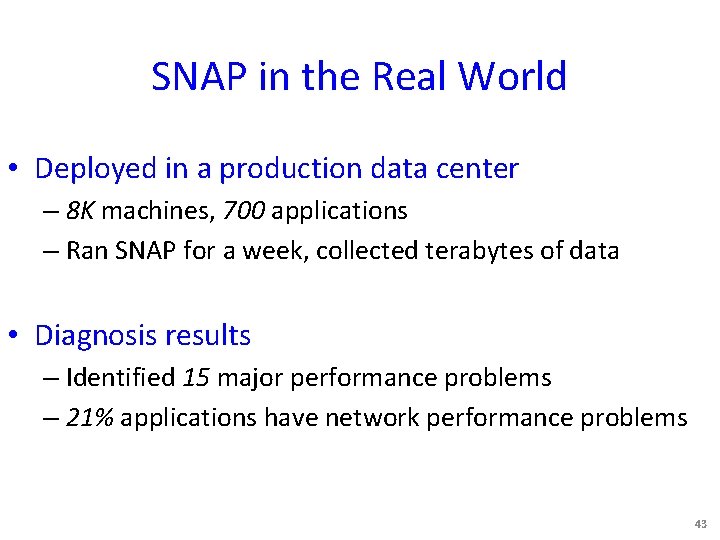
SNAP in the Real World • Deployed in a production data center – 8 K machines, 700 applications – Ran SNAP for a week, collected terabytes of data • Diagnosis results – Identified 15 major performance problems – 21% applications have network performance problems 43
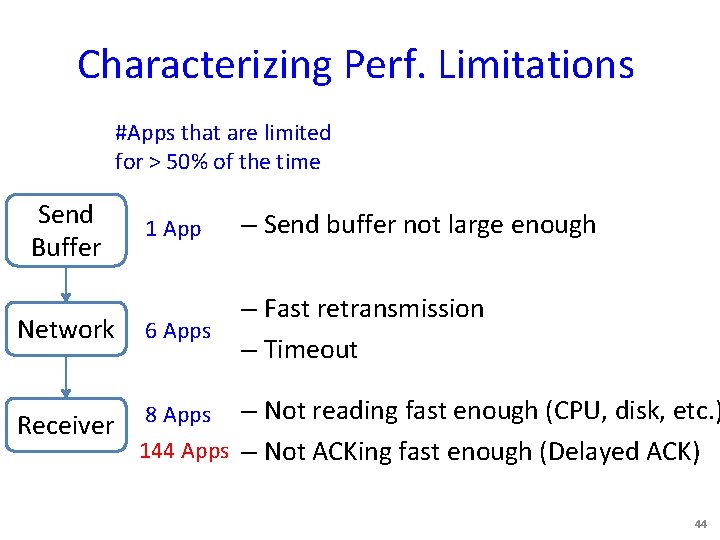
Characterizing Perf. Limitations #Apps that are limited for > 50% of the time Send Buffer 1 App – Send buffer not large enough Network 6 Apps – Fast retransmission – Timeout Receiver 8 Apps – Not reading fast enough (CPU, disk, etc. ) 144 Apps – Not ACKing fast enough (Delayed ACK) 44
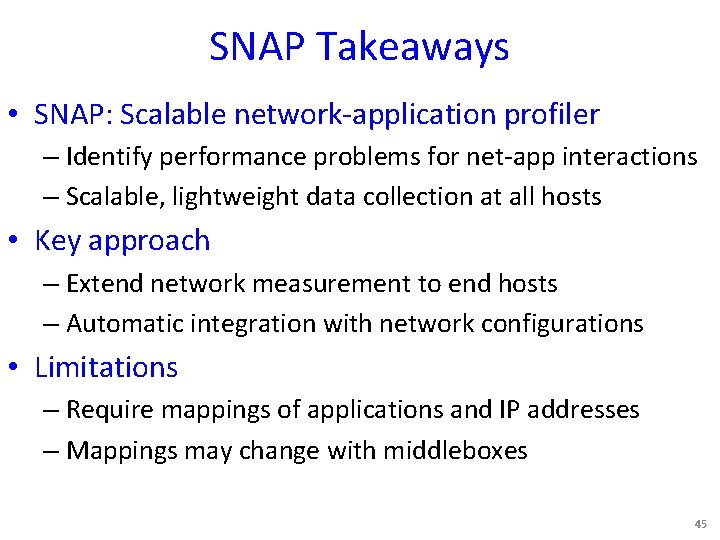
SNAP Takeaways • SNAP: Scalable network-application profiler – Identify performance problems for net-app interactions – Scalable, lightweight data collection at all hosts • Key approach – Extend network measurement to end hosts – Automatic integration with network configurations • Limitations – Require mappings of applications and IP addresses – Mappings may change with middleboxes 45
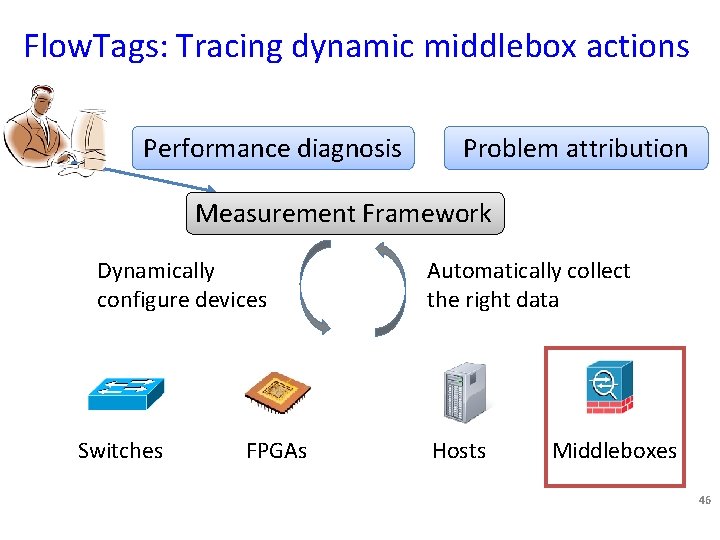
Flow. Tags: Tracing dynamic middlebox actions Performance diagnosis Problem attribution Measurement Framework Dynamically configure devices Switches FPGAs Automatically collect the right data Hosts Middleboxes 46
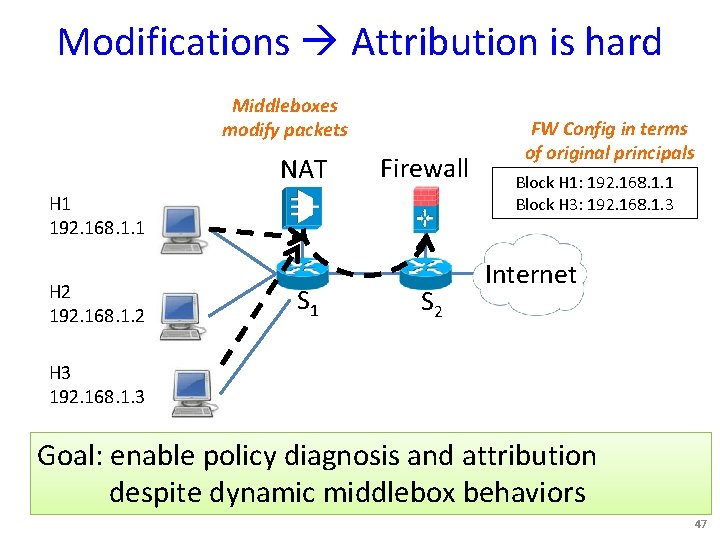
Modifications Attribution is hard Middleboxes modify packets NAT Firewall H 1 192. 168. 1. 1 H 2 192. 168. 1. 2 S 1 S 2 FW Config in terms of original principals Block H 1: 192. 168. 1. 1 Block H 3: 192. 168. 1. 3 Internet H 3 192. 168. 1. 3 Goal: enable policy diagnosis and attribution despite dynamic middlebox behaviors 47
Flow. Tags Key Ideas • Middleboxes need to restore SDN tenets – Strong bindings between a packet and its origins – Explicit policies decide the paths that packets follow • Add missing contextual information as Tags – NAT gives IP mappings – Proxy provides cache hit/miss info • Flow. Tags controller configures tagging logic 48
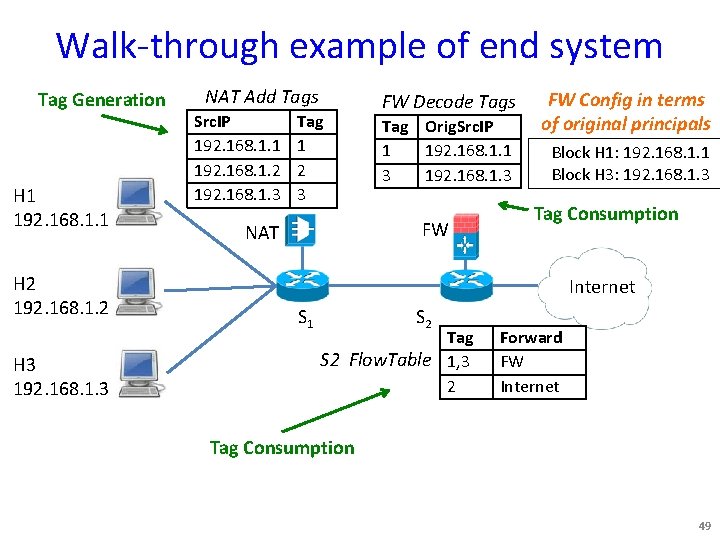
Walk-through example of end system Tag Generation H 1 192. 168. 1. 1 H 2 192. 168. 1. 2 H 3 192. 168. 1. 3 NAT Add Tags Src. IP 192. 168. 1. 1 192. 168. 1. 2 192. 168. 1. 3 Tag 1 2 3 FW Decode Tags Tag Orig. Src. IP 1 192. 168. 1. 1 3 192. 168. 1. 3 FW NAT FW Config in terms of original principals Block H 1: 192. 168. 1. 1 Block H 3: 192. 168. 1. 3 Tag Consumption Internet S 1 S 2 Tag S 2 Flow. Table 1, 3 2 Forward FW Internet Tag Consumption 49
Flow. Tags Takeaways • Flow. Tags: Handle dynamic packet modifications – Support policy verification, testing, and diagnosis – Use tags to record packet modifications – 25 -75 lines of code changes at middleboxes – <1% overhead to middlebox processing • Key approach – Tagging at one place for attribution at other places 50
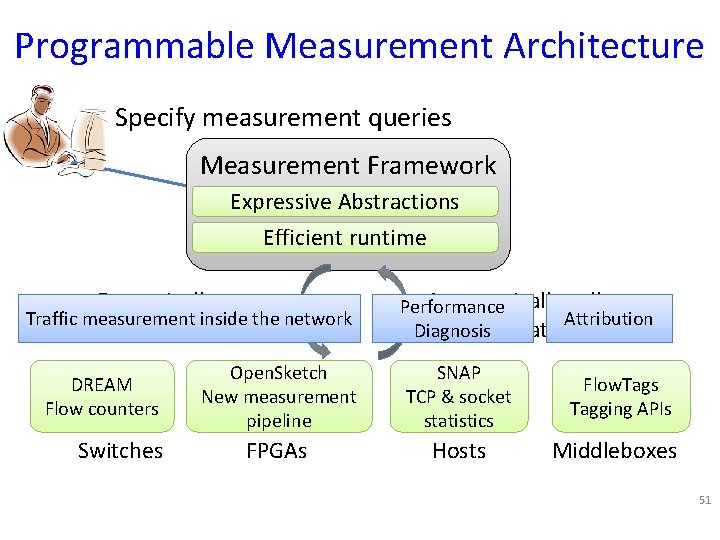
Programmable Measurement Architecture Specify measurement queries Measurement Framework Expressive Abstractions Efficient runtime Dynamically Traffic measurement inside the network configure devices DREAM Flow counters Switches Automatically collect Performance Attribution Diagnosis the right data Open. Sketch New measurement pipeline SNAP TCP & socket statistics FPGAs Hosts Flow. Tags Tagging APIs Middleboxes 51
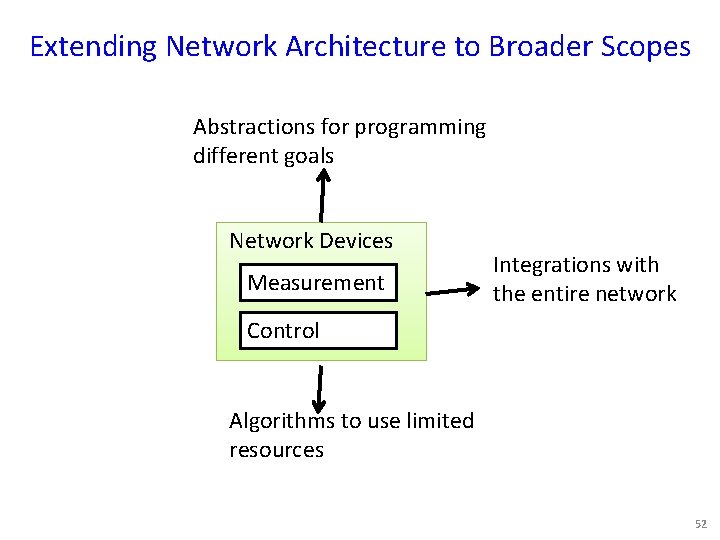
Extending Network Architecture to Broader Scopes Abstractions for programming different goals Network Devices Measurement Integrations with the entire network Control Algorithms to use limited resources 52
Thanks to my Collaborators • USC: Ramesh Govindan, Rui Miao, Masoud Moshref • Princeton – Jennifer Rexford, Lavanya Jose, Peng Sun, Mike Freedman, David Walker • CMU: Vyas Sekar, Seyed Fayazbakhsh • Google: Amin Vahdat, Jeff Mogul • Microsoft – Albert Greenberg, Lihua Yuan, Dave Maltz, Changhoon Kim, Srinkath Kandula 53

54
- Slides: 54