Program development process at Queens University to demonstrate


: • Set up a comprehensive process limited")


 Faculty-wide curriculum committee Dean’s Retreat Curriculum")


 Content area Critically")

 of expectations reduces variability between graders, makes expectations")


")


 50 40 30")


 Project")
 Project")
 Project")
 Project")

- Slides: 62
Program development process at Queen’s University to demonstrate graduate attributes Brian Frank Director (Program Development) Faculty of Engineering and Applied Science Queen's University 1
Focus “The institution must demonstrate that the graduates of a program possess the attributes under the following headings. . . There must be processes in place that demonstrate that program outcomes are being assessed in the context of these attributes, and that the results are applied to the further development of the program. ” 2
CEAB Instructions Describe the processes that are being or are planned to be used. This must include: a) a set of indicators that describe specific abilities expected of students to demonstrate each attribute b) where attributes are developed and assessed within the program… c) how the indicators were or will be assessed. This could be based on assessment tools that include, but are not limited to, reports, oral presentations, … d) evaluation of the data collected including analysis of student performance relative to program expectations e) discussion of how the results will be used to further develop the program f) a description of the ongoing process used by the program to assess and develop the program as described in (a)-(e) above 3 Engineering Graduate Attribute Development (EGAD) Project
Approach • Short term objectives (2010 -2011): • Set up a comprehensive process limited to a small number of courses to help programs understand the process • Use data to help faculty see value in outcomes assessment for program improvement • Long term: • Comprehensive assessment of all attributes throughout programs • Evaluate validity of data • Students take responsibility for demonstrating some attributes
Queen's University timeline Summer 2009: Working groups of faculty, students, topical experts created specific programwide indicators (next slide, and in Appendix 3. 1 A) Summer 2009: Setup learning management system (Moodle) to manage assessments Sept 2009 -April 2010: Piloted assessment in first year Sept 2010 -April 2011: Piloted assessment in first year, faculty wide second year, and fourth year (common across programs) April – July 2011: Student surveys and focus groups, curriculum mapping, data analysis Curriculum planning happening throughout
Why initial emphasis on first year? • First year is faculty-delivered, core to all students • Provides opportunity to pilot a process • Help disseminate outcomes assessment procedures to other instructors • Long term: assessment process continue in first year program to inform development
Aside: Idealistic course development process Create and Execute a Plan Analyze and evaluate data Deliver, grade, seek feedback Overall Improvement Identify course objectives and content Student input Create specific outcomes for each class Identify appropriate tools to assess (reports, simulation, tests, . . . ) Map to experiences (lectures, projects, labs, etc. ) 7 Engineering Graduate Attribute Development (EGAD) Project
Program-wide assessment process flow Create a Program Improvement Plan Program & Course Improvement Defining Purpose and Outcomes Analysis and Interpretation Stakeholder input Identifying and Collecting Data Program Mapping 8 Engineering Graduate Attribute Development (EGAD) Project
Human capital • Director, Program Development to manage process • Faculty member from each program • Other experts as appropriate (economics, information management, etc. ) Currently separate from faculty-wide curriculum development committee 9
Resources/time commitment Creating assessment criteria: 7 committees of approximately 5 people who each met about 4 times Mapping criteria to a course and creating rubrics for assessment: ~ 10 hours Large scale curricular changes: ~10 person committee, most of whom had 1 course relief bought out by dean Coordination (resource gathering, planning, curricular planning): ~30% of a position
Academic and curricular structure Dean Associate Dean (Academic) Faculty-wide curriculum committee Dean’s Retreat Curriculum Review Committee (DRCRC) Director (Program Development) Graduate attribute assessment committee NSERC Design Chair Du. Pont Canada Chair in Engineering Education
What are indicators? Lifelong learning An ability to identify and address their own educational needs in a changing world in ways sufficient to maintain their competence and to allow them to contribute to the advancement of knowledge Can this be directly measured? Would multiple assessors be consistent? How meaningful would the assessment be? Probably not, so more specific measurable indicators are needed. This allows the program to decide what is important Engineering Graduate Attribute Development (EGAD) Project 12
Indicators: examples Gradua te attribute Lifelong learning An ability to identify and address their own educational needs in a changing world in ways sufficient to maintain their competence and to allow them to contribute to the advancement of knowledge The student: Critically evaluates information for authority, currency, and objectivity when referencing literature. Identify gap in knowledge and develop a plan to address Indicators Describes the types of literature of Uses information ethically and legally to accomplish a specific purpose their field and how it is produced Engineering Graduate Attribute Development (EGAD) Project 13
Establishing Indicators Level of expectation (“describes”, “compares”, “applies”, “creates”, etc. ) Content area Critically evaluates information for authority, currency, and objectivity in reports. • • A well-written indicator includes: context what students will do the level of complexity at which they will do it the conditions under which the learning will be demonstrated 14 Engineering Graduate Attribute Development (EGAD) Project
Assessment criteria Linkage to OCAV UDLEs Graduate attribute levels categories 15 Engineering Graduate Attribute Development (EGAD) Project
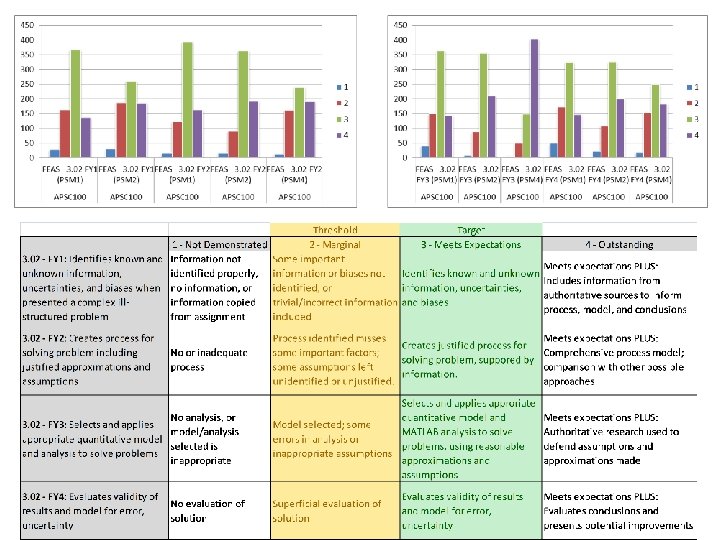
Rubric example Creating defined levels (“scales”) of expectations reduces variability between graders, makes expectations clear to students threshold target
3. 02 -FY 1 3. 02 -FY 2 3. 02 -FY 3 3. 02 -FY 4 3. 03 -FY 1 3. 03 -FY 2 3. 03 -FY 3 3. 03 -FY 4 3. 04 -FY 1 3. 04 -FY 2 3. 04 -FY 3 3. 04 -FY 4 3. 04 -FY 5 3. 04 -FY 6 3. 04 -FY 7 Sample First year indicators for problem analysis and design Identifies known and unknown information, uncertainties, and biases when presented a complex ill-structured problem Creates process for solving problem including justified approximations and assumptions Selects and applies appropriate quantitative model and analysis to solve problems Evaluates validity of results and model for error, uncertainty Generates ideas and working hypothesis Designs investigations involving information and data gathering, analysis, and/or experimentation Synthesizes data and information to reach conclusion Appraises the validity of conclusion relative to the degrees of error and limitations of theory and measurement Adapts general design process to design system, component, or process to solve openended complex problem. Accurately identifies significance and nature of a complex, open-ended problem Identifies customer and user needs Gathers and uses information from appropriate sources, including applicable standards, patents, regulations as appropriate. Produces a variety of potential design solutions suited to meet functional specifications Performs systematic evaluations of the degree to which several design concept options meet project criteria Compares the design solution against the problem objective 17 Engineering Graduate Attribute Development (EGAD) Project
Sample fourth year indicators for Problem analysis and Design 3. 02 -GY 1 Identifies problem, known and unknown information, uncertainties, and biases 3. 02 -GY 2 3. 02 -GY 3 Creates process for solving problem including justified approximations and assumptions Selects and applies appropriate model and analysis to solve problems 3. 02 -GY 4 Evaluates validity of results and model for error, uncertainty 3. 04 -GY 1 Identify problem and constraints including health and safety risks, applicable standards, economic, environmental, cultural and societal considerations 3. 04 -GY 2 Applies appropriate knowledge, judgement, and design tools, in creating and analyzing conceptual design solutions to select best concept 3. 04 -GY 3 Creates and tests simulations, models, and/or prototypes at various points in design with complexity appropriate to design stage Assesses design performance based on requirements, yield, reliability, and/or safety as appropriate Identifies possibilities for further improvement and conducts design review to evaluate performance of the overall process. 3. 04 -GY 4 3. 04 -GY 5 18 Engineering Graduate Attribute Development (EGAD) Project
Program-wide assessment process flow Create a Program Improvement Plan Program & Course Improvement Defining Purpose and Outcomes Analysis and Interpretation Stakeholder input Identifying and Collecting Data Program Mapping 19 Engineering Graduate Attribute Development (EGAD) Project
Curriculum mapping 20
21
22
dg e le se ba Co for m en Im m g m pa un ine ics ct ica er an of tio ing d en pr n gin sk oj ec ee i t m D lls rin go a es n Eth nag ign s ic e In ocie s a me n di vid ty a d e nt ua nd qu l a th ity nd e e te nv a. . In m w. Lif ves or k et lo iga Pr ng l tion ob ea le rn m Us in e Pro an g of a f en ess lysi gin ion s ee ali rin sm gt oo ls ow kn on o Ec A Development of Enginering Attributes 250 200 150 100 50 0 Not Taught / Not Assessed Not Taught / Assessed Taught / Not Assessed Taught / Assessed
Student surveys and focus groups • Provides student input: • implementing attribute assessment in program • perceptions on where attributes are developed within the program as complement to curriculum mapping via faculty survey • perception of importance within program
Questions • What do you think are priorities within the program? • What courses contribute to development of attribute {}? • Which attributes are difficult to demonstrate? • How would you recommend that attributes be developed?
Self reported demonstration at program entry Top five Grad Attributes where students reported a rating of 2 or 3 (yes or to a great degree) out of 3 Individual and Team Work 88. 73% Communication Skills 78. 17% Professionalism 69. 02% Problem Analysis 61. 26% Investigation 60. 56% Potential for students to perceive little value in learning activities directed toward developing these attributes
First year program supports: Attributes in students’ top five responses Individual and Team Work* 94. 97% Knowledge Base in Engineering 93. 53% Problem Analysis* 93. 53% Professionalism* 85. 58% Investigation* 82. 48% Design 80. 58% Impact of Engineering on Society 80. 58% *Identified as a strength coming in to the program 27
First year program supports Bottom three responses Ethics and Equity 64. 03% Economics and Project Management 69. 56% Lifelong Learning 73. 19% These three are a significant focus in APSC-100, embedded in various activities. 28
Attributes perceived to be program priorities Attribute # of students who incl it in # of students who top 5 selected it as #1 priority Problem Solving* 120 34 Individual & Team Work* 97 17 Knowledge Base 95 51 Communication* 76 6 Professionalism* 47 4 29
Graduating students: low priority attributes in program Attribute # who included it in bottom 3 # who ranked it lowest priority Lifelong learning 80 38 Economics and Project Management Ethics and Equity 68 25 45 1 Use of Eng Tools 38 15 Impact on Society 37 6 30
Focus group suggestions • Communicate graduate attributes and draw attention back to them • What is lifelong learning”? • Professionalism and ethics and equity should be focused on in upper years
Program-wide assessment process flow Create a Program Improvement Plan Program & Course Improvement Defining Purpose and Outcomes Analysis and Interpretation Stakeholder input Identifying and Collecting Data Program Mapping 32 Engineering Graduate Attribute Development (EGAD) Project
Assessment in 2010 -2011 Attribute First year Upper years Knowledge base FCI, Calculus Problem analysis Complex problem solving Capstones Design project Capstones Engineering tools Complex problem solving Capstones Communications Design project Communications, Capstones Individual and teamwork Design project Capstones Impact of engineering Design project Capstones Professionalism Complex problem solving Capstones Ethics and equity Complex problem solving Capstones Investigation Economics Lifelong learning Economics Design project Capstones 33
Analyze and evaluate… Histogram of results by level (did or did not meet expectations) Histogram of results by student (how many indicators did each student fall below Trend over time Triangulation: examination of correlation between results on multiple assessments of the same indicator data with exam results)
First year: Second year of pilot
450 400 350 300 250 1 200 2 150 3 100 4 50 0 FEAS - 3. 07 -FY 3 (Prop. Report. PM) FEAS - 3. 07 -FY 3 (Prop. Report. FS) FEAS - 3. 07 -FY 3 (Prop. Report. AA) FEAS - 3. 07 -FY 3 (T 2 Scope&Info) APSC 100 time
Knowledge base: Mathematics Calculus instructor asked questions on exam that specifically targeted 3 indicators for “Knowledge”: 1. “Create mathematical descriptions or expressions to model a real-world problem” 2. “Select and describe appropriate tools to solve mathematical problems that arise from modeling a real-world problem” 3. “Use solution to mathematical problems to inform the real-world problem that gave rise to it”
Indicator 1: • The student can create and/or select mathematical descriptions or expressions for simple real-world problems involving rates of change and processes of accumulation (overlaps problem analysis) Context: calculating Intersection of two trajectories 39
Indicator 2: Students can select and describe appropriate tools to solve the mathematical problems that arise from this analysis Context: differentiation similar to high school curriculum 40
Indicator 2: • Students can select and describe appropriate tools to solve the mathematical problems that arise from this analysis Context: implicit differentiation, trig inverse 41
Program-wide assessment process flow Create a Program Improvement Plan Program & Course Improvement Defining Purpose and Outcomes Analysis and Interpretation Stakeholder input Collecting Data Program Mapping 42 Engineering Graduate Attribute Development (EGAD) Project
All first year indicators over time 45 4, 000 40 3, 800 3, 400 30 3, 200 25 3, 000 20 2, 800 15 2, 600 10 2, 400 5 2, 200 2010 -09 2010 -11 2010 -12 2011 -02 Approximate deliverable date 2011 -04 2, 000 2011 -05 Linear(% Below target) Mean score Percent below target Mean 3, 600 35 2010 -08 % Below target Linear(Mean)
# Students falling below expectations in first year 400 Number of students 350 344 Below target Below threshold 300 228 250 187 200 150 100 50 26 42 6773 65 62 46 38 45 7 0 0 100 1 2 3 4 20 41 0 0 25 0 10 0 2 0 0 0 5 6 -10 11 -15 16 -20 21 -25 26 -30 31 -35 36 -40 41 -50 Number of indicators
Graduating year
Graduating year • Starting point: histograms • Very few students falling below threshold level in capstone courses for most indicators 0, 7 0, 6 0, 5 0, 4 Not dem 0, 3 Marginal 0, 2 Meets 0, 1 Outstanding 3. 04 GY 5 3. 04 GY 4 3. 04 GY 3 3. 04 GY 2 3. 04 GY 1 3. 02 GY 4 3. 02 GY 3 3. 02 GY 2 3. 02 GY 1 0 46
Area for improvement in graduating year: technical literature 60 Percentage (%) 50 40 30 20 10 0 FEAS - 3. 12 -FY 1 FEAS - 3. 12 -FY 2 FEAS - 3. 12 -FY 5 FEAS - 3. 12 -FY 6 Attributes 1 - Not Demonstrated 3. 12 -FY 1 3. 12 -FY 2 3. 12 -FY 5 3. 12 -FY 6 2 - Marginal Uses information effectively, ethically, and legally to accomplish a specific purpose, including clear attribution of Information sources. Identifies a specific learning need or knowledge gap. Identifies appropriate technical literature and other information sources to meet a need Critically evaluates the procured information for authority, currency, and objectivity. 47
Data evaluation • Across multiple capstone courses, students scoring lower on indicators involving: • • Evaluating validity of results Evaluating techniques and tools Evaluating effectiveness of results Evaluating information • Pattern: evaluation 48
Curriculum Mapping: Curri. Kit • Curriculum mapping software developed by U Guelph • Provides information to identify: • the courses which develop each graduate attribute • what assessment is done and when • which instructional approaches are used
Program-wide assessment process flow Create a Program Improvement Plan Program & Course Improvement Defining Purpose and Outcomes Analysis and Interpretation Stakeholder input Collecting Data Program Mapping 50 Engineering Graduate Attribute Development (EGAD) Project
First year development • More focus on grader training and calibration • Problem analysis: greater focus on making an effective argument • Design: the focus on safety and risk assessment • Communications: Weak communicators flagged and supported in fall semester (EPT). Required resubmission/assistance for falling below threshold • Lifelong learning: evaluating information • Ethics and equity and professionalism get stronger emphasis
Development in upper years • In 2012 -2013 all programs will have an open-ended design experience in third year which will apply disciplinary tools and principles, and incorporate professional issues and communications • In 2013 -2014 capstone courses will be revised to strengthen professional skills (safety, role of engineers in protecting public safety, ethics, communications)
Program improvement • Students take more responsibility for learning and demonstrating attributes • Faculty-wide curriculum development • Engineering design and practice sequence • Assessment built into sequence • Multi-disciplinary approach to developing professional skills in an integrative experience • Developing leadership through peer mentoring program 53
Process development • Improve common indicators • Develop disciplinary indicators • Triangulation: Indicators measured using multiple methods or events to assess validity • Attributes measured at multiple times in students' program with leveled expectations • Satisfy both CEAB and province (OCAV UDLEs for Queen’s Quality assurance process) 54
End
Moodle
Sample course Moodle page
Moodle online assignments 58 Engineering Graduate Attribute Development (EGAD) Project
Assignment upload 59 Engineering Graduate Attribute Development (EGAD) Project
Outcome grading for assignments 60 Engineering Graduate Attribute Development (EGAD) Project
Outcome grading - popup 61 Engineering Graduate Attribute Development (EGAD) Project
Moodle development Customizing Moodle for our purposes Group upload/grading of assignments Peer evaluation Class response system (“clickers”) Future collaboration