
Progettazione di circuiti e sistemi VLSI Anno Accademico



- Slides: 55
Progettazione di circuiti e sistemi VLSI Anno Accademico 2011 -2012 Prof. Adelio Salsano 6. 3 e 8. 3 Presentazione e programma del corso 1
Programma • Cenni storici. Problematiche progettuali: costi, prestazioni, potenza. • Tecnologie integrate CMOS: passi progettuali, regole di layout, packaging • Richiami sui componenti elementari ideali e reali. Modelli SPICE del diodo, del transistor MOS e dei componenti passivi • Interconnessioni, modelli RC. Modelli SPICE delle connessioni • Nanotecnologie: aspetti tecnologici e modelli 2
Programma (segue) • Circuiti digitali elementari: inverter CMOS e transmission gate. Caratteristiche statiche e dinamiche. Potenza, energia e ritardo dei circuiti elementari • Porte logiche combinatorie. Logica statica e dinamica. Prestazioni e caratteristiche • Circuiti logici sequenziali. Latch e registri. Pipeline • Circuiti e sistemi digitali complessi e metodologie di implementazione: processori, PLA, FPGA, standard cell • Memorie statiche e dinamiche. Memorie e non volatili 3
Programma (segue) • Affidabilità e tolleranza ai guasti dei circuiti integrati. Circuiti integrati analogici: interruttori, riferimenti di corrente e tensione, specchi di corrente, amplificatori differenziali • Strumenti per la progettazione di circuiti e sistemi: linguaggi descrittivi, i principali programmi di sintesi • Progettazione custom, standard cell e componenti programmabili • Progettazione ad alta affidabilità e/o basso consumo 4
Programma Esercitazioni (segue) Sono previste esercitazioni sui seguenti temi: • Programmi simulazione (LTSpice…) • Calcolo parametri • Progettazione digitale RTL • Progetto circuiti e sistemi • FPGA e Xilinx • Linguaggi descrittivi • Progettazione FPGA 5
Notizie sul corso Esercitazioni • Sono previste 25 ore di esercitazioni con l’uso di software di progetto e simulazione di componenti e circuiti prevalentemente digitali. Collaboratori • Prof. Stefano Bertazzoni; Salvatore Pontarelli e Marco Ottavi Materiale didattico q Jan M. Rabaey, Anantha Chandrakasan, Borivoje Nikolic, “Circuiti Integrati Digitali: l’ottica del progettista”, Pearson Prentice Hall q R. L. Geiger, P. E. Allen, N. R. Strader VLSI design techniques for analog and digital Circuits, Mac Graw Hill 6 Int. Ed.
Notizie sul corso (segue) ORARIO Martedì 9, 30 – 11, 15 Aula C 8 Giovedì 9. 30 – 11. 15 Aula C 8 Venerdì 9. 30 - 11. 15 Aula C 1 RICEVIMENTO STUDENTI Lunedì e giovedì 15 – 16. 30 7
What is this course/book about? • Introduction to digital integrated circuits. – CMOS devices and manufacturing technology. CMOS inverters and gates. Propagation delay, noise margins, and power dissipation. Sequential circuits. Arithmetic, interconnect, and memories. Programmable logic arrays. Design methodologies. • What will you learn? – Understanding, designing, and optimizing digital circuits with respect to different quality metrics: cost, speed, power dissipation, and reliability 8
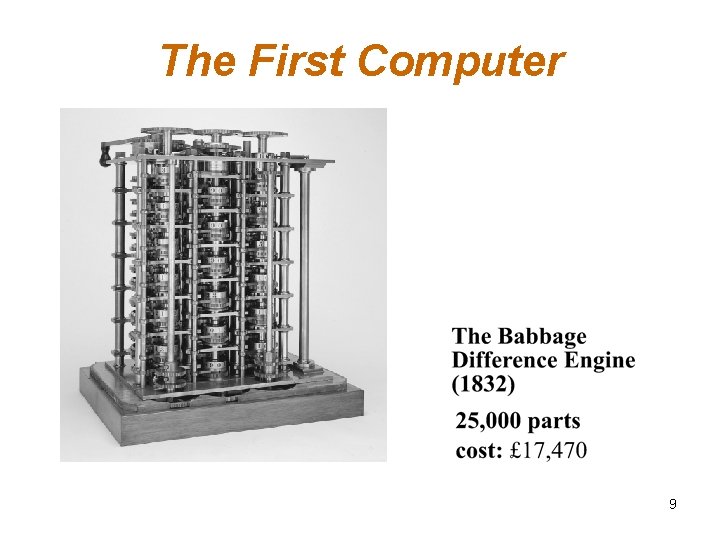
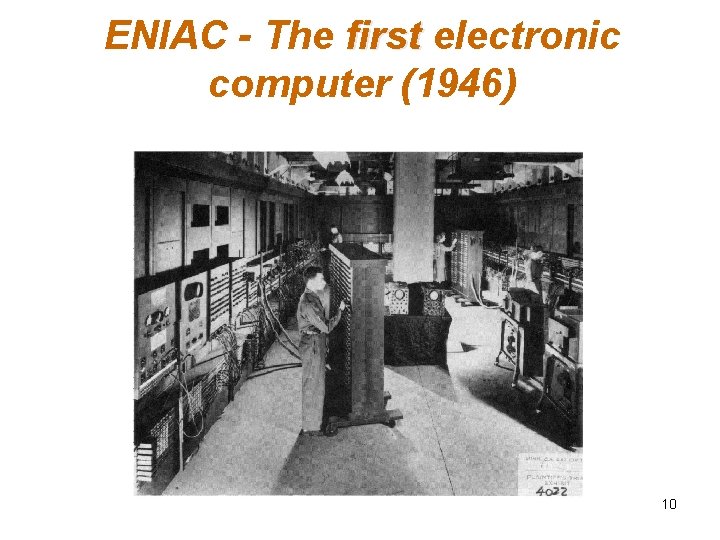
The First Computer 9
ENIAC - The first electronic computer (1946) 10
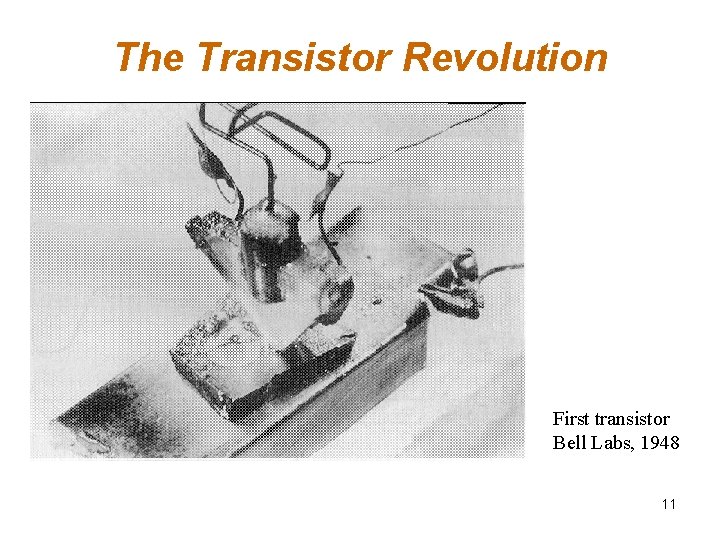
The Transistor Revolution First transistor Bell Labs, 1948 11
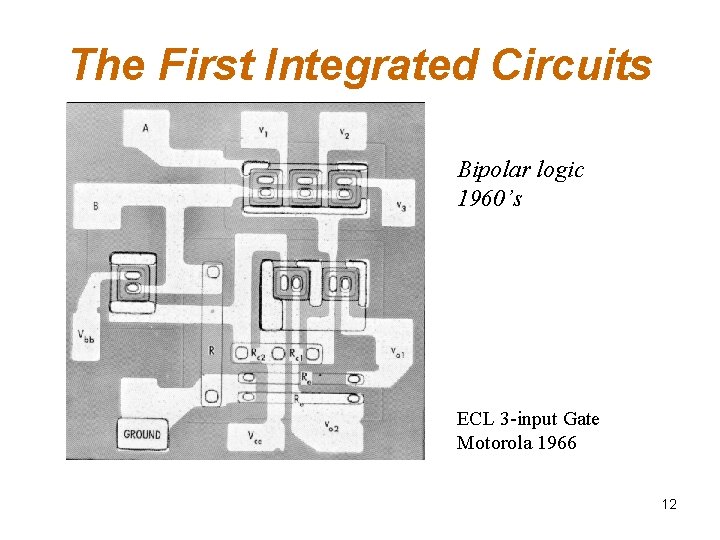
The First Integrated Circuits Bipolar logic 1960’s ECL 3 -input Gate Motorola 1966 12
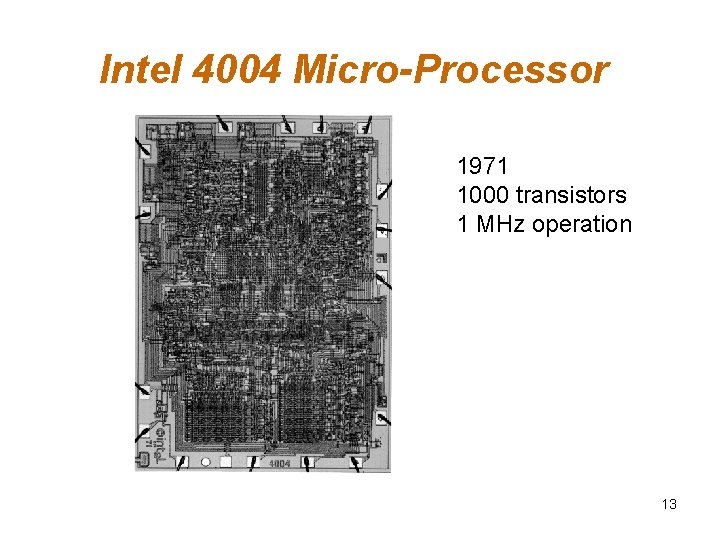
Intel 4004 Micro-Processor 1971 1000 transistors 1 MHz operation 13
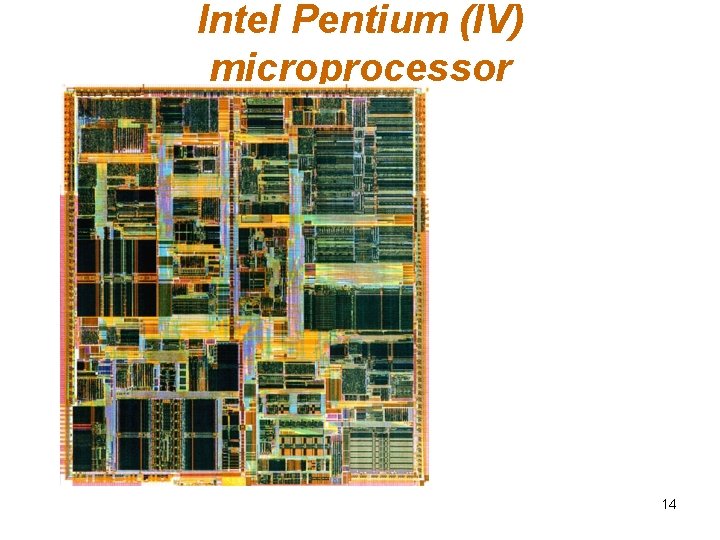
Intel Pentium (IV) microprocessor 14
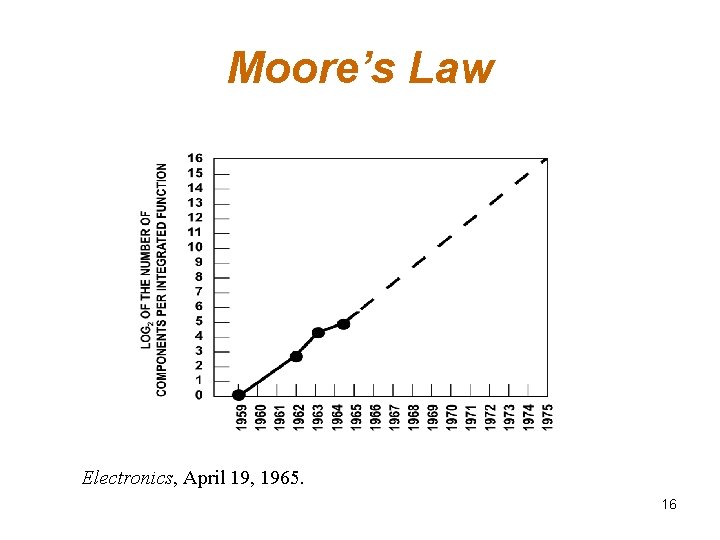
Moore’s Law q. He made a prediction that semiconductor technology will double its effectiveness every 18 months q. In 1965, Gordon Moore noted that the number of transistors on a chip doubled every 18 to 24 months. 15
Moore’s Law Electronics, April 19, 1965. 16
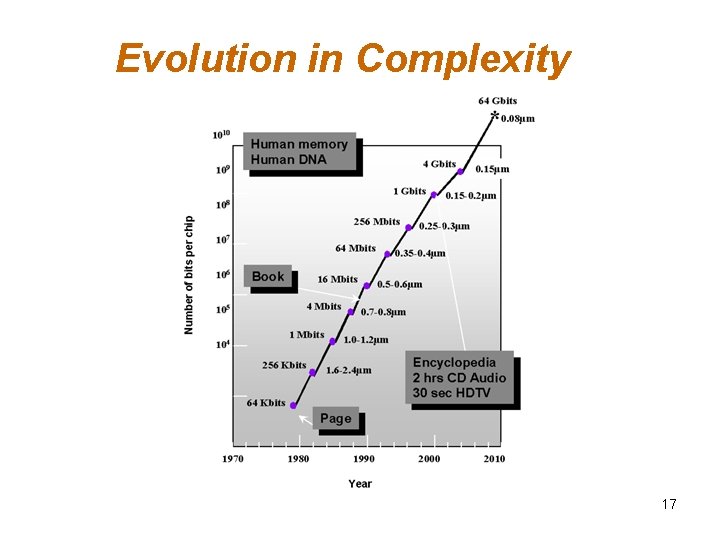
Evolution in Complexity 17
Transistor Counts 1 Billion Transistors K 1, 000 100, 000 1, 000 i 386 80286 100 10 i 486 Pentium® III Pentium® Pro Pentium® 8086 Source: Intel 1 1975 1980 1985 1990 1995 2000 2005 2010 Projected Courtesy, Intel 18
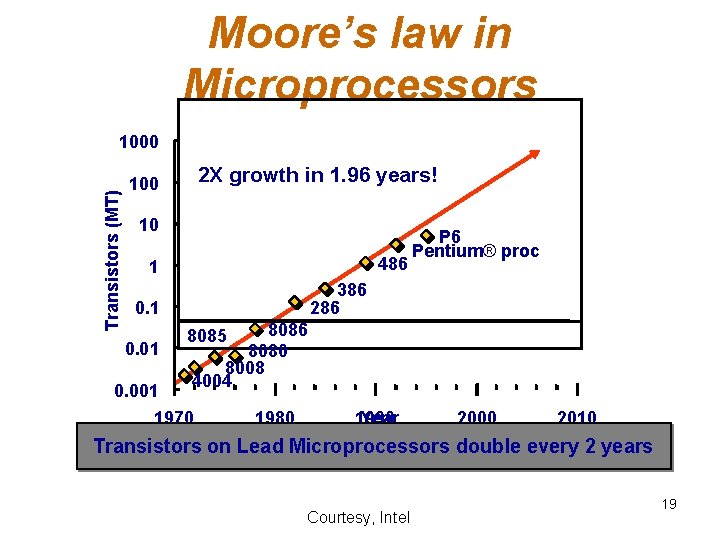
Moore’s law in Microprocessors Transistors (MT) 1000 2 X growth in 1. 96 years! 100 10 486 1 386 286 0. 1 0. 01 P 6 Pentium® proc 8086 8080 8008 4004 8085 0. 001 1970 1980 Year 1990 2000 2010 Transistors on Lead Microprocessors double every 2 years Courtesy, Intel 19
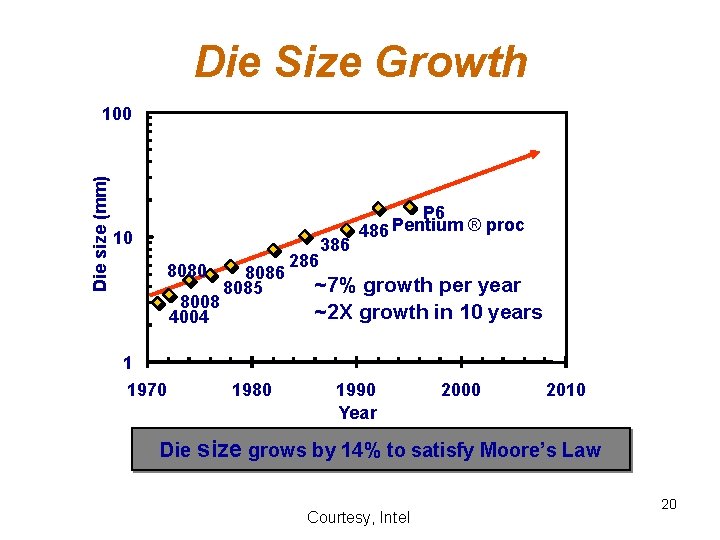
Die Size Growth Die size (mm) 100 10 8080 8008 4004 1 1970 8086 8085 1980 286 386 P 6 Pentium ® proc 486 ~7% growth per year ~2 X growth in 10 years 1990 Year 2000 2010 Die size grows by 14% to satisfy Moore’s Law Courtesy, Intel 20
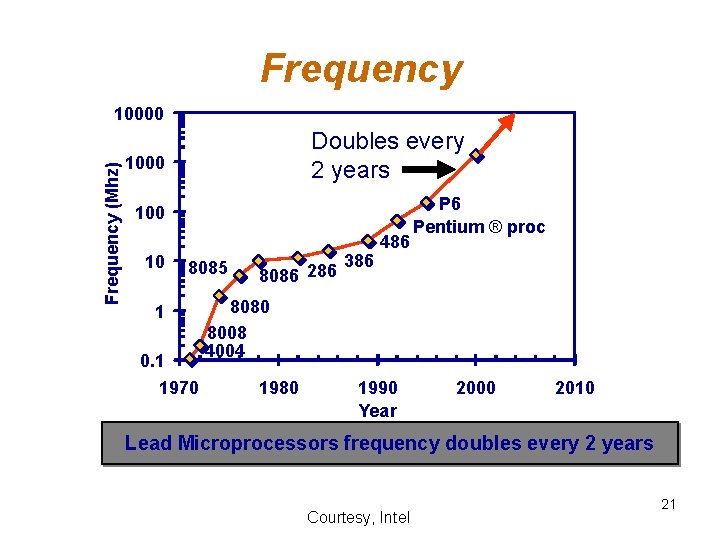
Frequency (Mhz) 10000 Doubles every 2 years 1000 10 8085 1 0. 1 1970 8086 286 386 486 P 6 Pentium ® proc 8080 8008 4004 1980 1990 Year 2000 2010 Lead Microprocessors frequency doubles every 2 years Courtesy, Intel 21
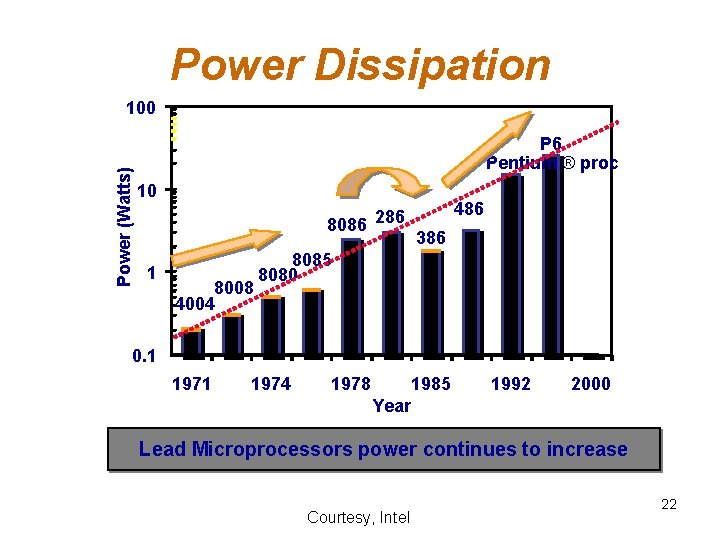
Power Dissipation Power (Watts) 100 P 6 Pentium ® proc 10 8086 286 1 8008 4004 486 386 8085 8080 0. 1 1974 1978 1985 1992 2000 Year Lead Microprocessors power continues to increase Courtesy, Intel 22
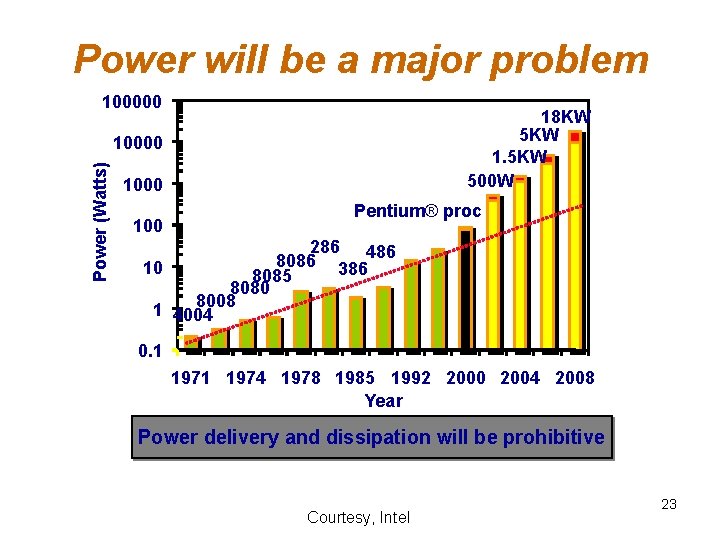
Power will be a major problem 100000 18 KW 5 KW 1. 5 KW 500 W Power (Watts) 10000 100 Pentium® proc 286 486 8086 10 386 8085 8080 8008 1 4004 0. 1 1974 1978 1985 1992 2000 2004 2008 Year Power delivery and dissipation will be prohibitive Courtesy, Intel 23
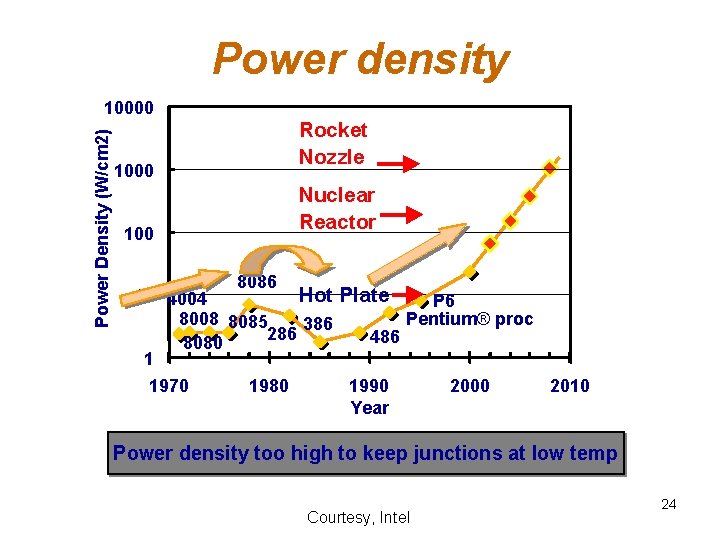
Power density Power Density (W/cm 2) 10000 100 Rocket Nozzle Nuclear Reactor 8086 10 4004 Hot Plate P 6 8008 8085 Pentium® proc 386 286 486 8080 1 1970 1980 1990 2000 2010 Year Power density too high to keep junctions at low temp Courtesy, Intel 24
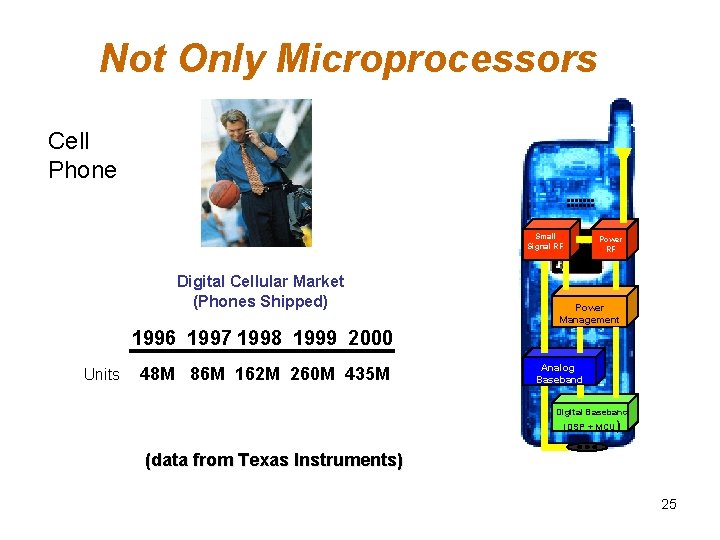
Not Only Microprocessors Cell Phone Small Signal RF Digital Cellular Market (Phones Shipped) Power RF Power Management 1996 1997 1998 1999 2000 Units 48 M 86 M 162 M 260 M 435 M Analog Baseband Digital Baseband (DSP + MCU) (data from Texas Instruments) 25
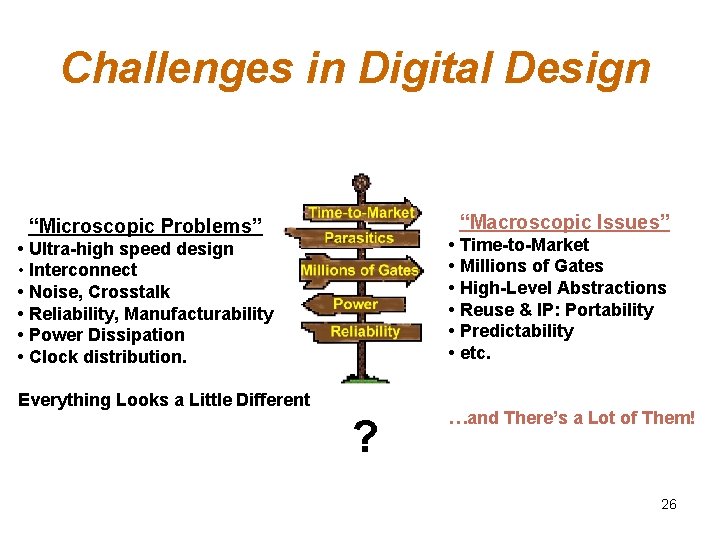
Challenges in Digital Design “Macroscopic Issues” “Microscopic Problems” • Time-to-Market • Millions of Gates • High-Level Abstractions • Reuse & IP: Portability • Predictability • etc. • Ultra-high speed design • Interconnect • Noise, Crosstalk • Reliability, Manufacturability • Power Dissipation • Clock distribution. Everything Looks a Little Different ? …and There’s a Lot of Them! 26
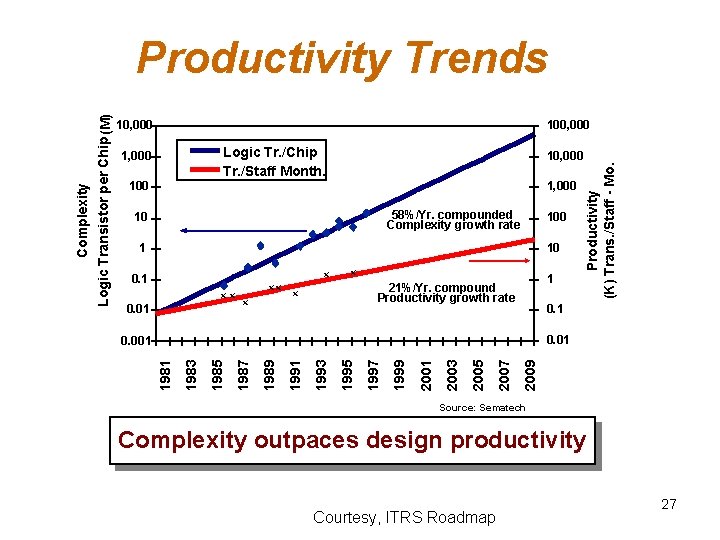
10, 000 100, 000, 000 Logic Tr. /Chip Tr. /Staff Month. 1, 000, 000 10, 000 100, 000 Productivity (K) Trans. /Staff - Mo. Complexity Logic Transistor per Chip (M) Productivity Trends 1, 000, 000 58%/Yr. compounded Complexity growth rate 10 10, 000 100, 000 1, 0001 10 10, 000 x 0. 1 100 xx 0. 01 10 xx x x 1 1, 000 21%/Yr. compound Productivity growth rate x 0. 1 100 0. 01 10 2009 2007 2005 2003 2001 1999 1997 1995 1993 1991 1989 1987 1985 1983 1981 0. 001 1 Source: Sematech Complexity outpaces design productivity Courtesy, ITRS Roadmap 27
Why Scaling? • Technology shrinks by 0. 7/generation • With every generation can integrate 2 x more functions per chip; chip cost does not increase significantly • Cost of a function decreases by 2 x • But … – How to design chips with more and more functions? – Design engineering population does not double every two years… • Hence, a need for more efficient design methods – Exploit different levels of abstraction 28
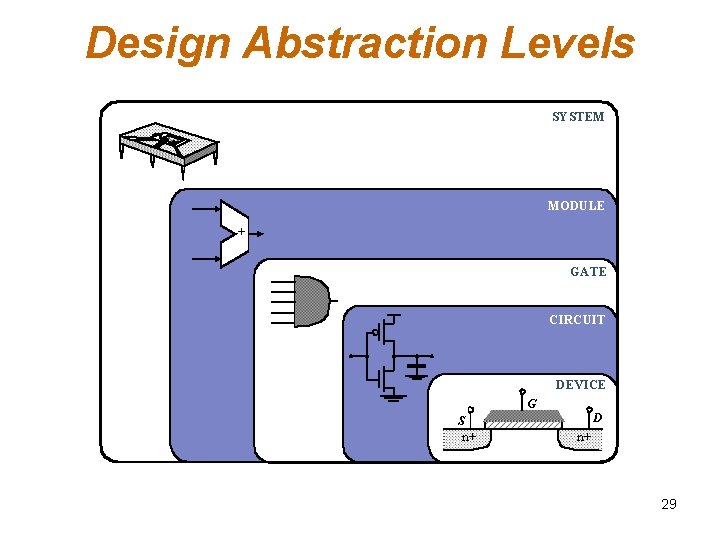
Design Abstraction Levels SYSTEM MODULE + GATE CIRCUIT DEVICE G S n+ D n+ 29
Design Metrics • How to evaluate performance of a digital circuit (gate, block, …)? – Cost – Reliability – Scalability – Speed (delay, operating frequency) – Power dissipation – Energy to perform a function 30
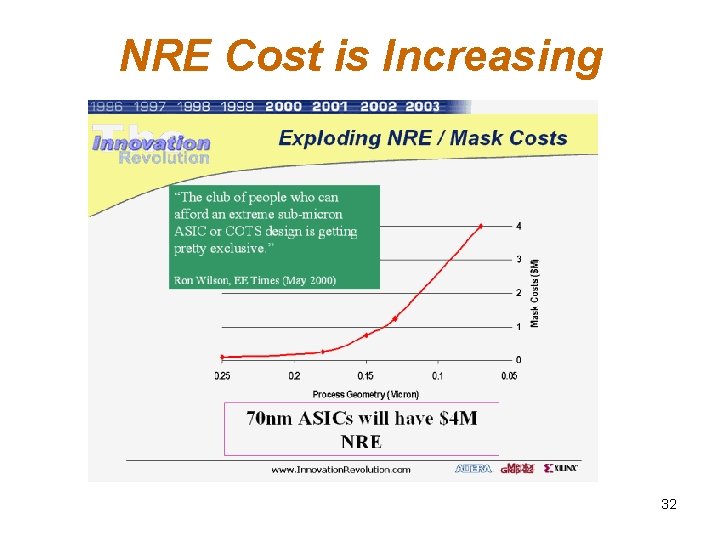
Cost of Integrated Circuits • NRE (non-recurrent engineering) costs – design time and effort, mask generation – one-time cost factor • Recurrent costs – silicon processing, packaging, test – proportional to volume – proportional to chip area 31
NRE Cost is Increasing 32
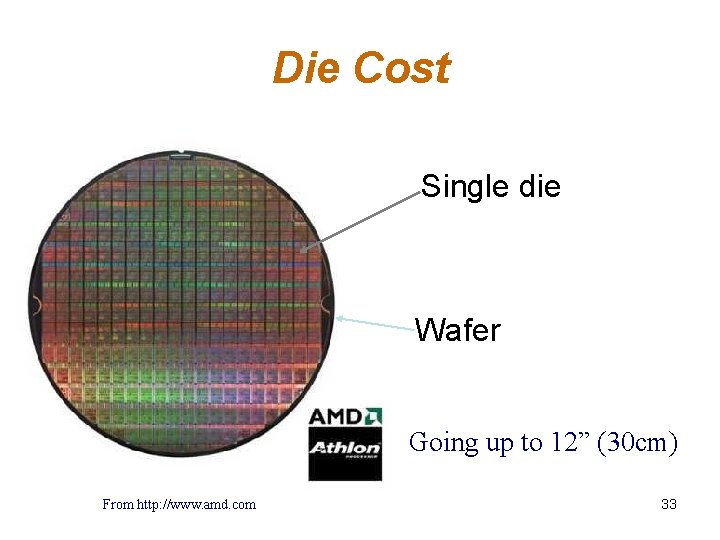
Die Cost Single die Wafer Going up to 12” (30 cm) From http: //www. amd. com 33
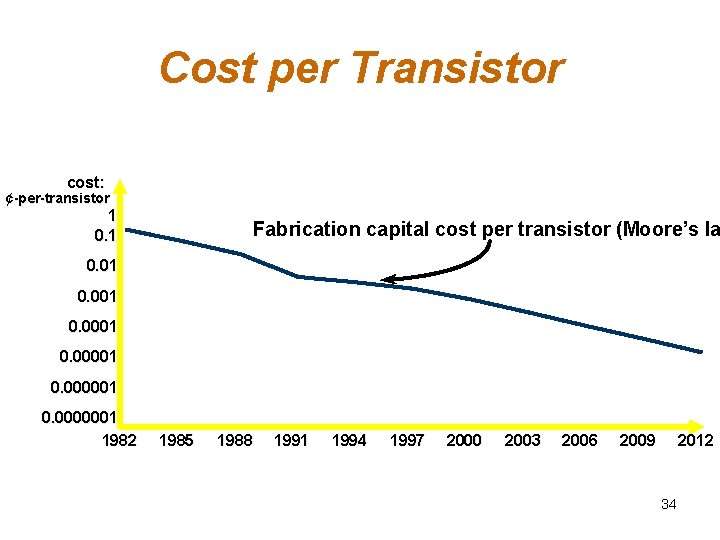
Cost per Transistor cost: ¢-per-transistor 1 0. 1 Fabrication capital cost per transistor (Moore’s la 0. 01 0. 0001 0. 000001 0. 0000001 1982 1985 1988 1991 1994 1997 2000 2003 2006 2009 2012 34
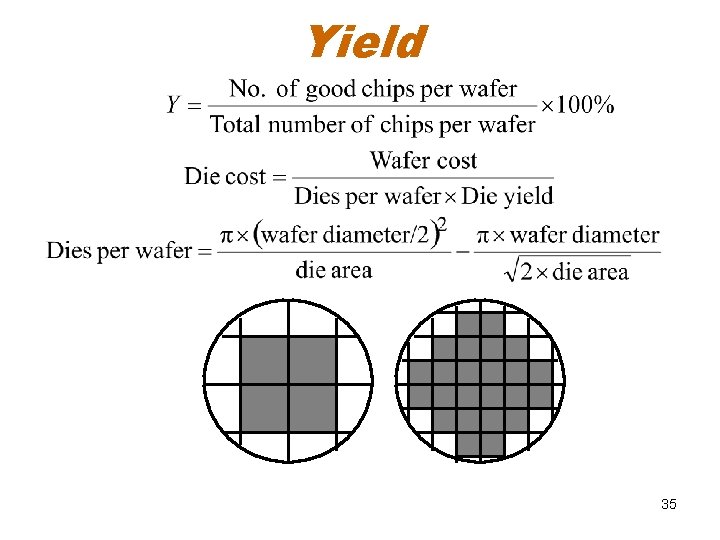
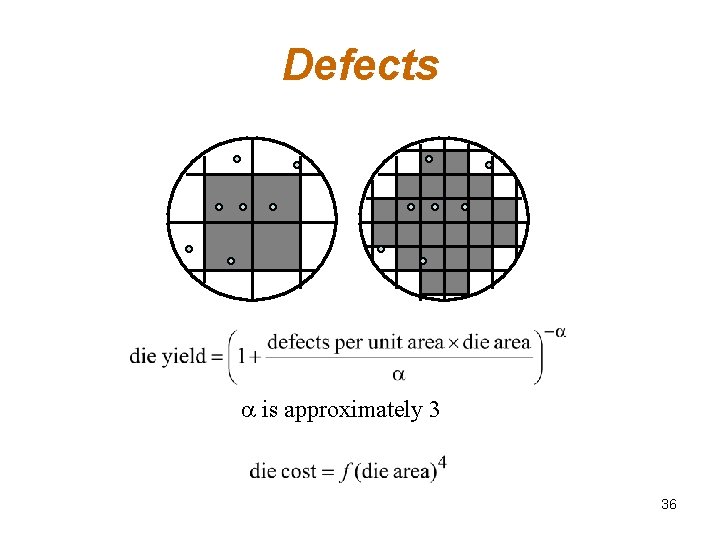
Yield 35
Defects a is approximately 3 36
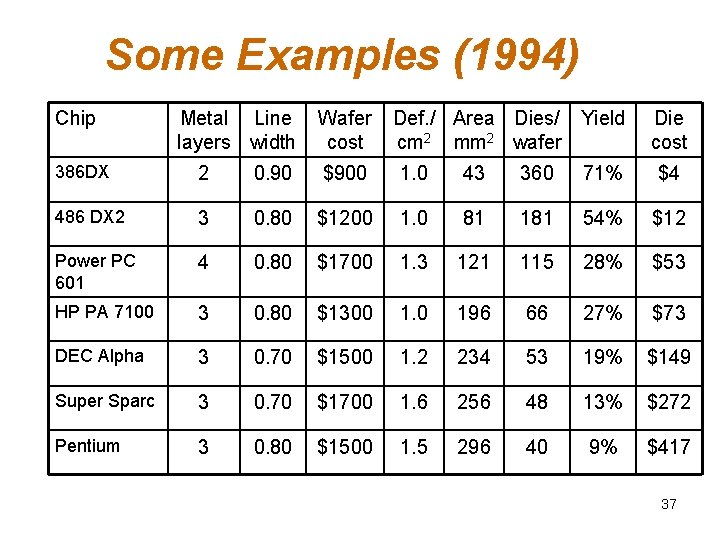
Some Examples (1994) Chip Metal Line layers width Wafer cost Def. / Area Dies/ Yield cm 2 mm 2 wafer Die cost 386 DX 2 0. 90 $900 1. 0 43 360 71% $4 486 DX 2 3 0. 80 $1200 1. 0 81 181 54% $12 Power PC 601 4 0. 80 $1700 1. 3 121 115 28% $53 HP PA 7100 3 0. 80 $1300 1. 0 196 66 27% $73 DEC Alpha 3 0. 70 $1500 1. 2 234 53 19% $149 Super Sparc 3 0. 70 $1700 1. 6 256 48 13% $272 Pentium 3 0. 80 $1500 1. 5 296 40 9% $417 37
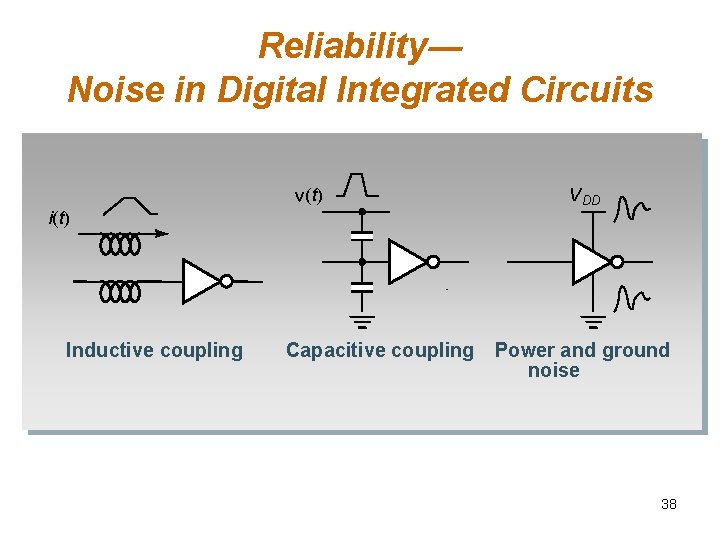
Reliability― Noise in Digital Integrated Circuits v(t) i(t) Inductive coupling Capacitive coupling V DD Power and ground noise 38
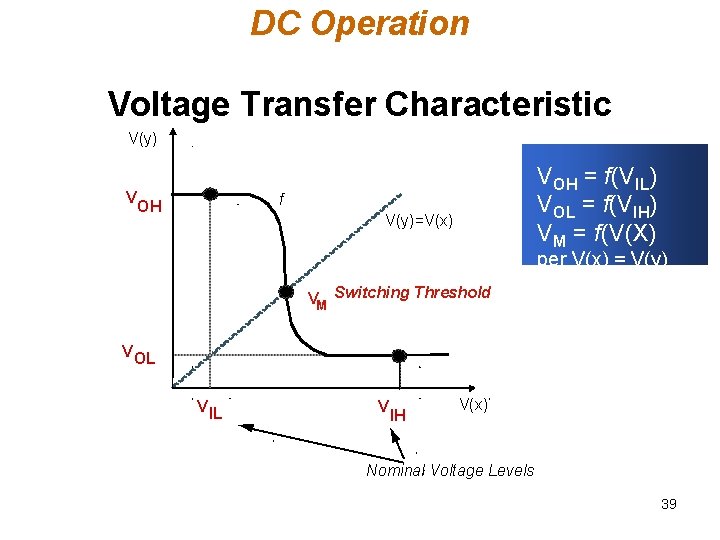
DC Operation Voltage Transfer Characteristic V(y) V VOH = f(VIL) VOL = f(VIH) VM = f(V(X) f OH V(y)=V(x) per V(x) = V(y) VM Switching Threshold V OL V IH V(x) Nominal Voltage Levels 39
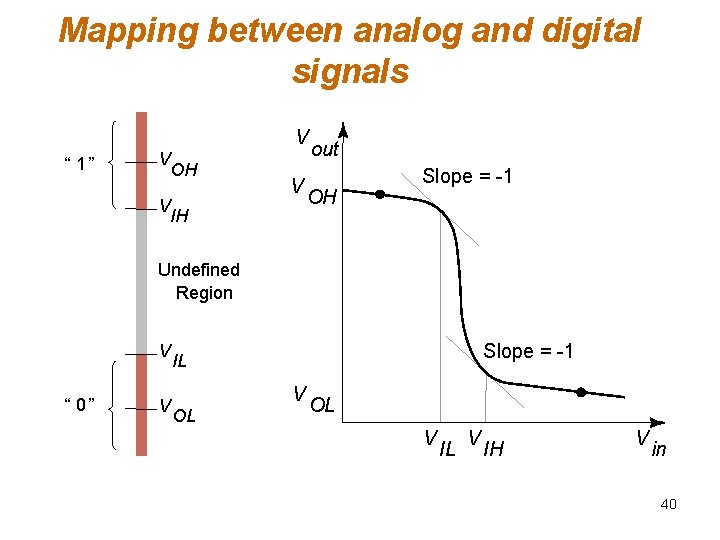
Mapping between analog and digital signals V “ 1” V OH V IH V out OH Slope = -1 Undefined Region V “ 0” V Slope = -1 IL V OL OL V IH V in 40
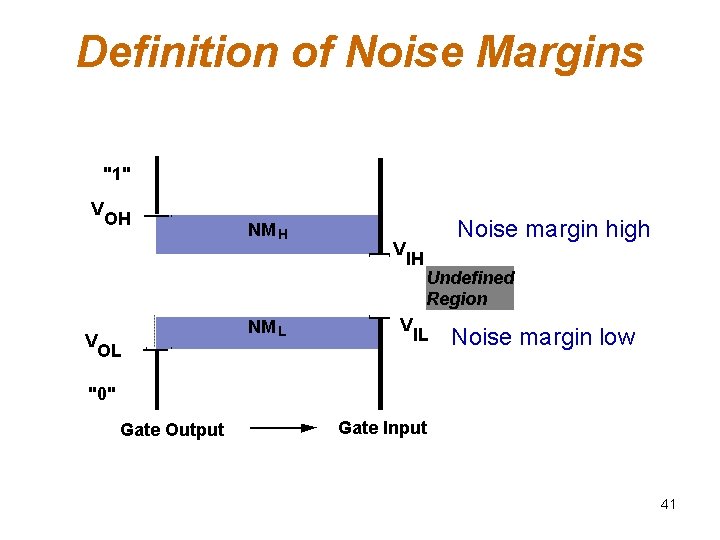
Definition of Noise Margins "1" V V OH NM L OL V Noise margin high IH V Undefined Region IL Noise margin low "0" Gate Output Gate Input 41
Noise Budget q. Allocates gross noise margin to expected sources of noise q. Sources: supply noise, cross talk, interference, offset q. Differentiate between fixed and proportional noise sources 42
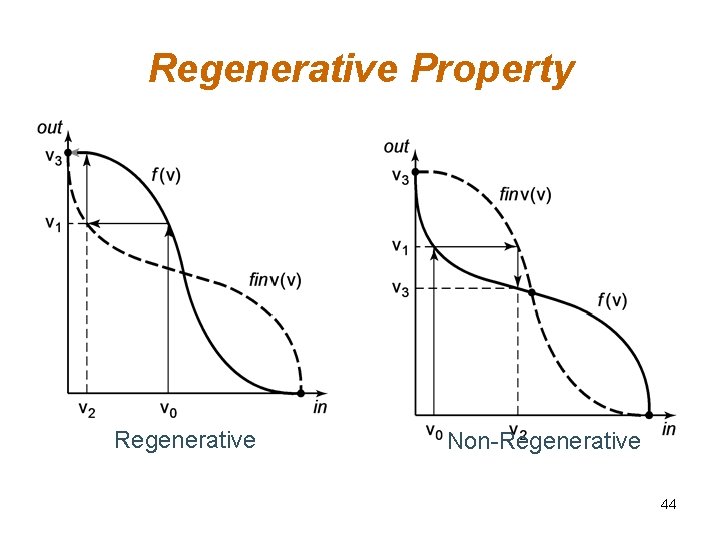
Key Reliability Properties • Absolute noise margin values are deceptive – a floating node is more easily disturbed than a node driven by a low impedance (in terms of voltage) • Noise immunity is the more important metric – the capability to suppress noise sources • Key metrics: Noise transfer functions, Output impedance of the driver and input impedance of the receiver; 43
Regenerative Property Regenerative Non-Regenerative 44
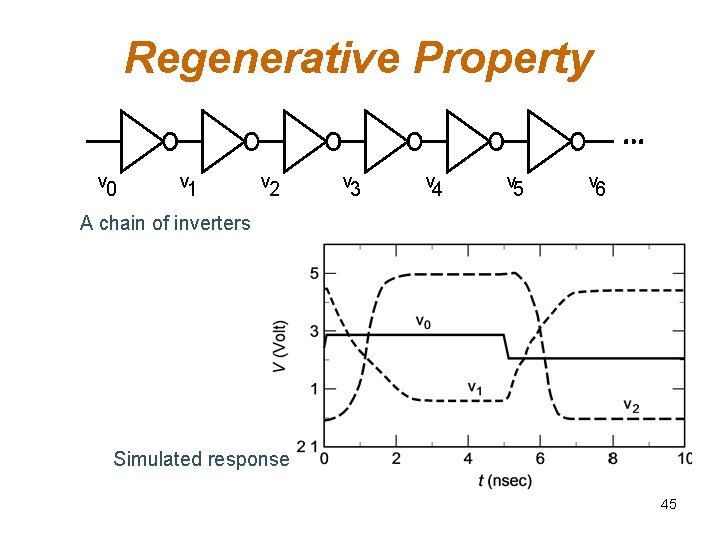
Regenerative Property v 0 v 1 v 2 v 3 v 4 v 5 v 6 A chain of inverters Simulated response 45
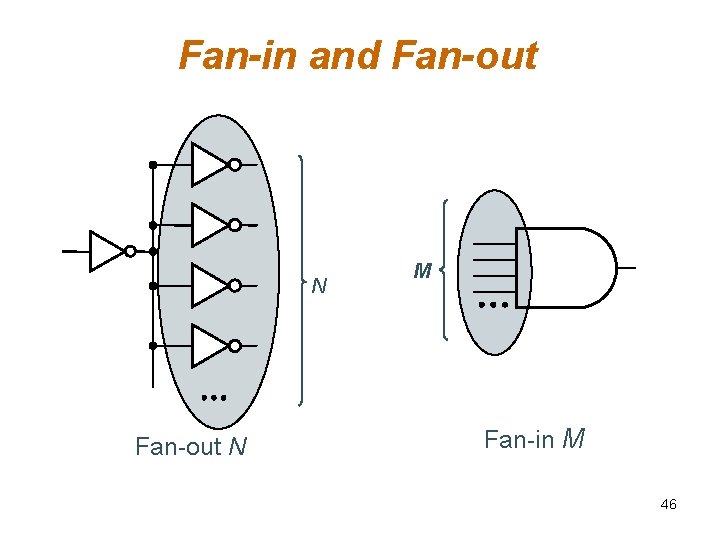
Fan-in and Fan-out N M Fan-in M 46
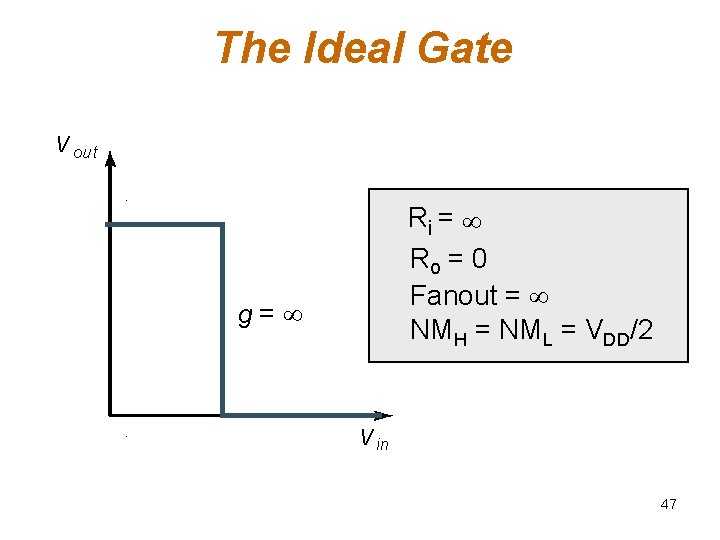
The Ideal Gate V out Ri = Ro = 0 Fanout = NMH = NML = VDD/2 g= V in 47
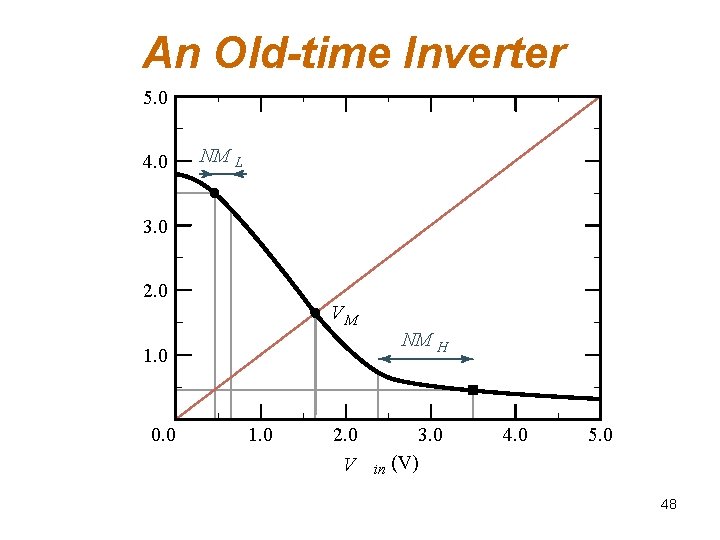
An Old-time Inverter 5. 0 4. 0 NM L 3. 0 2. 0 VM NM H 1. 0 0. 0 1. 0 2. 0 V 3. 0 in (V) 4. 0 5. 0 48
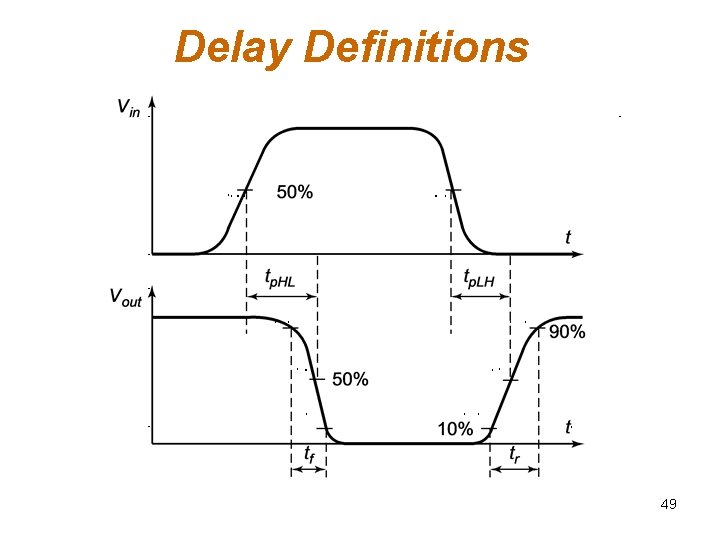
Delay Definitions 49
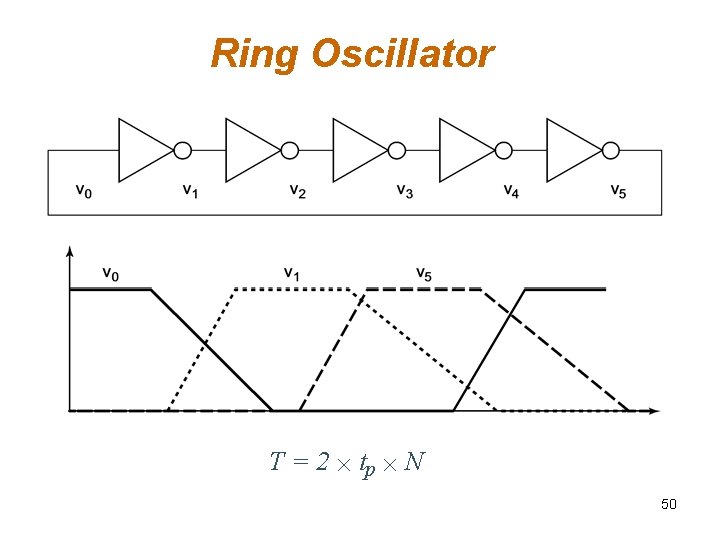
Ring Oscillator T = 2 ´ tp ´ N 50
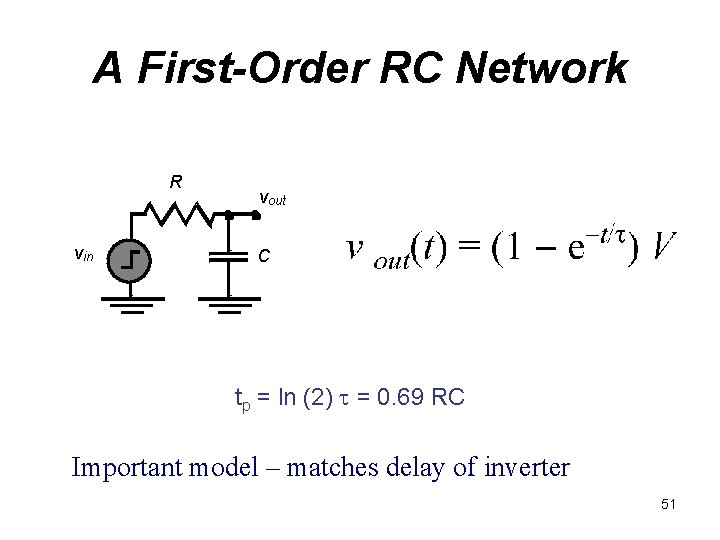
A First-Order RC Network R vin vout C tp = ln (2) t = 0. 69 RC Important model – matches delay of inverter 51
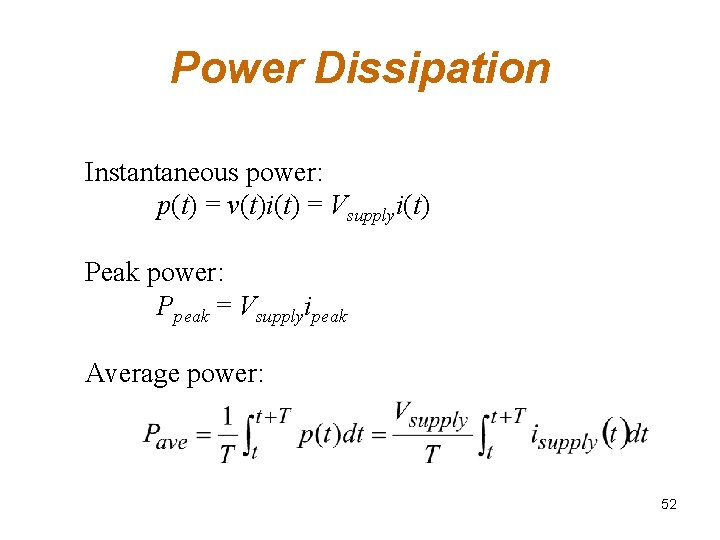
Power Dissipation Instantaneous power: p(t) = v(t)i(t) = Vsupplyi(t) Peak power: Ppeak = Vsupplyipeak Average power: 52
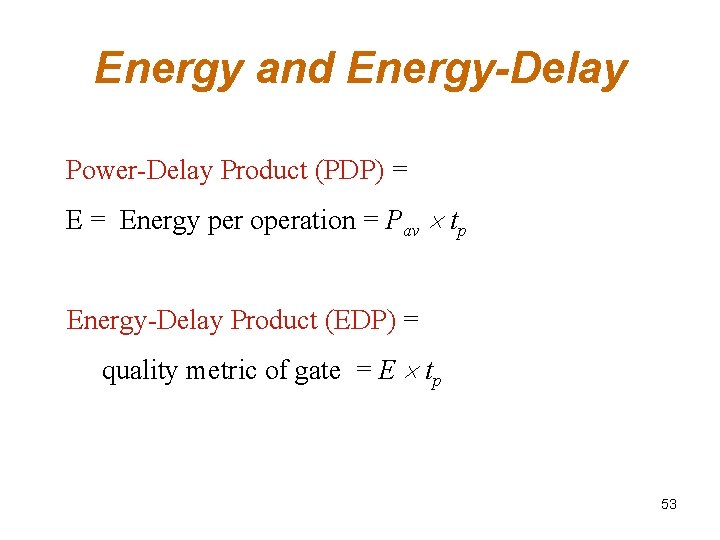
Energy and Energy-Delay Power-Delay Product (PDP) = Energy per operation = Pav tp Energy-Delay Product (EDP) = quality metric of gate = E tp 53
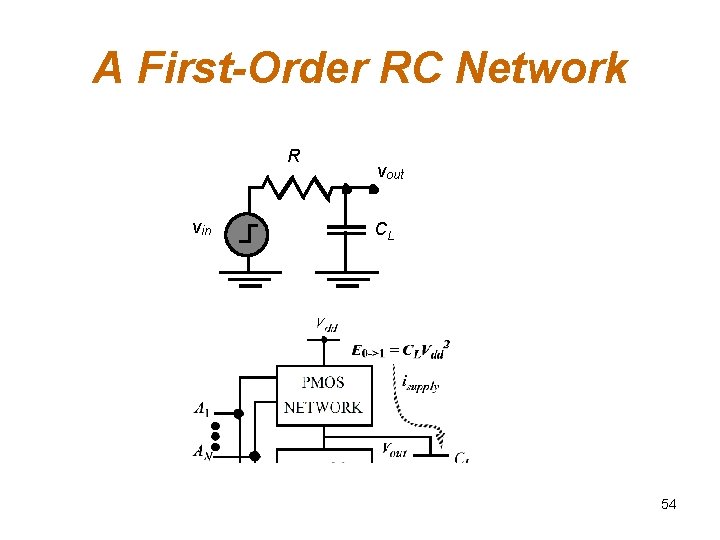
A First-Order RC Network R vin vout CL 54
Summary q Digital integrated circuits have come a long way and still have quite some potential left for the coming decades q Some interesting challenges ahead q. Getting a clear perspective on the challenges and potential solutions is the purpose of this book q Understanding the design metrics that govern digital design is crucial q. Cost, reliability, speed, power and energy dissipation 55