Profiling with CCS Embedded Development Tools What is
Profiling (with CCS) Embedded Development Tools
What is Profiling? • Dynamic program analysis that can measures relative statistics on your application – Profiling analyzes program execution and can show where your program is spending its time • Profiling is achieved by instrumenting either the program source code or its binary executable form using a tool called a profiler – A number of different techniques may be used by profilers, such as eventbased, statistical, instrumented, and simulation methods • Profilers can use a wide variety of techniques to collect data, including: – Hardware interrupts, code instrumentation, instruction set simulation, operating system hooks, and performance counters CCS APPS
Why Profile? • Performance is critical for any program, but especially so for embedded programs – Most common use of profiling information is to aid program optimization • 80/20 rule: 80% of the time is spent in 20% of the code – Hard to identify that 20% as programs continue to grow in size and complexity! • Profiling helps to identify that 20% – Where is the most time being spent? – Which functions takes the most time? – Which functions are called the most? • Profiling helps reduce the time it takes to identify and eliminate performance bottlenecks CCS APPS
Profiling with CCS APPS
Non-Instrumented CCS APPS
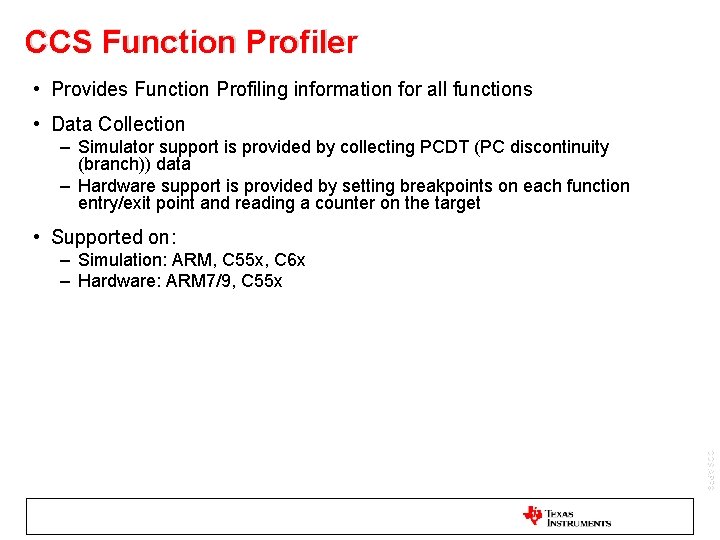
CCS Function Profiler • Provides Function Profiling information for all functions • Data Collection – Simulator support is provided by collecting PCDT (PC discontinuity (branch)) data – Hardware support is provided by setting breakpoints on each function entry/exit point and reading a counter on the target • Supported on: – Simulation: ARM, C 55 x, C 6 x – Hardware: ARM 7/9, C 55 x CCS APPS
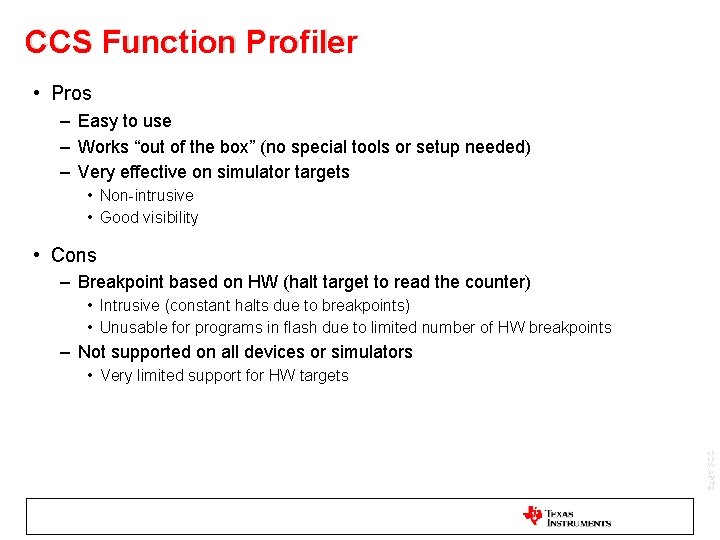
CCS Function Profiler • Pros – Easy to use – Works “out of the box” (no special tools or setup needed) – Very effective on simulator targets • Non-intrusive • Good visibility • Cons – Breakpoint based on HW (halt target to read the counter) • Intrusive (constant halts due to breakpoints) • Unusable for programs in flash due to limited number of HW breakpoints – Not supported on all devices or simulators • Very limited support for HW targets CCS APPS
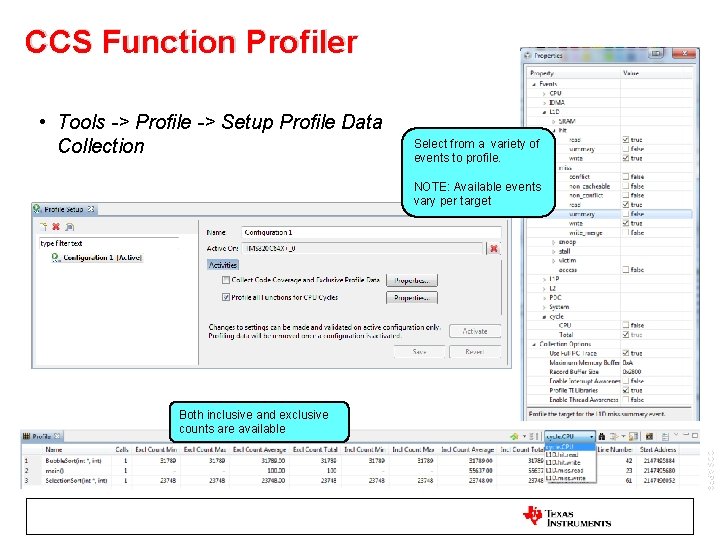
CCS Function Profiler • Tools -> Profile -> Setup Profile Data Collection Select from a variety of events to profile. NOTE: Available events vary per target Both inclusive and exclusive counts are available CCS APPS

CCS Code Coverage Tool • Provides Line and Functional coverage information for a program after its execution has completed • Data Collection – Instrumentation and collection handled by the simulator non-intrusively • Supported on: – C 6 x simulators only • Pros – – Easy to use Works “out of the box” Non-intrusive Good visibility • Cons CCS APPS – Supported only on C 6 x simulators
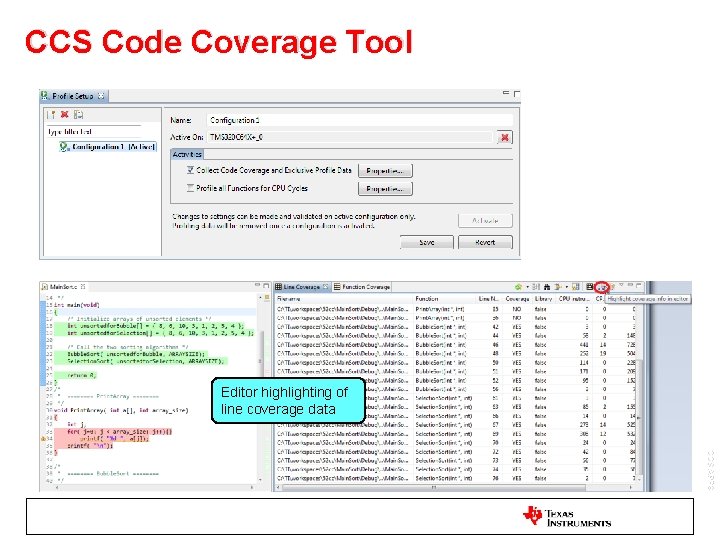
CCS Code Coverage Tool Editor highlighting of line coverage data CCS APPS
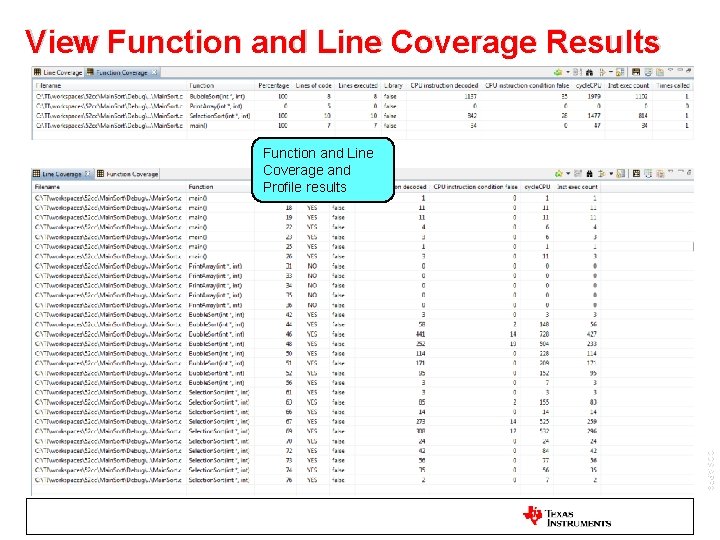
View Function and Line Coverage Results Function and Line Coverage and Profile results CCS APPS
CCS Profile Clock • A counter used to count events (usually cycles) when executing program from point A to point B (next time program is halted) • Data Collection – Enables and reads a counter on the target and then stores value on to a local buffer on the host (CCS) • The counter used varies from target to target • Usually the same counter that can be used by the CCS function profiler • Supported on: – (Almost) all targets • Very few targets do not support the profile clock (Cortex-Mx) CCS APPS
CCS Profile Clock • Pros – Easy to use – Supported on (almost) all targets • Cons – Only useful for basic use cases • Can only count events for one range at a time – Requires an emulation resource (can be an issue when emulation resources are lacking (HW breakpoints, watchpoints, etc) CCS APPS
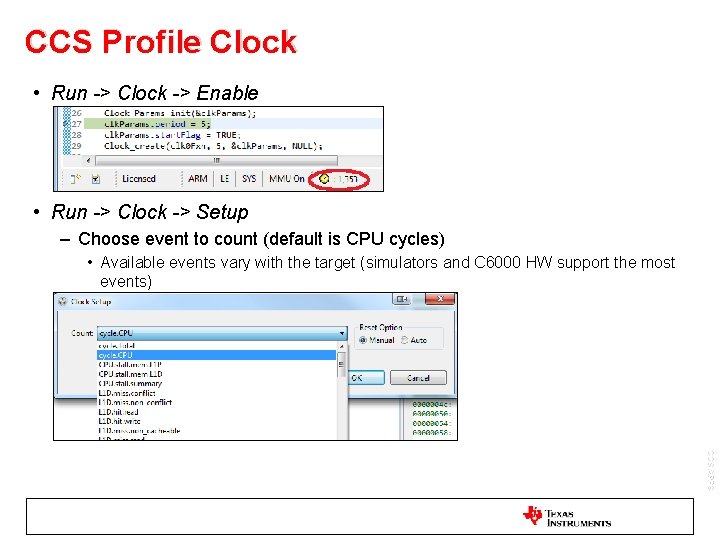
CCS Profile Clock • Run -> Clock -> Enable • Run -> Clock -> Setup – Choose event to count (default is CPU cycles) • Available events vary with the target (simulators and C 6000 HW support the most events) CCS APPS
Processor Trace • Provides profiling information for a program execution using processor (CPU) trace • Data Collection – PC discontinuity, data and event trace captured in an on-chip memory buffer (ETB) or a external dedicated trace receiver (XDS 560 v 2 Pro Trace Emulator) • ETB buffer size: 2 -8 KB (10 K – 30 K processor lines) • XDS 560 v 2 Pro Trace buffer size: 2 GB (1 M – 1 G processor lines) CCS APPS
Processor Trace • Pros – Great visibility into the program execution – CCS data visualization and analysis tools can process and display trace data in a number of useful formats • Exclusive Function Profile data • Line profiling data • Code Coverage data – No additional hardware needed to use the ETB • Cons – Only supported on select devices with an ETB or targets (device and board) that can support XDS 560 v 2 Pro Trace – Limited window of visibility when using the ETB due to limited buffer size – XDS 560 v 2 Pro Trace: CCS APPS • Expensive (~$3500 USD) • Supported by a limited number of C 6 x devices • Additional pins on the board for trace data
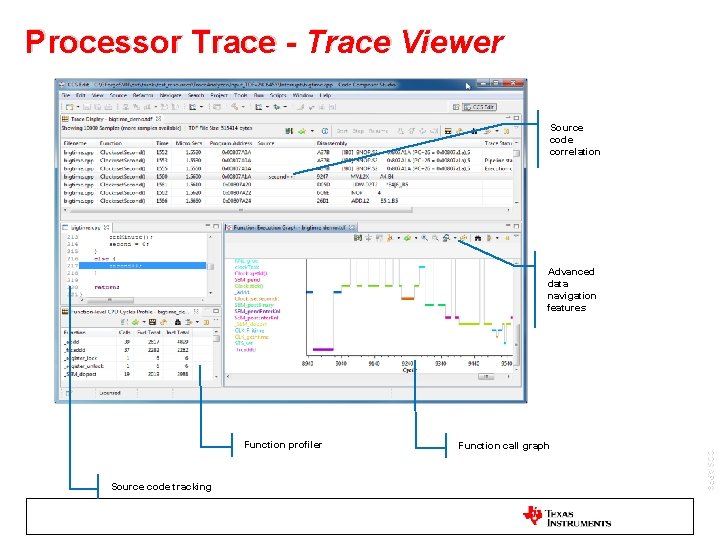
Processor Trace - Trace Viewer Source code correlation Advanced data navigation features Source code tracking Function call graph CCS APPS Function profiler
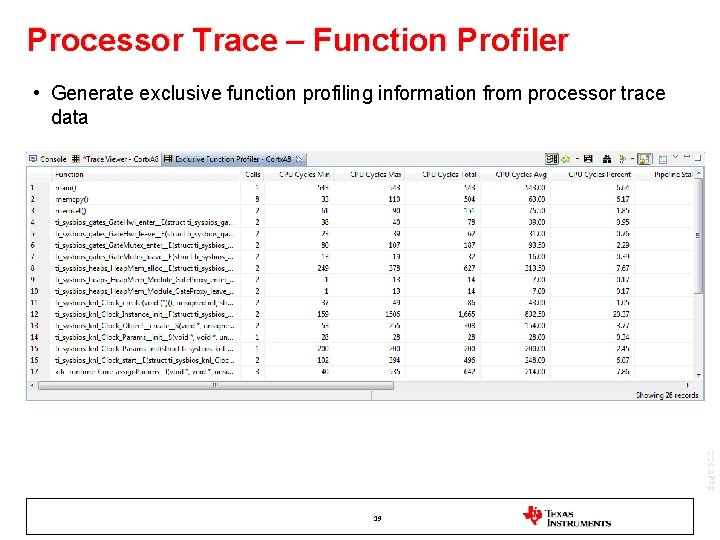
Processor Trace – Function Profiler • Generate exclusive function profiling information from processor trace data CCS APPS 19
System Trace • Trace capability that monitors synchronization and timing between cores and on-chip peripherals • Data Collection – Event (STM) messages captured in an on-chip memory buffer (ETB) or a external dedicated system trace receiver (XDS 560 v 2 STM Emulator) • ETB buffer size: 2 -8 KB • XDS 560 v 2 STM buffer size: 128 MB CCS APPS
System Trace • Pros – Provides system level visibility to software thread execution and hardware performance – CCS data visualization and analysis tools can process and display system trace data in a number of useful formats – No additional hardware needed to use the ETB • Cons – Only supported on select devices with an ETB or targets (device and board) that can support XDS 560 v 2 Pro Trace – Limited window of visibility when using the ETB due to limited buffer size – XDS 560 v 2 STM Trace: • Supported by a limited number of devices • Additional pins on the board for trace data CCS APPS
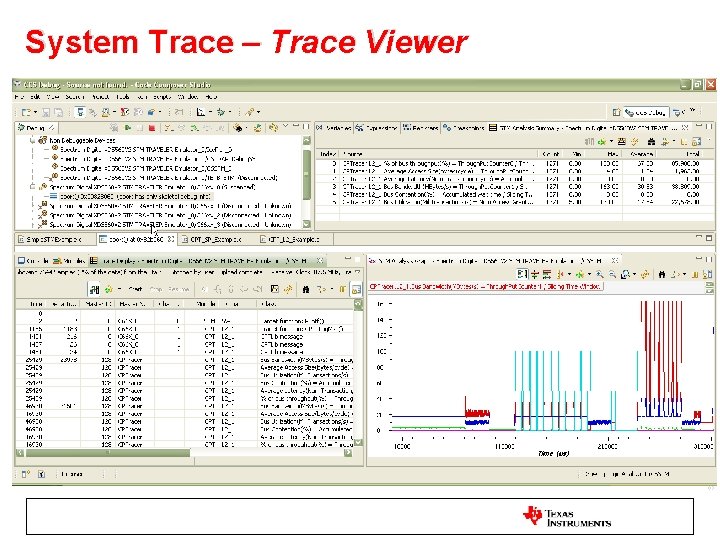
System Trace – Trace Viewer CCS APPS
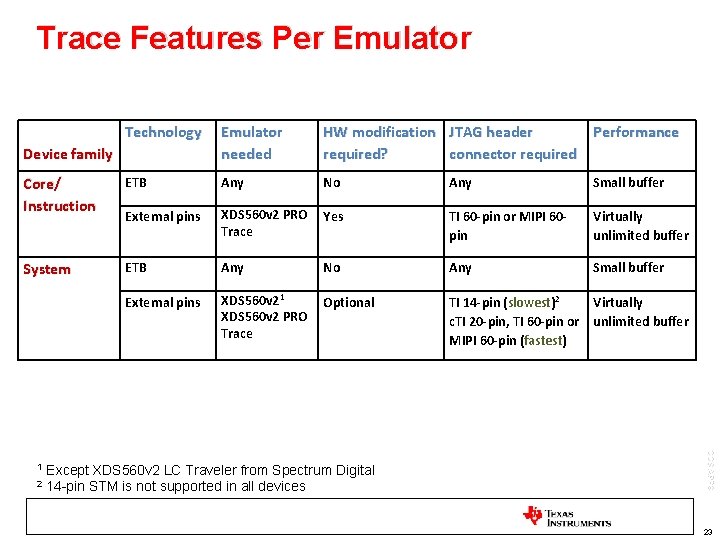
Trace Features Per Emulator Technology Emulator needed HW modification JTAG header Performance required? connector required Core/ Instruction ETB Any No Any Small buffer External pins XDS 560 v 2 PRO Trace Yes TI 60 -pin or MIPI 60 pin Virtually unlimited buffer System ETB Any No Any Small buffer External pins XDS 560 v 21 XDS 560 v 2 PRO Trace Optional TI 14 -pin (slowest)2 c. TI 20 -pin, TI 60 -pin or MIPI 60 -pin (fastest) Virtually unlimited buffer Device family 2 Except XDS 560 v 2 LC Traveler from Spectrum Digital 14 -pin STM is not supported in all devices CCS APPS 1 23
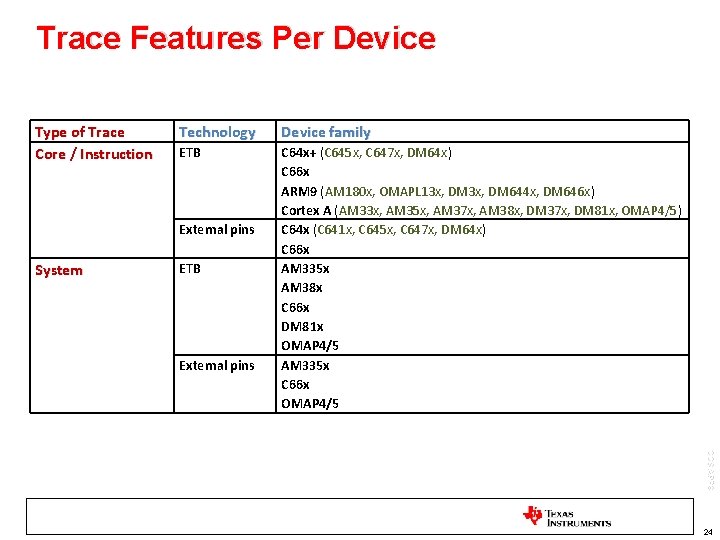
Trace Features Per Device Type of Trace Core / Instruction Technology Device family ETB C 64 x+ (C 645 x, C 647 x, DM 64 x) C 66 x ARM 9 (AM 180 x, OMAPL 13 x, DM 644 x, DM 646 x) Cortex A (AM 33 x, AM 35 x, AM 37 x, AM 38 x, DM 37 x, DM 81 x, OMAP 4/5) C 64 x (C 641 x, C 645 x, C 647 x, DM 64 x) C 66 x AM 335 x AM 38 x C 66 x DM 81 x OMAP 4/5 AM 335 x C 66 x OMAP 4/5 External pins System ETB External pins CCS APPS 24
Instrumented CCS APPS
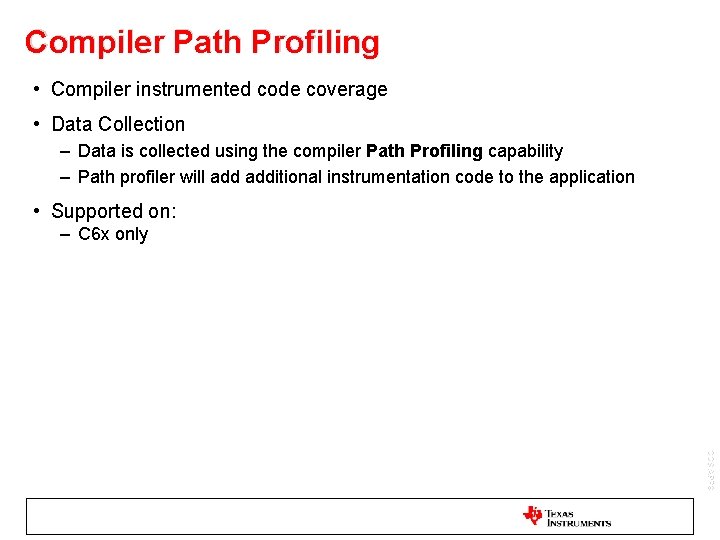
Compiler Path Profiling • Compiler instrumented code coverage • Data Collection – Data is collected using the compiler Path Profiling capability – Path profiler will additional instrumentation code to the application • Supported on: – C 6 x only CCS APPS
Compiler Path Profiling • Pros – Instrumentation code automatically handled by the compiler – Collected data can be used for generating profiling and code coverage reports – Integrated with CCS IDE • Cons – – Additional compile/run time and memory footprint overhead RTS library must be used Application must reach exit point Following applications will need additional tweaking to support writing of path profiling data Non-terminating No main() Custom boot/initialization routine No run-time initialization model selected in the linker options – JTAG connection required for C I/O call to write the PDAT file to the host (CCS uses JTAG to communicate to the target) CCS APPS • •
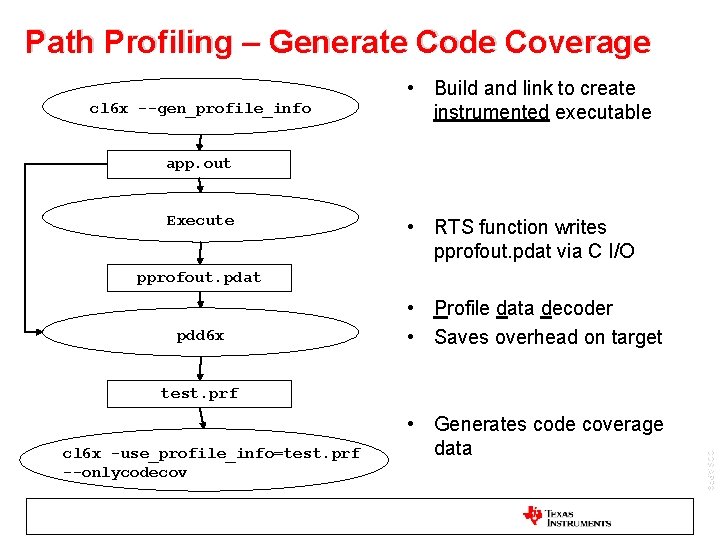
Path Profiling – Generate Code Coverage cl 6 x --gen_profile_info • Build and link to create instrumented executable app. out Execute • RTS function writes pprofout. pdat via C I/O pprofout. pdat pdd 6 x • Profile data decoder • Saves overhead on target test. prf CCS APPS cl 6 x -use_profile_info=test. prf --onlycodecov • Generates code coverage data
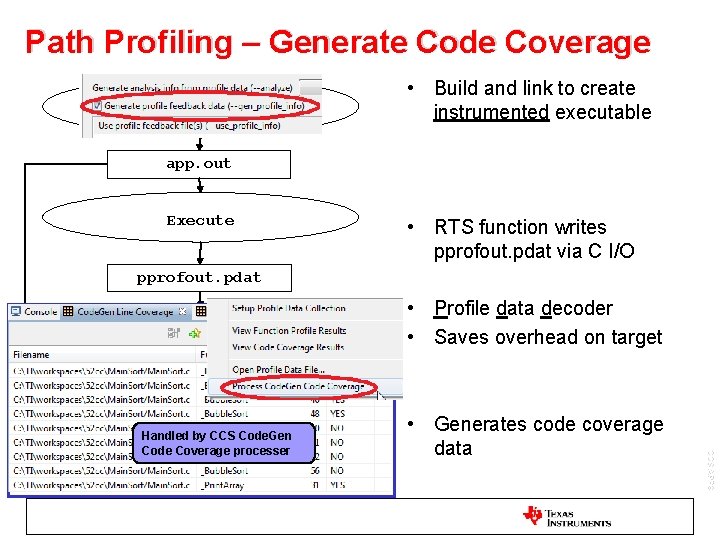
Path Profiling – Generate Code Coverage cl 6 x --gen_profile_info • Build and link to create instrumented executable app. out Execute • RTS function writes pprofout. pdat via C I/O pprofout. pdat pdd 6 x • Profile data decoder • Saves overhead on target test. prf cl 6 x --onlycodecov • Generates code coverage data CCS APPS Handled by CCS Code. Gen Code Coverage processer -use_profile_info=test. prf
System Analyzer / UIA • Real-time tool for analyzing, visualizing and profiling the performance and behavior of your application running on single or multiple cores • Data Collection – Data is collected via software instrumentation using the UIA (Unified Instrumentation Architecture) target packages and can be transported via Ethernet, JTAG (run-mode and stop-mode), STM or USB/UART to the host PC for analysis • Supported on: – C 64 x, C 64 x+, C 674 x, C 66 x, ARM 9, Cortex-M 3/4, Cortex-A 8, C 28 x, MSP 430 CCS APPS
System Analyzer / UIA • Pros – Visibility at the system level for So. C devices • Correlate data from multiple cores on a common time line – OS aware instrumentation data • Context aware function profiling – ‘Out of the box’ support for SYS/BIOS • Cons – Requires use of the UIA target package • Must be ported to run on non-SYS/BIOS OS – Non custom configurations can require a good deal of setup – Learning curve for effectively using UIA CCS APPS
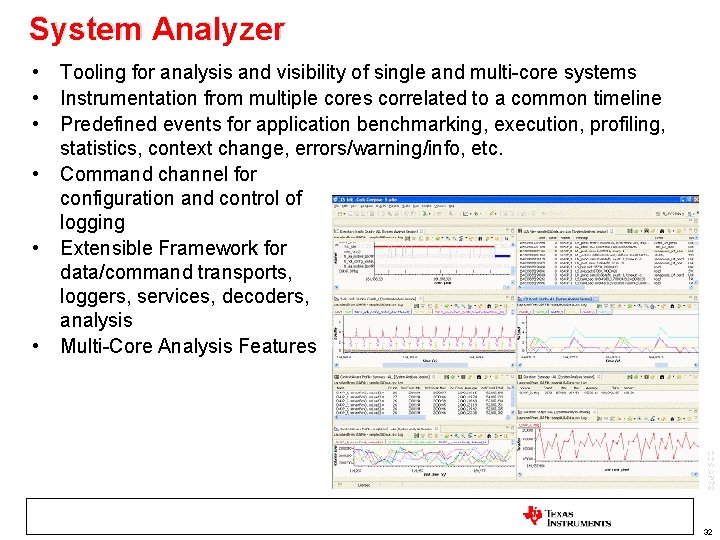
System Analyzer • • • Tooling for analysis and visibility of single and multi-core systems Instrumentation from multiple cores correlated to a common timeline Predefined events for application benchmarking, execution, profiling, statistics, context change, errors/warning/info, etc. Command channel for configuration and control of logging Extensible Framework for data/command transports, loggers, services, decoders, analysis Multi-Core Analysis Features CCS APPS 32
- Slides: 31