Profiling Network Performance in Multitier Datacenter Applications Minlan
- Slides: 48

Profiling Network Performance in Multi-tier Datacenter Applications Minlan Yu minlanyu@cs. princeton. edu Princeton University Joint work with Albert Greenberg, Dave Maltz, Jennifer Rexford, Lihua Yuan, Srikanth Kandula, Changhoon Kim 1

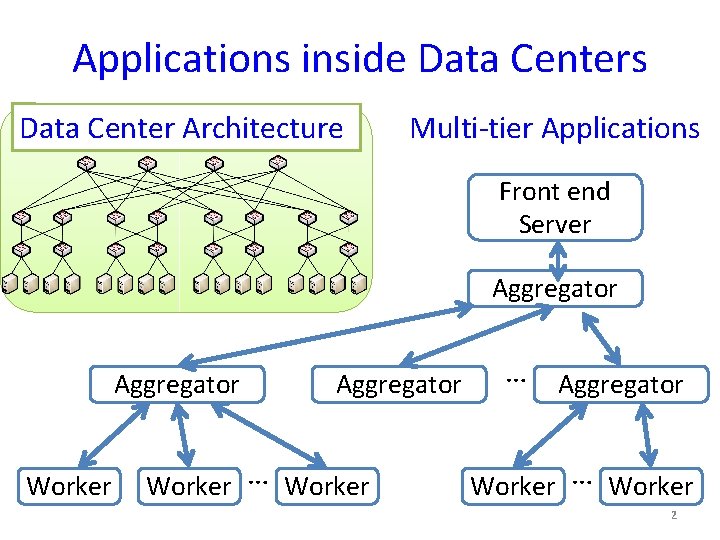
Applications inside Data Centers Data Center Architecture Multi-tier Applications Front end Server Aggregator Worker … … Aggregator Worker … Worker 2

Challenges of Datacenter Diagnosis • Multi-tier applications – Tens of hundreds of application components – Tens of thousands of servers • Evolving applications – Add new features, fix bugs – Change components while app is still in operation • Human factors – Developers may not understand network well – Nagle’s algorithm, delayed ACK, etc. 3

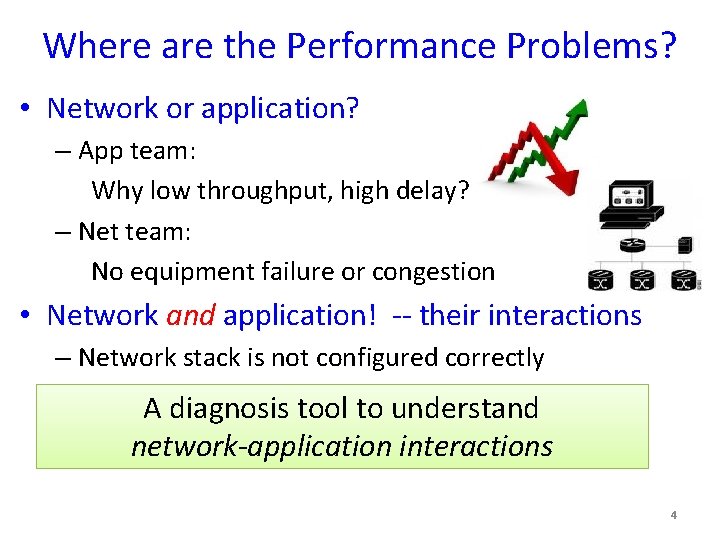
Where are the Performance Problems? • Network or application? – App team: Why low throughput, high delay? – Net team: No equipment failure or congestion • Network and application! -- their interactions – Network stack is not configured correctly – Small A application by TCP diagnosiswrites tool delayed to understand – TCP incast: synchronized writes cause packet loss network-application interactions 4

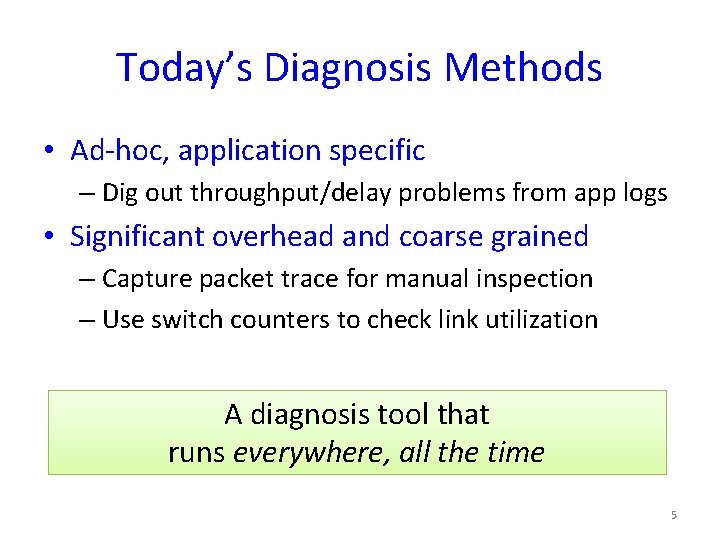
Today’s Diagnosis Methods • Ad-hoc, application specific – Dig out throughput/delay problems from app logs • Significant overhead and coarse grained – Capture packet trace for manual inspection – Use switch counters to check link utilization A diagnosis tool that runs everywhere, all the time 5

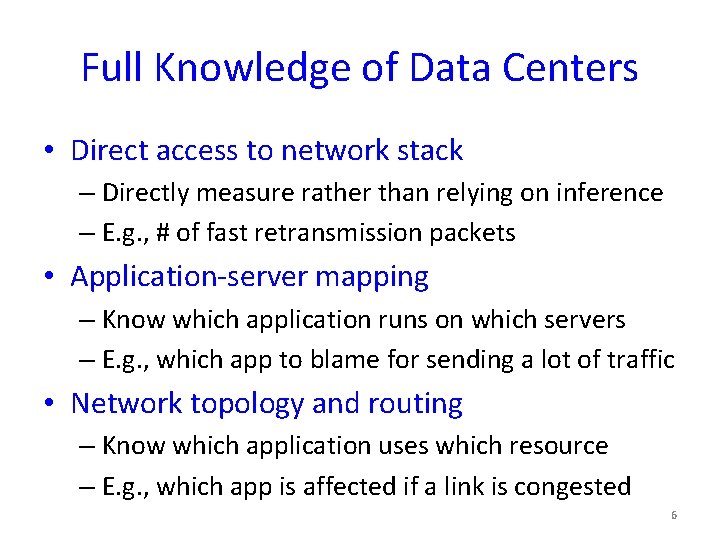
Full Knowledge of Data Centers • Direct access to network stack – Directly measure rather than relying on inference – E. g. , # of fast retransmission packets • Application-server mapping – Know which application runs on which servers – E. g. , which app to blame for sending a lot of traffic • Network topology and routing – Know which application uses which resource – E. g. , which app is affected if a link is congested 6

SNAP: Scalable Net-App Profiler 7

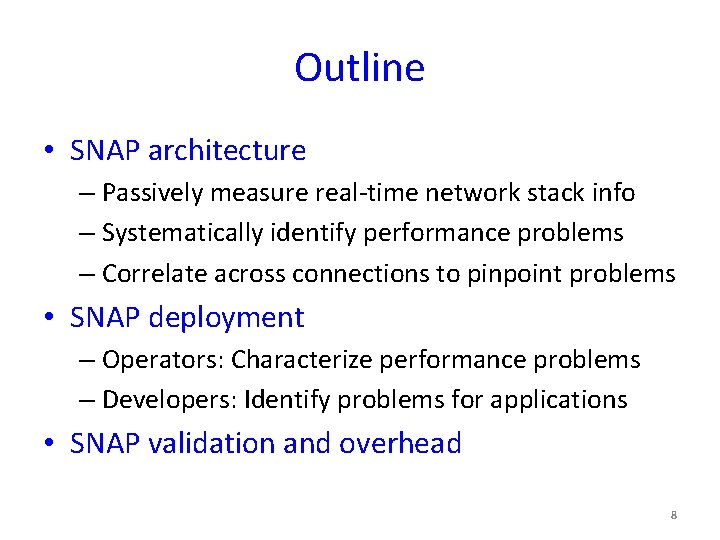
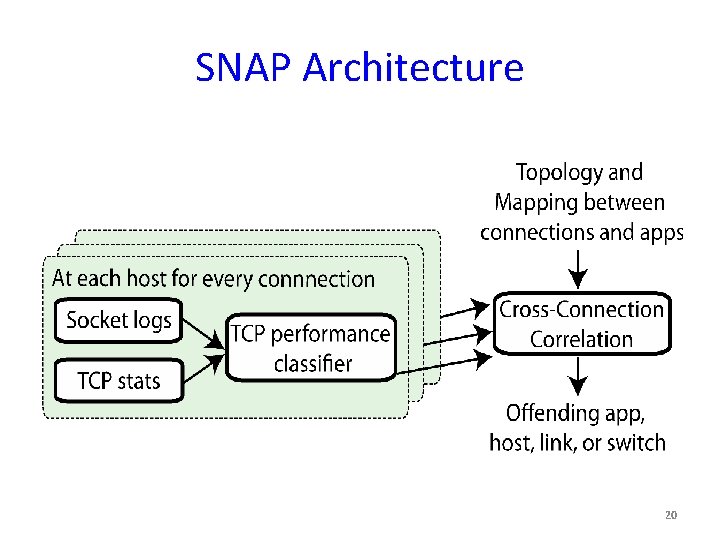
Outline • SNAP architecture – Passively measure real-time network stack info – Systematically identify performance problems – Correlate across connections to pinpoint problems • SNAP deployment – Operators: Characterize performance problems – Developers: Identify problems for applications • SNAP validation and overhead 8

SNAP Architecture Step 1: Network-stack measurements 9

What Data to Collect? • Goals: – Fine-grained: in milliseconds or seconds – Low overhead: low CPU overhead and data volume – Generic across applications • Two types of data: – Poll TCP statistics Network performance – Event-driven socket logging App expectation – Both exist in today’s linux and windows systems 10

TCP statistics • Instantaneous snapshots – #Bytes in the send buffer – Congestion window size, receiver window size – Snapshots based on Poisson sampling • Cumulative counters – #Fast. Retrans, #Timeout – RTT estimation: #Sample. RTT, #Sum. RTT – Rwin. Limit. Time – Calculate difference between two polls 11

SNAP Architecture Step 2: Performance problem classification 12

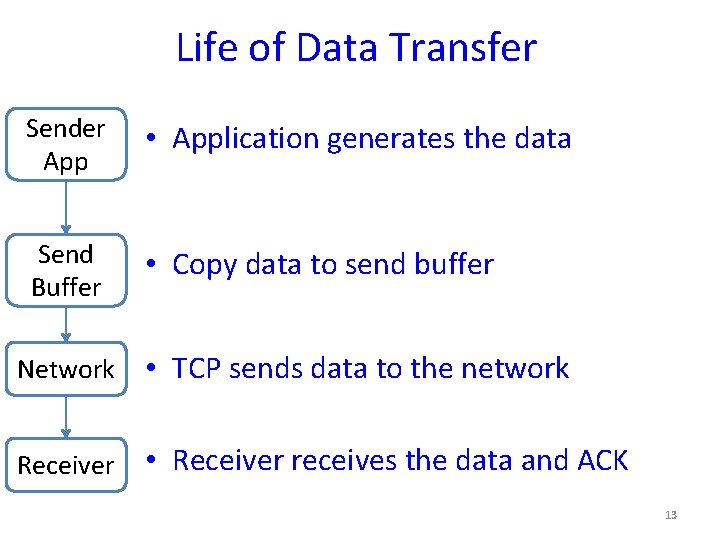
Life of Data Transfer Sender App • Application generates the data Send Buffer • Copy data to send buffer Network • TCP sends data to the network Receiver • Receiver receives the data and ACK 13

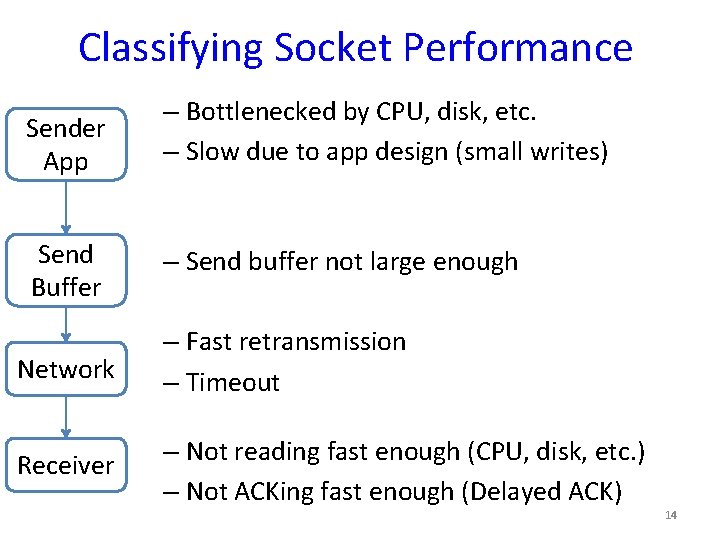
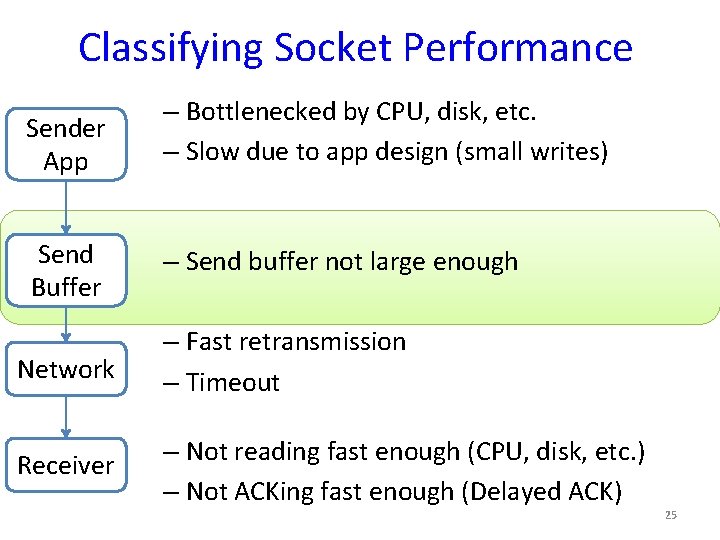
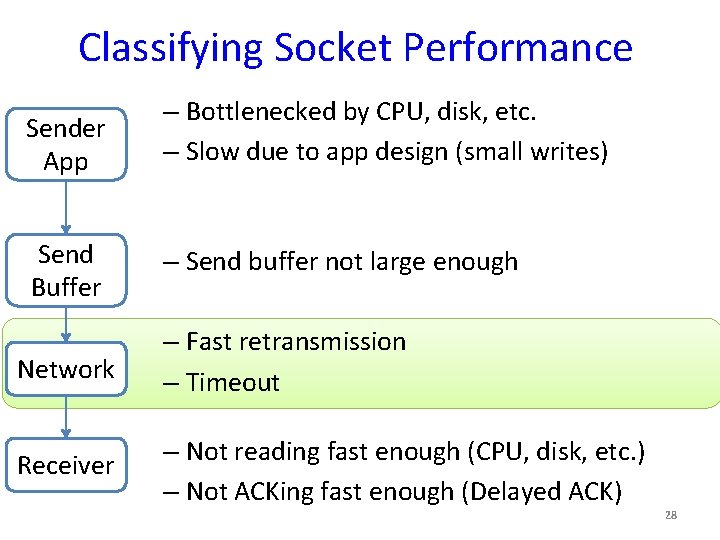
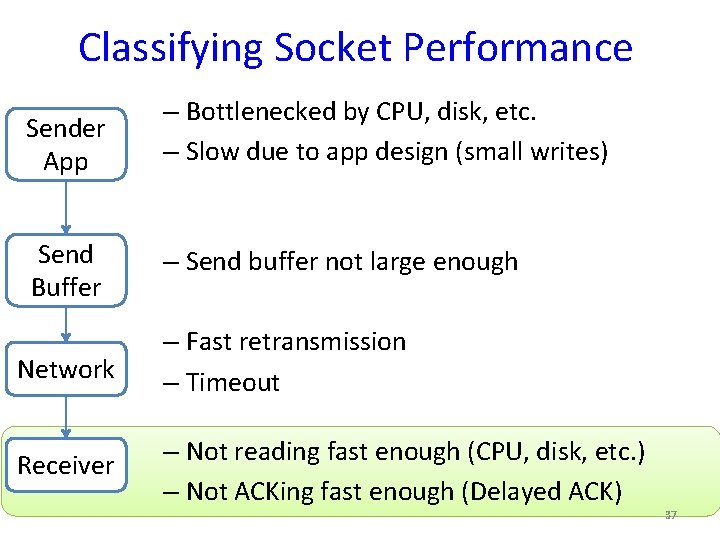
Classifying Socket Performance Sender App – Bottlenecked by CPU, disk, etc. – Slow due to app design (small writes) Send Buffer – Send buffer not large enough Network – Fast retransmission – Timeout Receiver – Not reading fast enough (CPU, disk, etc. ) – Not ACKing fast enough (Delayed ACK) 14

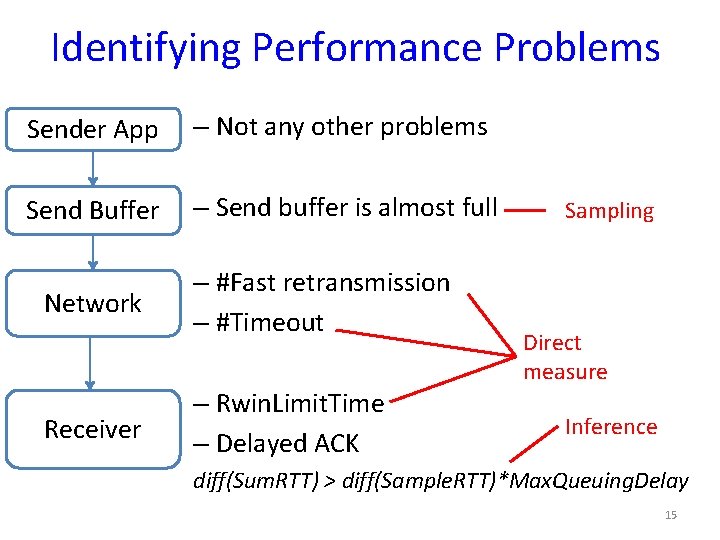
Identifying Performance Problems Sender App – Not any other problems Send Buffer – Send buffer is almost full Network Receiver – #Fast retransmission – #Timeout – Rwin. Limit. Time – Delayed ACK Sampling Direct measure Inference diff(Sum. RTT) > diff(Sample. RTT)*Max. Queuing. Delay 15

SNAP Architecture Step 3: Correlation across connections 16

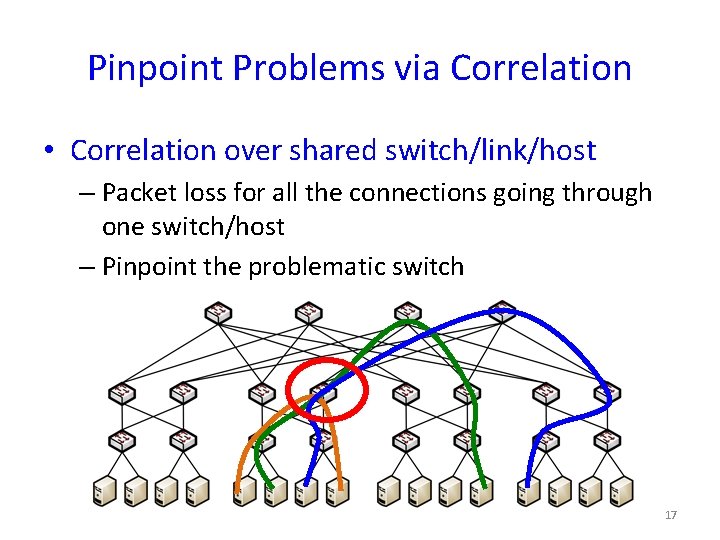
Pinpoint Problems via Correlation • Correlation over shared switch/link/host – Packet loss for all the connections going through one switch/host – Pinpoint the problematic switch 17

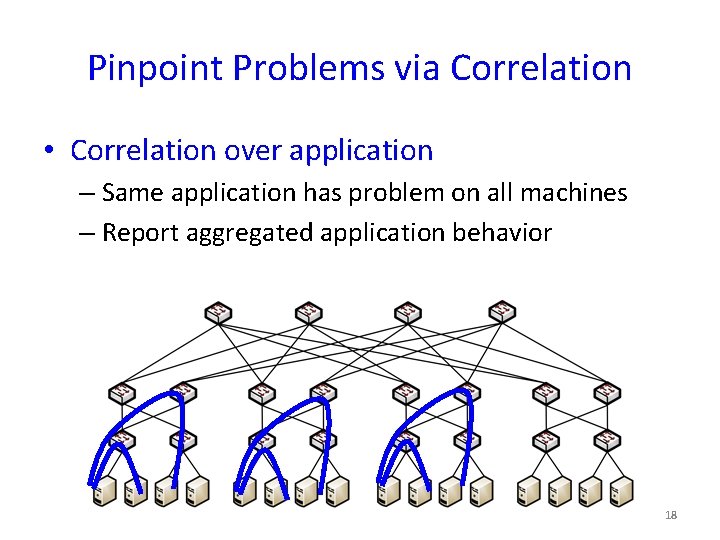
Pinpoint Problems via Correlation • Correlation over application – Same application has problem on all machines – Report aggregated application behavior 18

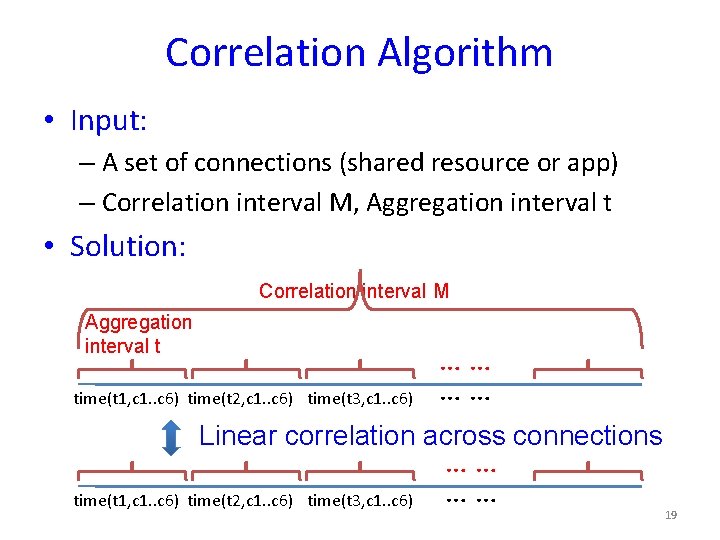
Correlation Algorithm • Input: – A set of connections (shared resource or app) – Correlation interval M, Aggregation interval t • Solution: Correlation interval M Aggregation interval t time(t 1, c 1. . c 6) time(t 2, c 1. . c 6) time(t 3, c 1. . c 6) …… …… Linear correlation across connections time(t 1, c 1. . c 6) time(t 2, c 1. . c 6) time(t 3, c 1. . c 6) …… …… 19

SNAP Architecture 20

SNAP Deployment 21

SNAP Deployment • Production data center – 8 K machines, 700 applications – Ran SNAP for a week, collected petabytes of data • Operators: Profiling the whole data center – Characterize the sources of performance problems – Key problems in the data center • Developers: Profiling individual applications – Pinpoint problems in app software, network stack, and their interactions 22

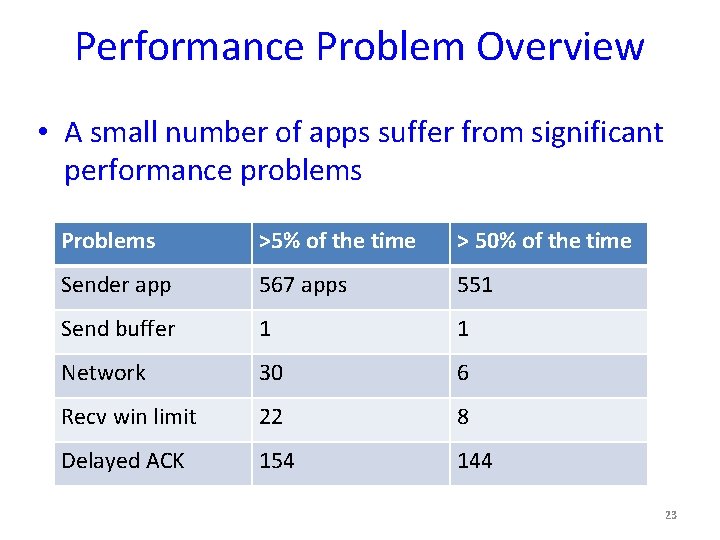
Performance Problem Overview • A small number of apps suffer from significant performance problems Problems >5% of the time > 50% of the time Sender app 567 apps 551 Send buffer 1 1 Network 30 6 Recv win limit 22 8 Delayed ACK 154 144 23

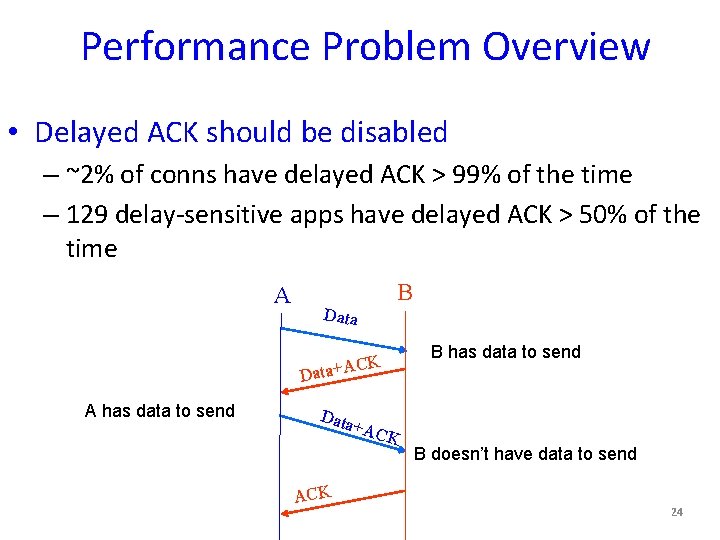
Performance Problem Overview • Delayed ACK should be disabled – ~2% of conns have delayed ACK > 99% of the time – 129 delay-sensitive apps have delayed ACK > 50% of the time A Data B CK Data+A A has data to send Data ACK +AC K B has data to send B doesn’t have data to send 24

Classifying Socket Performance Sender App – Bottlenecked by CPU, disk, etc. – Slow due to app design (small writes) Send Buffer – Send buffer not large enough Network – Fast retransmission – Timeout Receiver – Not reading fast enough (CPU, disk, etc. ) – Not ACKing fast enough (Delayed ACK) 25

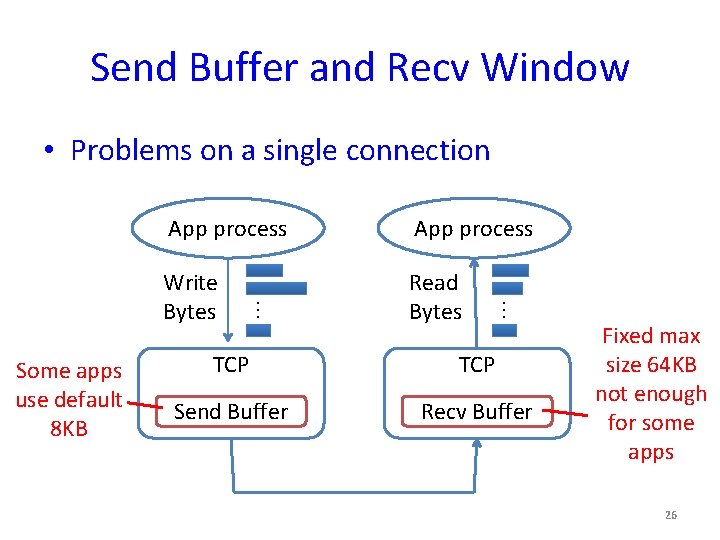
Send Buffer and Recv Window • Problems on a single connection Some apps use default 8 KB Write Bytes Read Bytes … App process TCP Send Buffer Recv Buffer Fixed max size 64 KB not enough for some apps 26

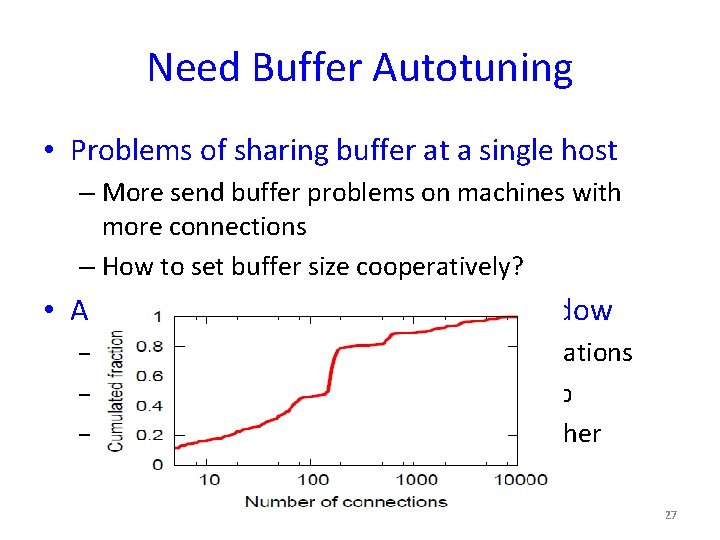
Need Buffer Autotuning • Problems of sharing buffer at a single host – More send buffer problems on machines with more connections – How to set buffer size cooperatively? • Auto-tuning send buffer and recv window – Dynamically allocate buffer across applications – Based on congestion window of each app – Tune send buffer and recv window together 27

Classifying Socket Performance Sender App – Bottlenecked by CPU, disk, etc. – Slow due to app design (small writes) Send Buffer – Send buffer not large enough Network – Fast retransmission – Timeout Receiver – Not reading fast enough (CPU, disk, etc. ) – Not ACKing fast enough (Delayed ACK) 28

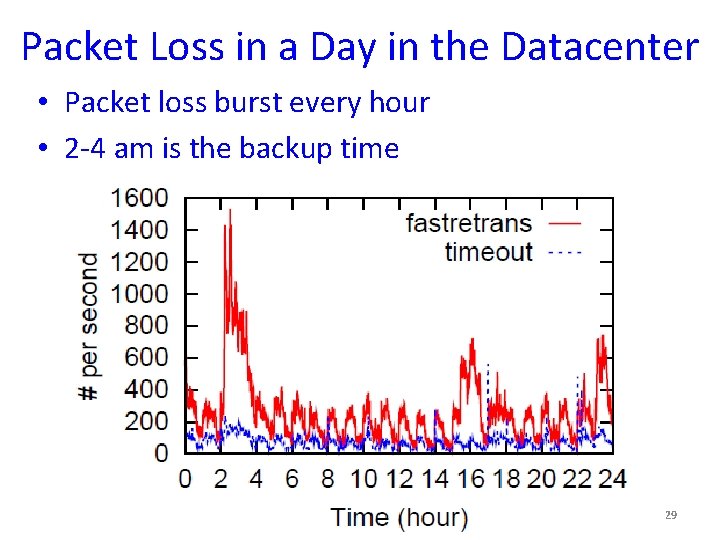
Packet Loss in a Day in the Datacenter • Packet loss burst every hour • 2 -4 am is the backup time 29

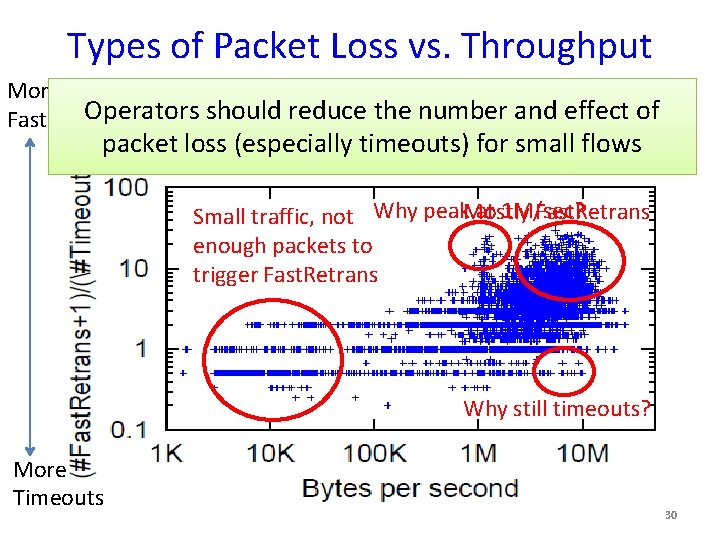
Types of Packet Loss vs. Throughput More Operators should reduce the number and effect of Fast. Retrans packet loss (especially timeouts)at foreach small flows One point for each connection interval at 1 M/sec? Fast. Retrans Small traffic, not Why peak. Mostly enough packets to trigger Fast. Retrans Why still timeouts? More Timeouts 30

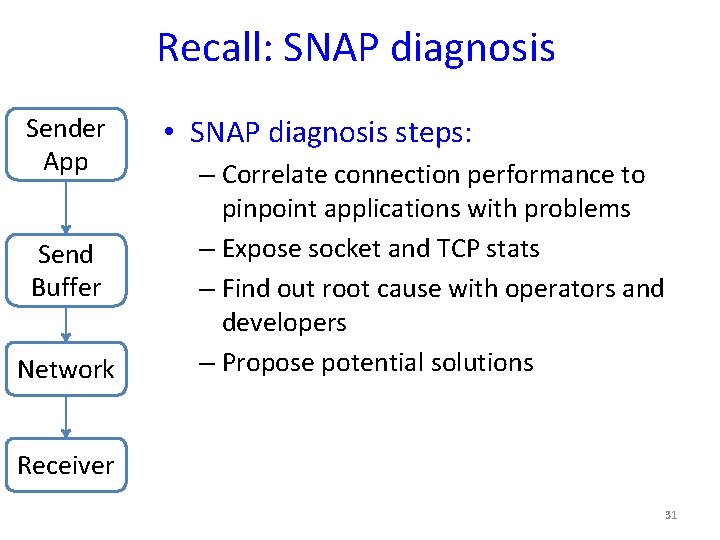
Recall: SNAP diagnosis Sender App Send Buffer Network • SNAP diagnosis steps: – Correlate connection performance to pinpoint applications with problems – Expose socket and TCP stats – Find out root cause with operators and developers – Propose potential solutions Receiver 31

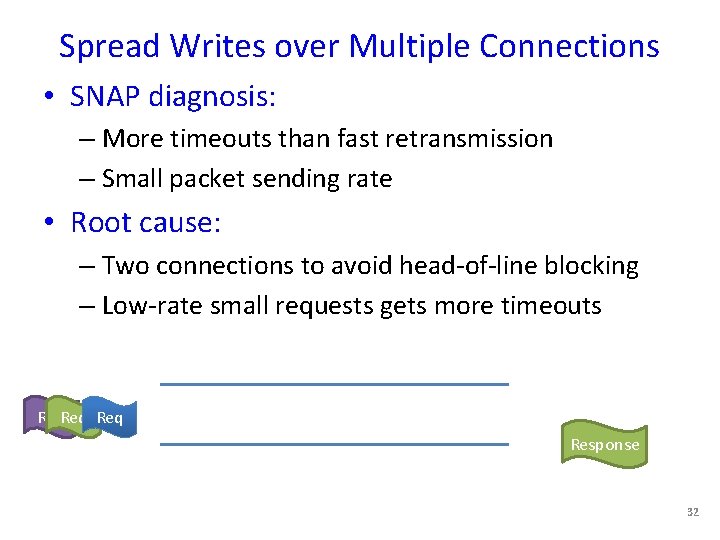
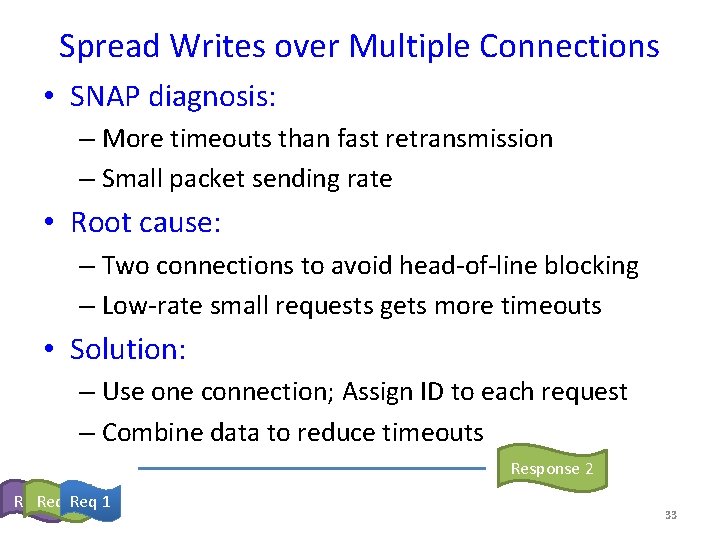
Spread Writes over Multiple Connections • SNAP diagnosis: – More timeouts than fast retransmission – Small packet sending rate • Root cause: – Two connections to avoid head-of-line blocking – Low-rate small requests gets more timeouts Req Response 32

Spread Writes over Multiple Connections • SNAP diagnosis: – More timeouts than fast retransmission – Small packet sending rate • Root cause: – Two connections to avoid head-of-line blocking – Low-rate small requests gets more timeouts • Solution: – Use one connection; Assign ID to each request – Combine data to reduce timeouts Response 2 Req 3 2 Req 1 33

Congestion Window Allows Sudden Bursts • SNAP diagnosis: – Significant packet loss – Congestion window is too large after an idle period • Root cause: – Slow start restart is disabled 34

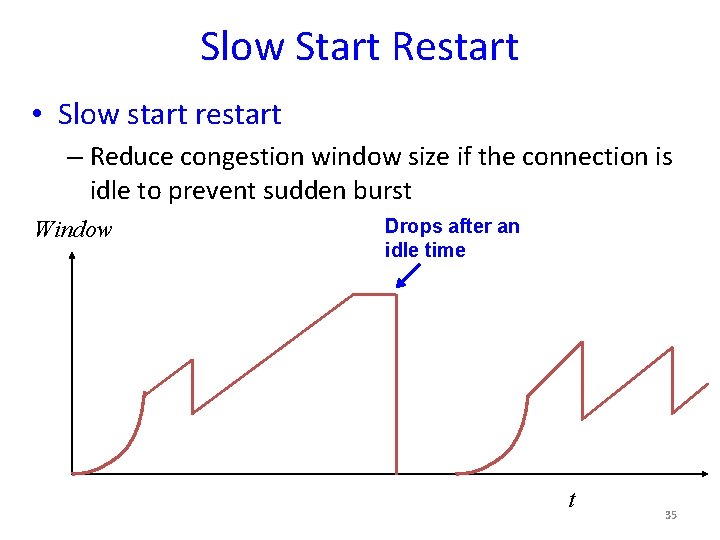
Slow Start Restart • Slow start restart – Reduce congestion window size if the connection is idle to prevent sudden burst Window Drops after an idle time t 35

Slow Start Restart • However, developers disabled it because: – Intentionally increase congestion window over a persistent connection to reduce delay – E. g. , if congestion window is large, it just takes 1 RTT to send 64 KB data • Potential solution: – New congestion control for delay sensitive traffic 36

Classifying Socket Performance Sender App – Bottlenecked by CPU, disk, etc. – Slow due to app design (small writes) Send Buffer – Send buffer not large enough Network – Fast retransmission – Timeout Receiver – Not reading fast enough (CPU, disk, etc. ) – Not ACKing fast enough (Delayed ACK) 37

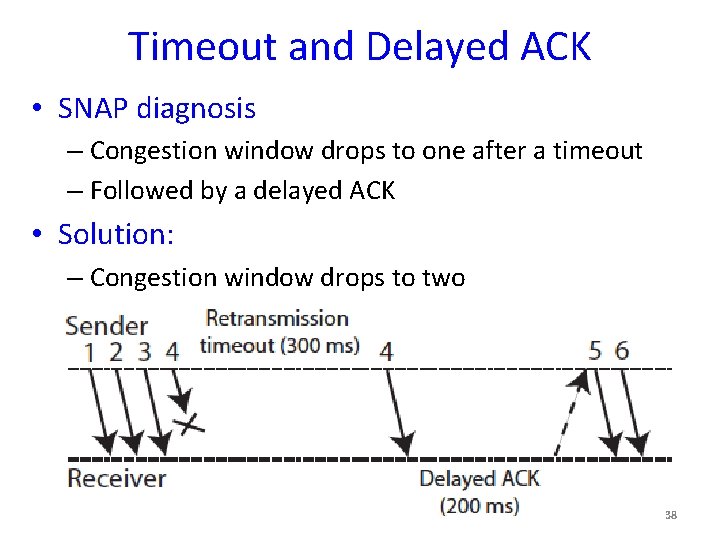
Timeout and Delayed ACK • SNAP diagnosis – Congestion window drops to one after a timeout – Followed by a delayed ACK • Solution: – Congestion window drops to two 38

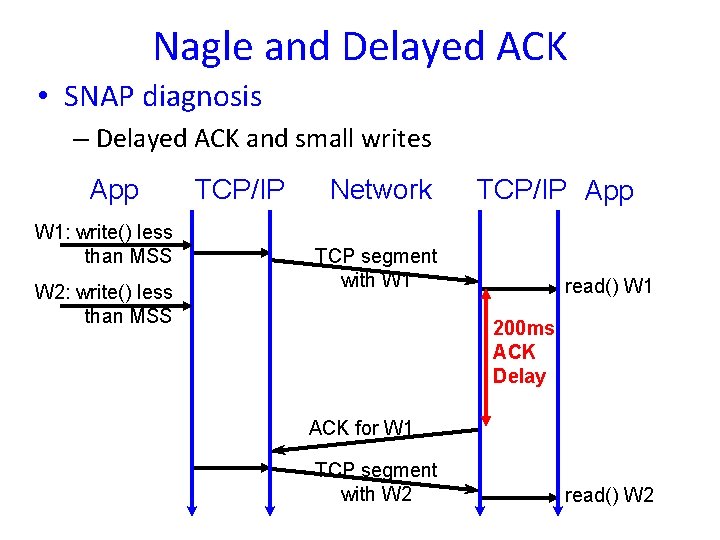
Nagle and Delayed ACK • SNAP diagnosis – Delayed ACK and small writes App W 1: write() less than MSS W 2: write() less than MSS TCP/IP Network TCP/IP App TCP segment with W 1 read() W 1 200 ms ACK Delay ACK for W 1 TCP segment with W 2 read() W 2

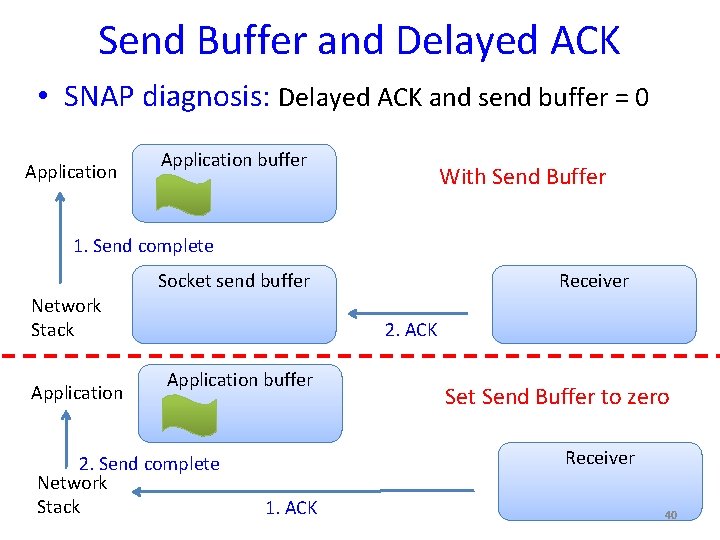
Send Buffer and Delayed ACK • SNAP diagnosis: Delayed ACK and send buffer = 0 Application buffer With Send Buffer 1. Send complete Socket send buffer Network Stack Application Receiver 2. ACK Application buffer 2. Send complete Network Stack Set Send Buffer to zero Receiver 1. ACK 40

SNAP Validation and Overhead 41

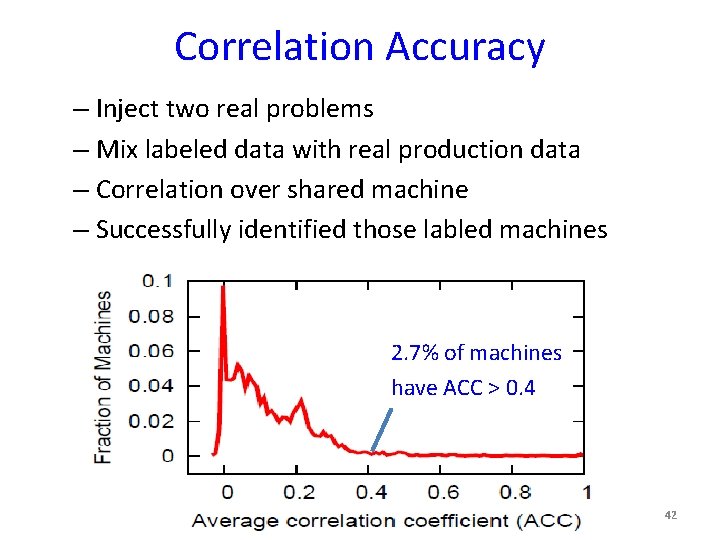
Correlation Accuracy – Inject two real problems – Mix labeled data with real production data – Correlation over shared machine – Successfully identified those labled machines 2. 7% of machines have ACC > 0. 4 42

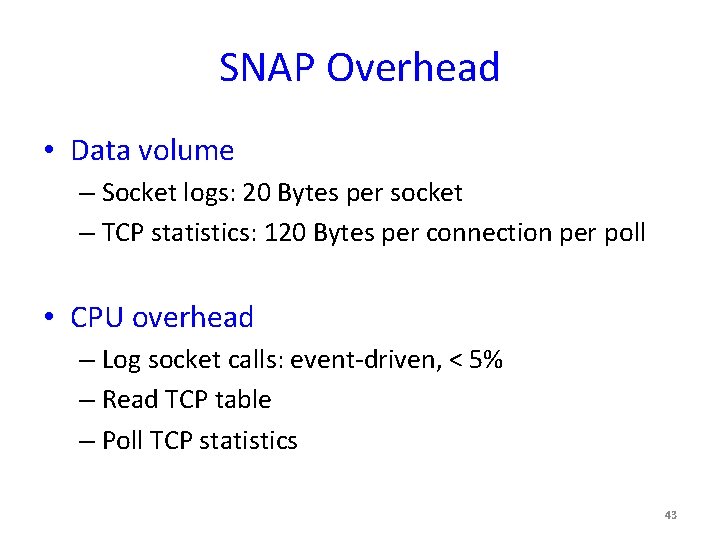
SNAP Overhead • Data volume – Socket logs: 20 Bytes per socket – TCP statistics: 120 Bytes per connection per poll • CPU overhead – Log socket calls: event-driven, < 5% – Read TCP table – Poll TCP statistics 43

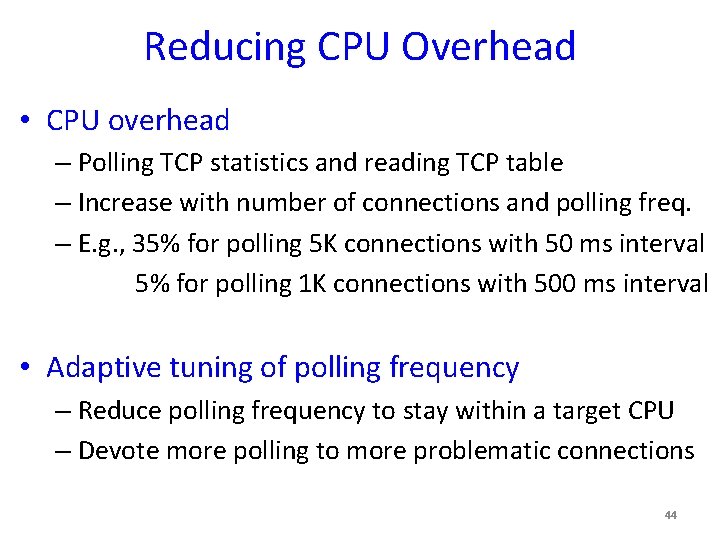
Reducing CPU Overhead • CPU overhead – Polling TCP statistics and reading TCP table – Increase with number of connections and polling freq. – E. g. , 35% for polling 5 K connections with 50 ms interval 5% for polling 1 K connections with 500 ms interval • Adaptive tuning of polling frequency – Reduce polling frequency to stay within a target CPU – Devote more polling to more problematic connections 44

Conclusion • A simple, efficient way to profile data centers – Passively measure real-time network stack information – Systematically identify components with problems – Correlate problems across connections • Deploying SNAP in production data center – Characterize data center performance problems • Help operators improve platform and tune network – Discover app-net interactions • Help developers to pinpoint app problems 45

Class Discussion • Does TCP fit for data centers? – How to optimize TCP for data centers? – What should new transport protocol be? • How to diagnose data center performance problems? – What kind of network/application data do we need? – How to diagnose virtualized environment? – How to perform active measurement? 46

Backup 47

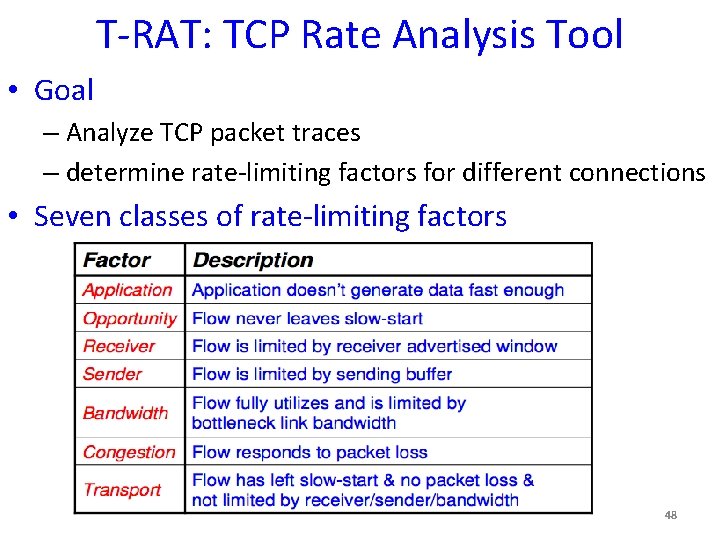
T-RAT: TCP Rate Analysis Tool • Goal – Analyze TCP packet traces – determine rate-limiting factors for different connections • Seven classes of rate-limiting factors 48