Profiling Antonio GmezIglesias agomeztacc utexas edu Texas Advanced




- Slides: 77

Profiling Antonio Gómez-Iglesias agomez@tacc. utexas. edu Texas Advanced Computing Center

Outline • Introduction • Intermediate tools – Perfexpert • Basic Tools – – Command line timers Code timers gprof IPM • Advanced Tools – HPCToolkit – Vtune – Tau

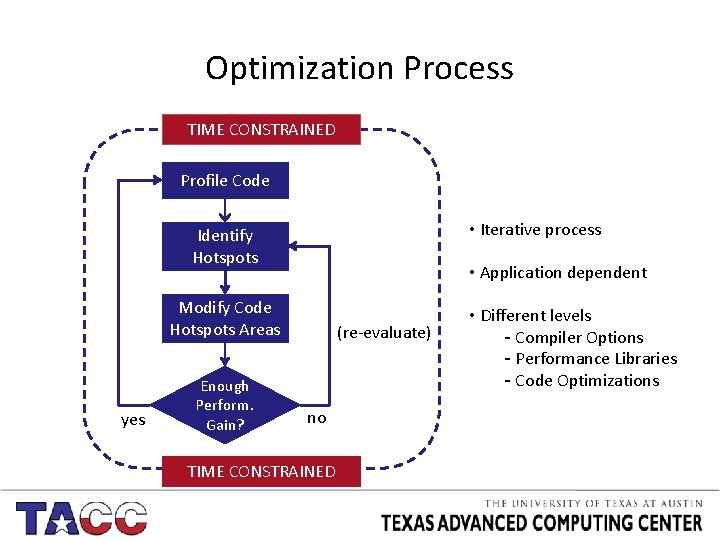
Optimization Process TIME CONSTRAINED Profile Code • Iterative process Identify Hotspots • Application dependent Modify Code Hotspots Areas yes Enough Perform. Gain? (re-evaluate) no TIME CONSTRAINED • Different levels - Compiler Options - Performance Libraries - Code Optimizations

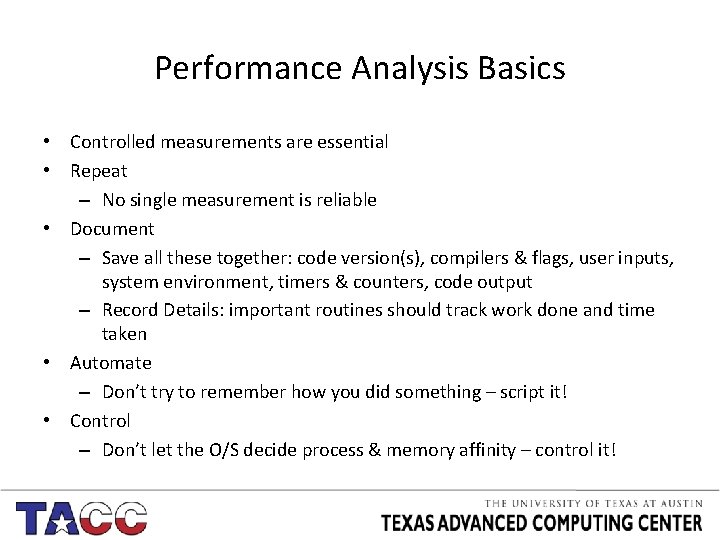
Performance Analysis Basics • Controlled measurements are essential • Repeat – No single measurement is reliable • Document – Save all these together: code version(s), compilers & flags, user inputs, system environment, timers & counters, code output – Record Details: important routines should track work done and time taken • Automate – Don’t try to remember how you did something – script it! • Control – Don’t let the O/S decide process & memory affinity – control it!

Disclaimer: counting flops • The latest Intel processors base floating point operation counts on issued instructions. • This can lead to severe miscounts, since an instruction may be reissued multiple times before it can be retired (executed) • This applies to Sandy Bridge, Ivy Bridge and Haswell CPUs • The Intel Xeon Phi co-processor does not have any means of measuring floating point operations directly

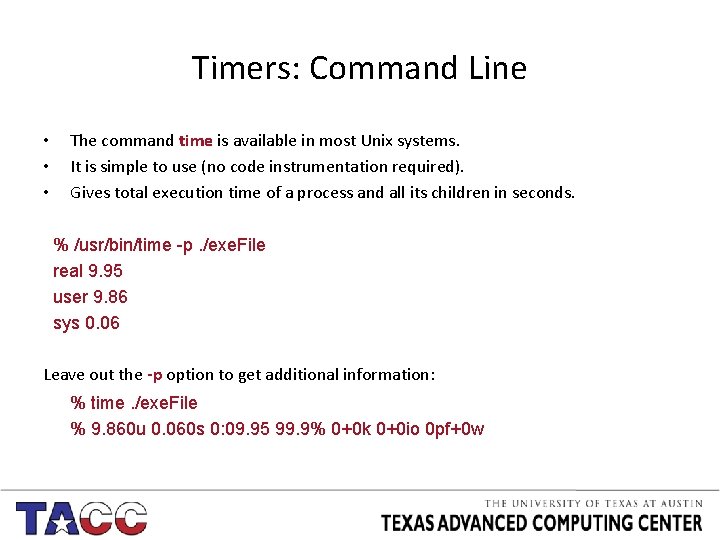
Timers: Command Line • • • The command time is available in most Unix systems. It is simple to use (no code instrumentation required). Gives total execution time of a process and all its children in seconds. % /usr/bin/time -p. /exe. File real 9. 95 user 9. 86 sys 0. 06 Leave out the -p option to get additional information: % time. /exe. File % 9. 860 u 0. 060 s 0: 09. 95 99. 9% 0+0 k 0+0 io 0 pf+0 w

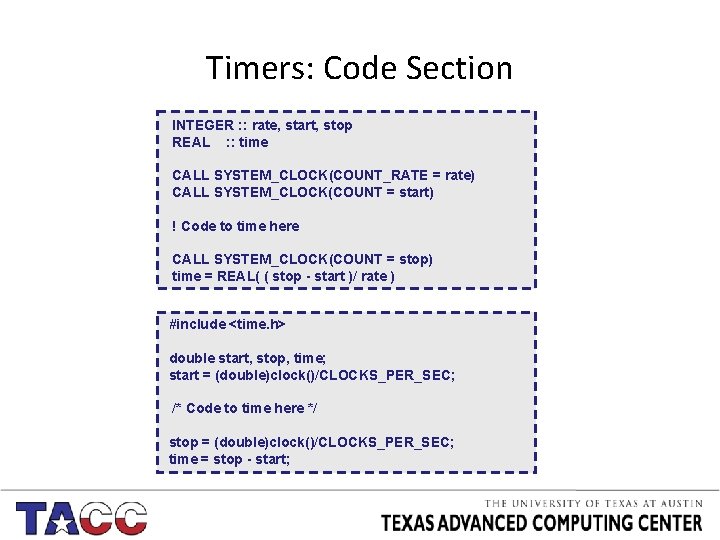
Timers: Code Section INTEGER : : rate, start, stop REAL : : time CALL SYSTEM_CLOCK(COUNT_RATE = rate) CALL SYSTEM_CLOCK(COUNT = start) ! Code to time here CALL SYSTEM_CLOCK(COUNT = stop) time = REAL( ( stop - start )/ rate ) #include <time. h> double start, stop, time; start = (double)clock()/CLOCKS_PER_SEC; /* Code to time here */ stop = (double)clock()/CLOCKS_PER_SEC; time = stop - start;

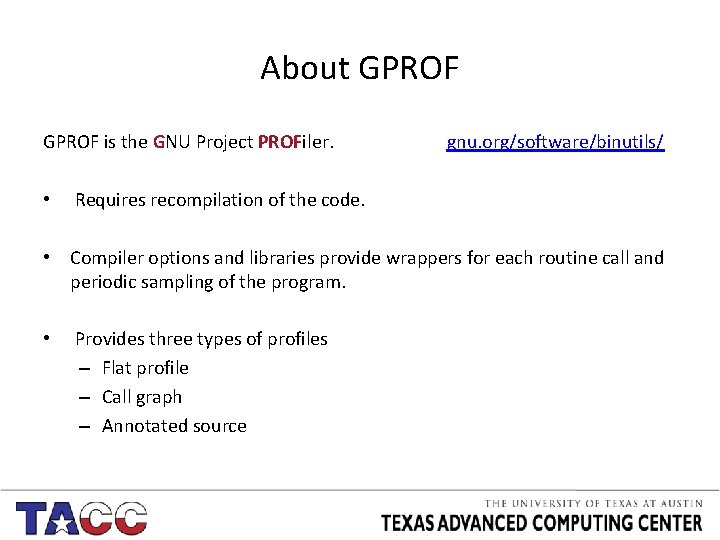
About GPROF is the GNU Project PROFiler. • gnu. org/software/binutils/ Requires recompilation of the code. • Compiler options and libraries provide wrappers for each routine call and periodic sampling of the program. • Provides three types of profiles – Flat profile – Call graph – Annotated source

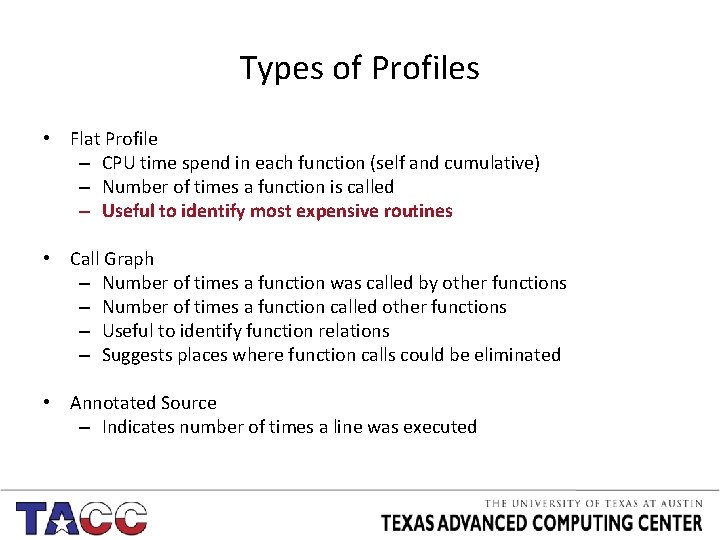
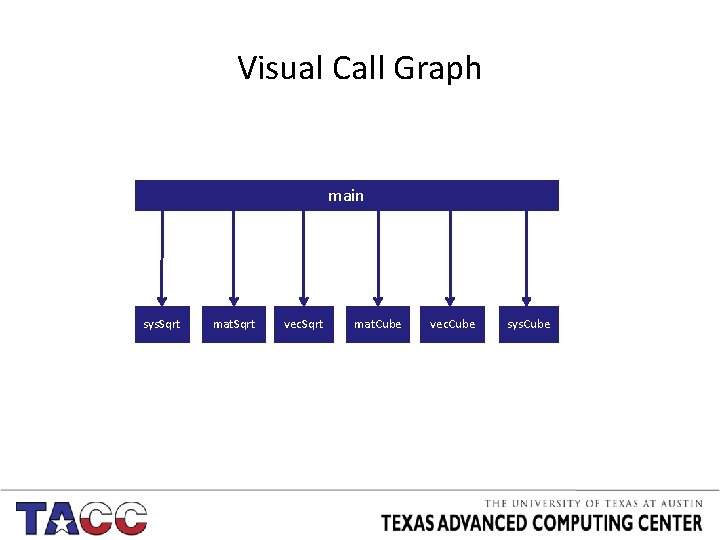
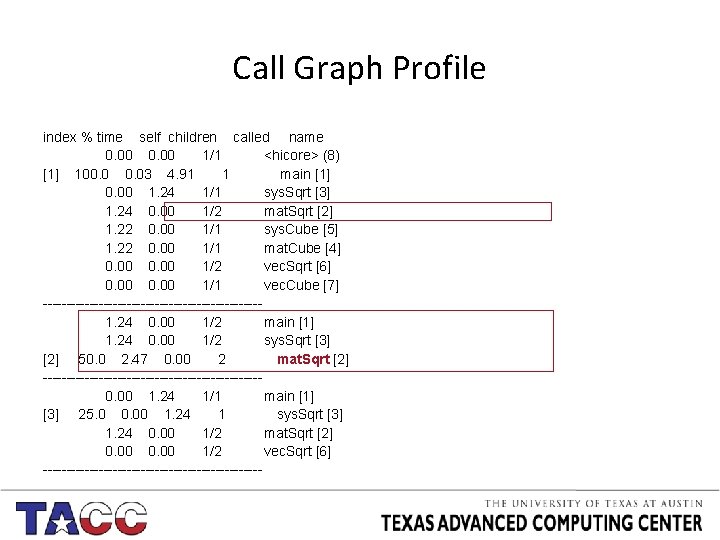
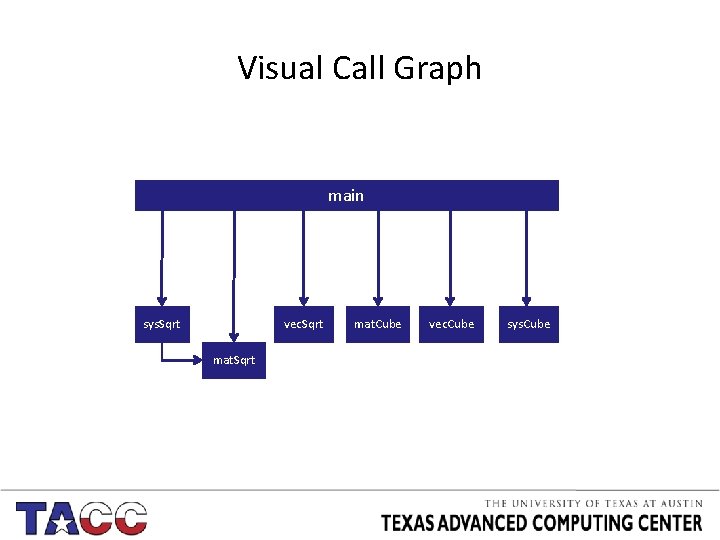
Types of Profiles • Flat Profile – CPU time spend in each function (self and cumulative) – Number of times a function is called – Useful to identify most expensive routines • Call Graph – Number of times a function was called by other functions – Number of times a function called other functions – Useful to identify function relations – Suggests places where function calls could be eliminated • Annotated Source – Indicates number of times a line was executed

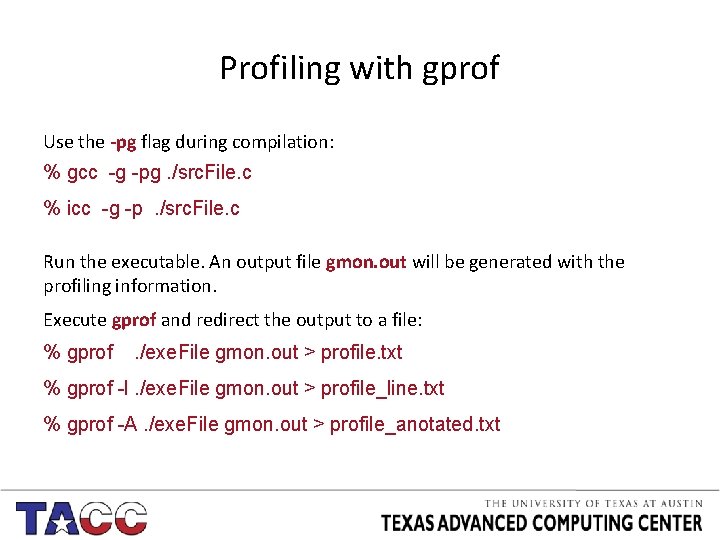
Profiling with gprof Use the -pg flag during compilation: % gcc -g -pg. /src. File. c % icc -g -p. /src. File. c Run the executable. An output file gmon. out will be generated with the profiling information. Execute gprof and redirect the output to a file: % gprof . /exe. File gmon. out > profile. txt % gprof -l. /exe. File gmon. out > profile_line. txt % gprof -A. /exe. File gmon. out > profile_anotated. txt

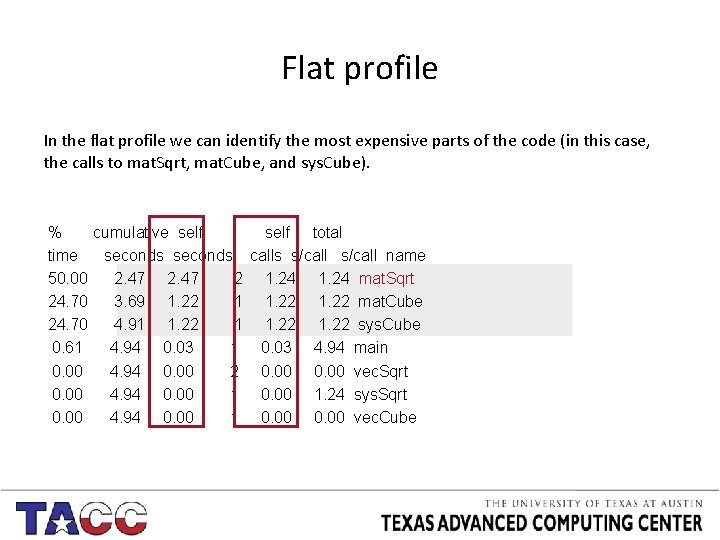
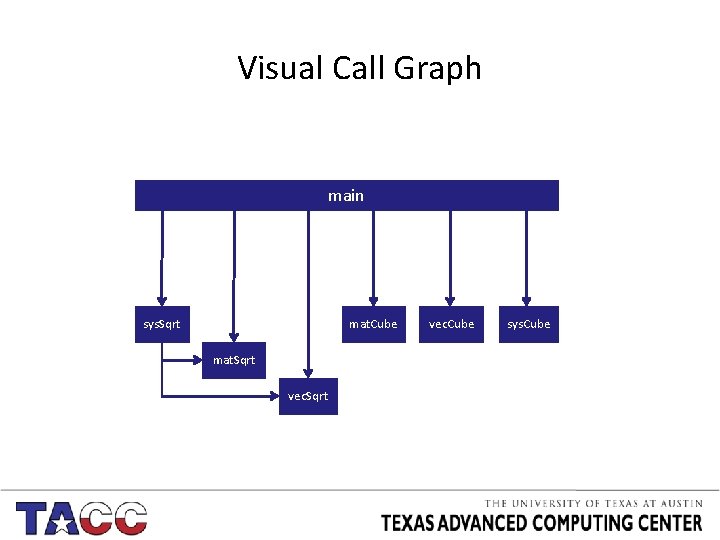
Flat profile In the flat profile we can identify the most expensive parts of the code (in this case, the calls to mat. Sqrt, mat. Cube, and sys. Cube). % cumulative self total time seconds calls s/call name 50. 00 2. 47 2 1. 24 mat. Sqrt 24. 70 3. 69 1. 22 mat. Cube 24. 70 4. 91 1. 22 sys. Cube 0. 61 4. 94 0. 03 1 0. 03 4. 94 main 0. 00 4. 94 0. 00 2 0. 00 vec. Sqrt 0. 00 4. 94 0. 00 1. 24 sys. Sqrt 0. 00 4. 94 0. 00 1 0. 00 vec. Cube

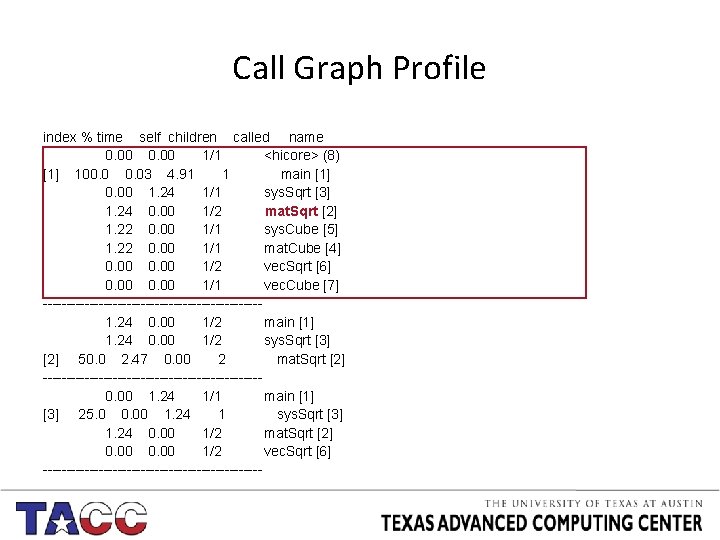
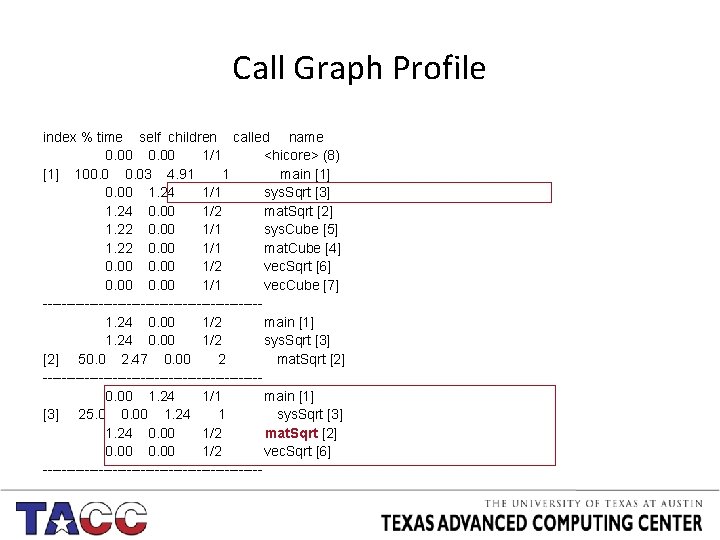
Call Graph Profile index % time self children called name 0. 00 1/1 <hicore> (8) [1] 100. 03 4. 91 1 main [1] 0. 00 1. 24 1/1 sys. Sqrt [3] 1. 24 0. 00 1/2 mat. Sqrt [2] 1. 22 0. 00 1/1 sys. Cube [5] 1. 22 0. 00 1/1 mat. Cube [4] 0. 00 1/2 vec. Sqrt [6] 0. 00 1/1 vec. Cube [7] -----------------------1. 24 0. 00 1/2 main [1] 1. 24 0. 00 1/2 sys. Sqrt [3] [2] 50. 0 2. 47 0. 00 2 mat. Sqrt [2] -----------------------0. 00 1. 24 1/1 main [1] [3] 25. 0 0. 00 1. 24 1 sys. Sqrt [3] 1. 24 0. 00 1/2 mat. Sqrt [2] 0. 00 1/2 vec. Sqrt [6] ------------------------

Visual Call Graph main sys. Sqrt mat. Sqrt vec. Sqrt mat. Cube vec. Cube sys. Cube

Call Graph Profile index % time self children called name 0. 00 1/1 <hicore> (8) [1] 100. 03 4. 91 1 main [1] 0. 00 1. 24 1/1 sys. Sqrt [3] 1. 24 0. 00 1/2 mat. Sqrt [2] 1. 22 0. 00 1/1 sys. Cube [5] 1. 22 0. 00 1/1 mat. Cube [4] 0. 00 1/2 vec. Sqrt [6] 0. 00 1/1 vec. Cube [7] -----------------------1. 24 0. 00 1/2 main [1] 1. 24 0. 00 1/2 sys. Sqrt [3] [2] 50. 0 2. 47 0. 00 2 mat. Sqrt [2] -----------------------0. 00 1. 24 1/1 main [1] [3] 25. 0 0. 00 1. 24 1 sys. Sqrt [3] 1. 24 0. 00 1/2 mat. Sqrt [2] 0. 00 1/2 vec. Sqrt [6] ------------------------

Visual Call Graph main sys. Sqrt vec. Sqrt mat. Cube vec. Cube sys. Cube

Call Graph Profile index % time self children called name 0. 00 1/1 <hicore> (8) [1] 100. 03 4. 91 1 main [1] 0. 00 1. 24 1/1 sys. Sqrt [3] 1. 24 0. 00 1/2 mat. Sqrt [2] 1. 22 0. 00 1/1 sys. Cube [5] 1. 22 0. 00 1/1 mat. Cube [4] 0. 00 1/2 vec. Sqrt [6] 0. 00 1/1 vec. Cube [7] -----------------------1. 24 0. 00 1/2 main [1] 1. 24 0. 00 1/2 sys. Sqrt [3] [2] 50. 0 2. 47 0. 00 2 mat. Sqrt [2] -----------------------0. 00 1. 24 1/1 main [1] [3] 25. 0 0. 00 1. 24 1 sys. Sqrt [3] 1. 24 0. 00 1/2 mat. Sqrt [2] 0. 00 1/2 vec. Sqrt [6] ------------------------

Visual Call Graph main sys. Sqrt mat. Cube mat. Sqrt vec. Cube sys. Cube

PERFEXPERT

Perfexpert Brand new tool, locally developed at UT Easy to use and understand Great for quick profiling and for beginners Provides recommendation on “what to fix” in a subroutine Collects information from PAPI using HPCToolkit No MPI specific profiling, no 3 D visualization, no elaborate metrics Combines ease of use with useful interpretation of gathered performance data • Optimization suggestions!!! • •

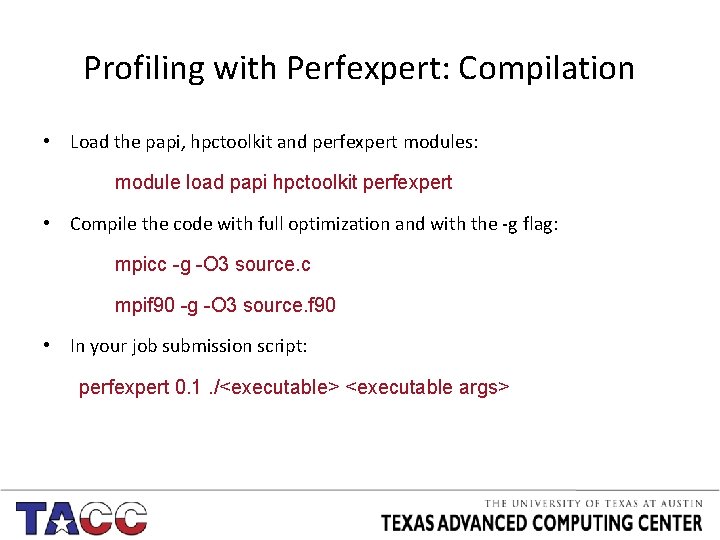
Profiling with Perfexpert: Compilation • Load the papi, hpctoolkit and perfexpert modules: module load papi hpctoolkit perfexpert • Compile the code with full optimization and with the -g flag: mpicc -g -O 3 source. c mpif 90 -g -O 3 source. f 90 • In your job submission script: perfexpert 0. 1. /<executable> <executable args>

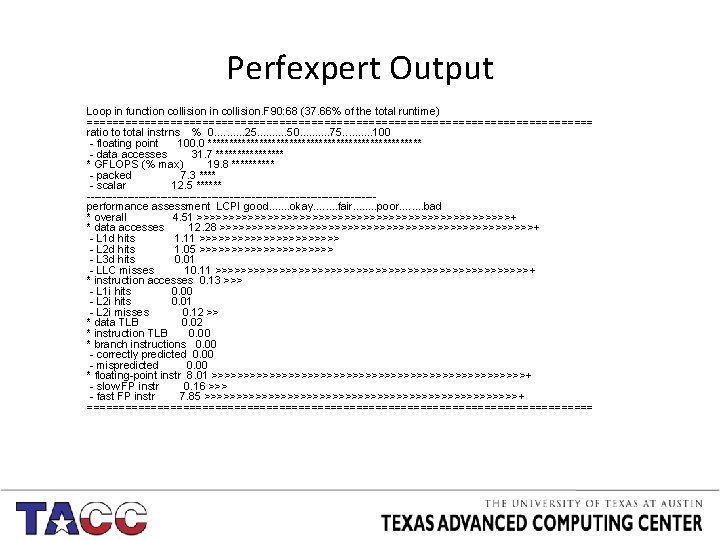
Perfexpert Output Loop in function collision in collision. F 90: 68 (37. 66% of the total runtime) ======================================== ratio to total instrns % 0. . 25. . 50. . 75. . 100 - floating point 100. 0 ************************* - data accesses 31. 7 ******** * GFLOPS (% max) 19. 8 ***** - packed 7. 3 **** - scalar 12. 5 ****** ---------------------------------------performance assessment LCPI good. . . . okay. . . . fair. . . . poor. . . . bad * overall 4. 51 >>>>>>>>>>>>>>>>>>>>>>>>>+ * data accesses 12. 28 >>>>>>>>>>>>>>>>>>>>>>>>>+ - L 1 d hits 1. 11 >>>>>>>>>>> - L 2 d hits 1. 05 >>>>>>>>>>> - L 3 d hits 0. 01 - LLC misses 10. 11 >>>>>>>>>>>>>>>>>>>>>>>>>+ * instruction accesses 0. 13 >>> - L 1 i hits 0. 00 - L 2 i hits 0. 01 - L 2 i misses 0. 12 >> * data TLB 0. 02 * instruction TLB 0. 00 * branch instructions 0. 00 - correctly predicted 0. 00 - mispredicted 0. 00 * floating-point instr 8. 01 >>>>>>>>>>>>>>>>>>>>>>>>>+ - slow FP instr 0. 16 >>> - fast FP instr 7. 85 >>>>>>>>>>>>>>>>>>>>>>>>>+ ========================================

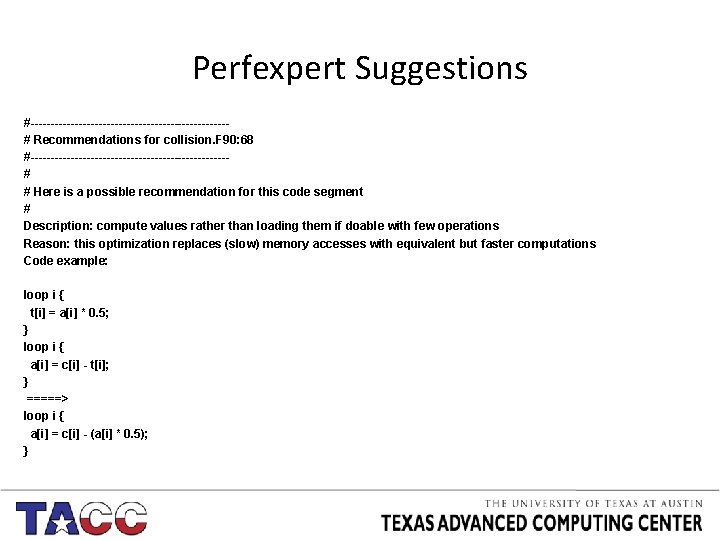
Perfexpert Suggestions #-------------------------# Recommendations for collision. F 90: 68 #-------------------------# # Here is a possible recommendation for this code segment # Description: compute values rather than loading them if doable with few operations Reason: this optimization replaces (slow) memory accesses with equivalent but faster computations Code example: loop i { t[i] = a[i] * 0. 5; } loop i { a[i] = c[i] - t[i]; } =====> loop i { a[i] = c[i] - (a[i] * 0. 5); }

Advanced Perfexpert Use • If you select the -m or -s options, Perf. Expert will try to – Automatically optimize your code – Show the performance analysis report – Show the list of suggestion for bottleneck remediation when no automatic optimization is possible. • Get the code and documentation from: www. tacc. utexas. edu/research-development/tacc-projects/perfexpert github. com/TACC/perfexpert

IPM: INTEGRATED PERFORMANCE MONITORING

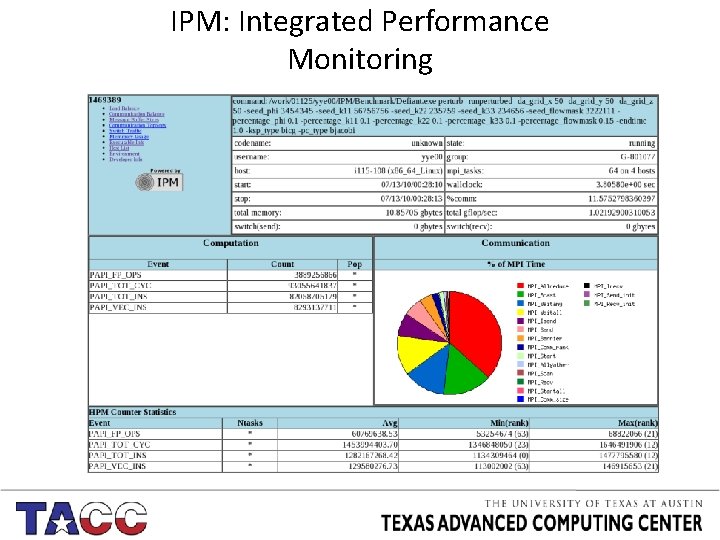
IPM: Integrated Performance Monitoring • “IPM is a portable profiling infrastructure for parallel codes. It provides a low-overhead performance summary of the computation and communication in a parallel program” • IPM is a quick, easy and concise profiling tool • The level of detail it reports is smaller than TAU, PAPI or HPCToolkit

IPM: Integrated Performance Monitoring • IPM features: – easy to use – has low overhead – is scalable • Requires no source code modification, just adding the “-g” option to the compilation • Produces XML output that is parsed by scripts to generate browser-readable html pages

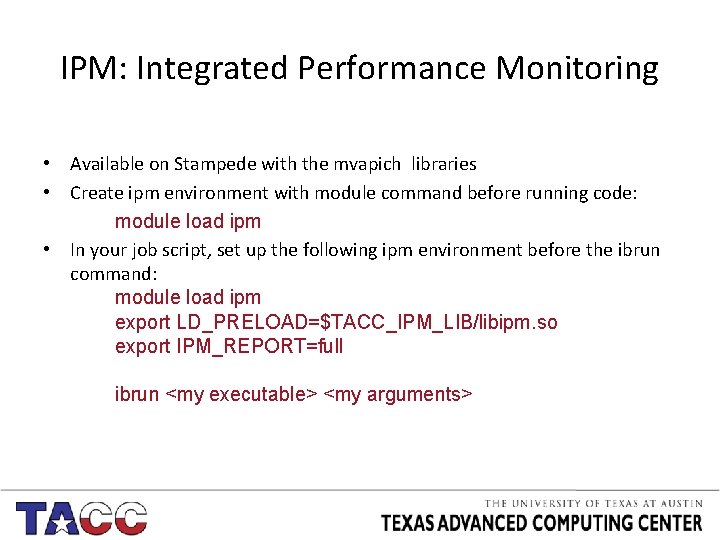
IPM: Integrated Performance Monitoring • Available on Stampede with the mvapich libraries • Create ipm environment with module command before running code: module load ipm • In your job script, set up the following ipm environment before the ibrun command: module load ipm export LD_PRELOAD=$TACC_IPM_LIB/libipm. so export IPM_REPORT=full ibrun <my executable> <my arguments>

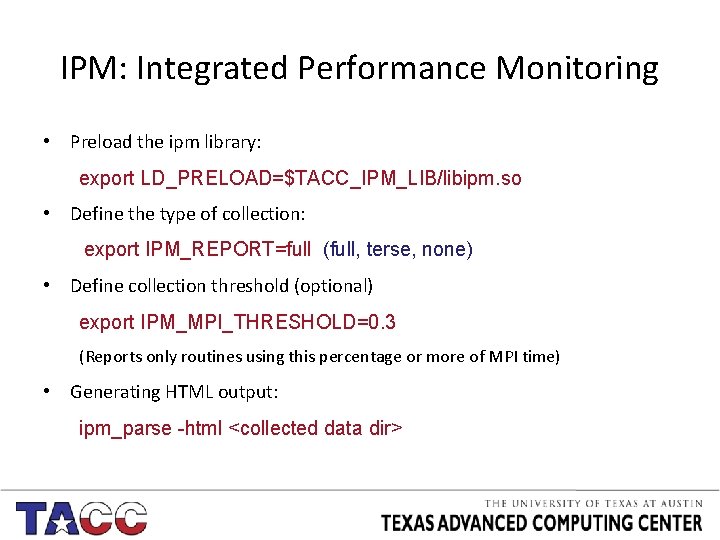
IPM: Integrated Performance Monitoring • Preload the ipm library: export LD_PRELOAD=$TACC_IPM_LIB/libipm. so • Define the type of collection: export IPM_REPORT=full (full, terse, none) • Define collection threshold (optional) export IPM_MPI_THRESHOLD=0. 3 (Reports only routines using this percentage or more of MPI time) • Generating HTML output: ipm_parse -html <collected data dir>

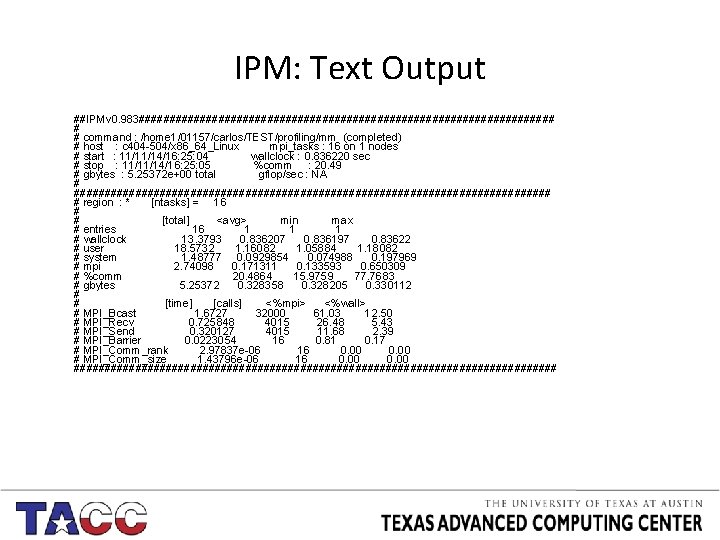
IPM: Text Output ##IPMv 0. 983################################## # # command : /home 1/01157/carlos/TEST/profiling/mm (completed) # host : c 404 -504/x 86_64_Linux mpi_tasks : 16 on 1 nodes # start : 11/11/14/16: 25: 04 wallclock : 0. 836220 sec # stop : 11/11/14/16: 25: 05 %comm : 20. 49 # gbytes : 5. 25372 e+00 total gflop/sec : NA # ####################################### # region : * [ntasks] = 16 # # [total] <avg> min max # entries 16 1 1 1 # wallclock 13. 3793 0. 836207 0. 836197 0. 83622 # user 18. 5732 1. 16082 1. 05884 1. 18082 # system 1. 48777 0. 0929854 0. 074988 0. 197969 # mpi 2. 74098 0. 171311 0. 133593 0. 650309 # %comm 20. 4864 15. 9759 77. 7683 # gbytes 5. 25372 0. 328358 0. 328205 0. 330112 # # [time] [calls] <%mpi> <%wall> # MPI_Bcast 1. 6727 32000 61. 03 12. 50 # MPI_Recv 0. 725848 4015 26. 48 5. 43 # MPI_Send 0. 320127 4015 11. 68 2. 39 # MPI_Barrier 0. 0223054 16 0. 81 0. 17 # MPI_Comm_rank 2. 97837 e-06 16 0. 00 # MPI_Comm_size 1. 43796 e-06 16 0. 00 ########################################

IPM: Integrated Performance Monitoring

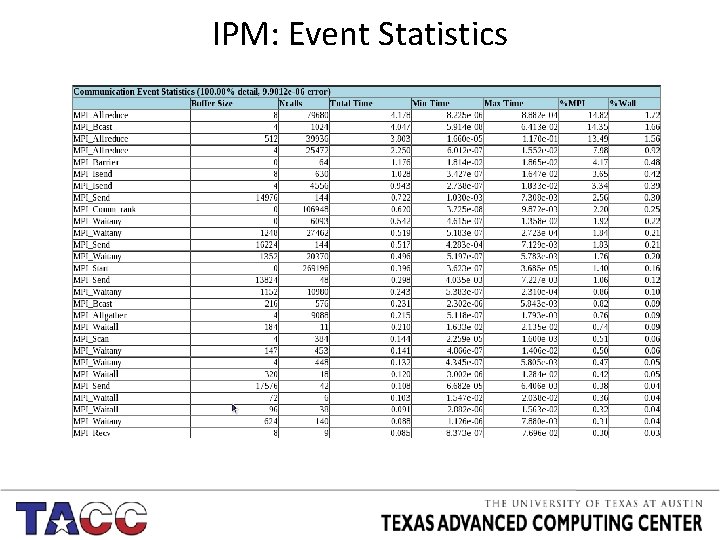
IPM: Event Statistics

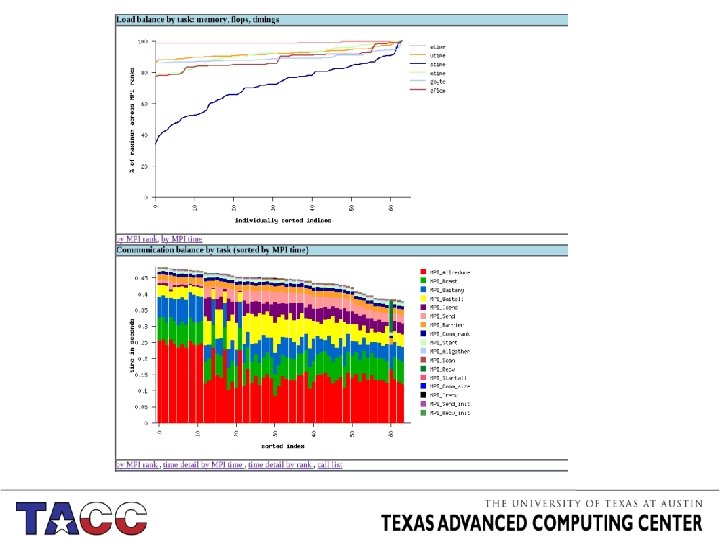
IPM: Load Balance

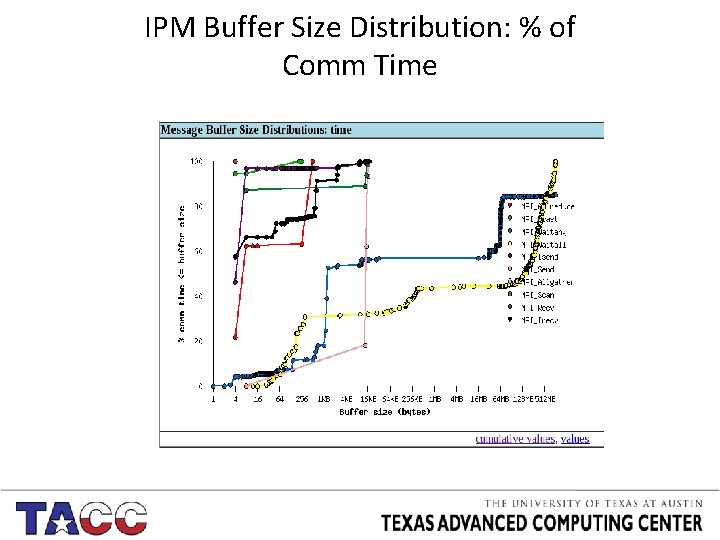
IPM Buffer Size Distribution: % of Comm Time

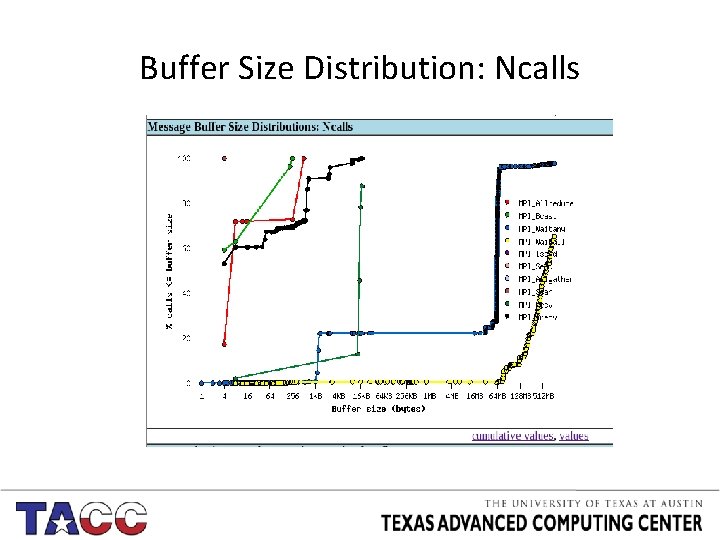
Buffer Size Distribution: Ncalls

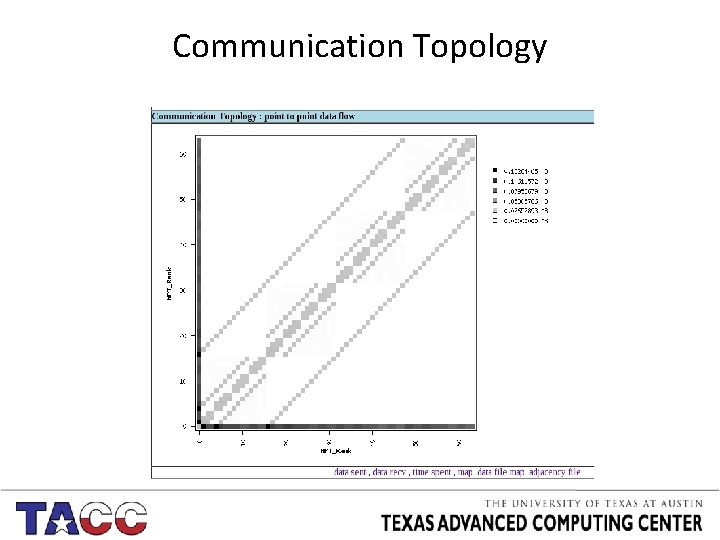
Communication Topology

IPM: Integrated Performance Monitoring • When to use IPM? – To quickly find out where your code is spending most of its time (in both computation and communication) – For performing scaling studies (both strong and weak) – When you suspect you have load imbalance and want to verify it quickly – For a quick look at the communication pattern – To find out how much memory you are using per task – To find the relative communication & compute time

IPM: Integrated Performance Monitoring • When IPM is NOT the answer – When you already know where the performance issues are – When you need detailed performance information on exact lines of code – When want to find specific information such as cache misses

MPI STATS USING INTEL MPI

MPI Profiling with IMPI • Use the following: export I_MPI_STATS=ipm export I_MPI_STATS_FILE=mystats. dat • This generates an IPM style report • More advanced configurations are possible, check the Intel MPI Reference Manual

Advanced Profiling Tools : the next level

Advanced Profiling Tools • Can be intimidating: – Difficult to install – Many dependences – Require kernel patches Not your problem • Useful for serial and parallel programs • Extensive profiling and scalability information • Analyze code using: – Timers – Hardware registers (PAPI) – Function wrappers

PAPI is a Performance Application Programming Interface icl. cs. utk. edu/papi • API to use hardware counters • Behind Tau, HPCToolkit • Multiplatform: – Most Intel & AMD chips – IBM POWER 4/5/6 – Cray X/XD/XT – Sun Ultra. Sparc I/II/III – MIPS – Si. Cortex – Cell • Available as a module on Lonestar and Stampede (mind the hardware counters issue with sandybridge xeons).

HPCTOOLKIT

HPCToolkit hpctoolkit. org • Binary-level measurement and analysis – no recompilation! • Uses sample-based measurements – Controlled overhead – Good scalability for large scale parallelism analysis • Good analysis tools – Ability to compare multiple runs at different scales – Scalable interface for trace viewer – Good derived metrics support

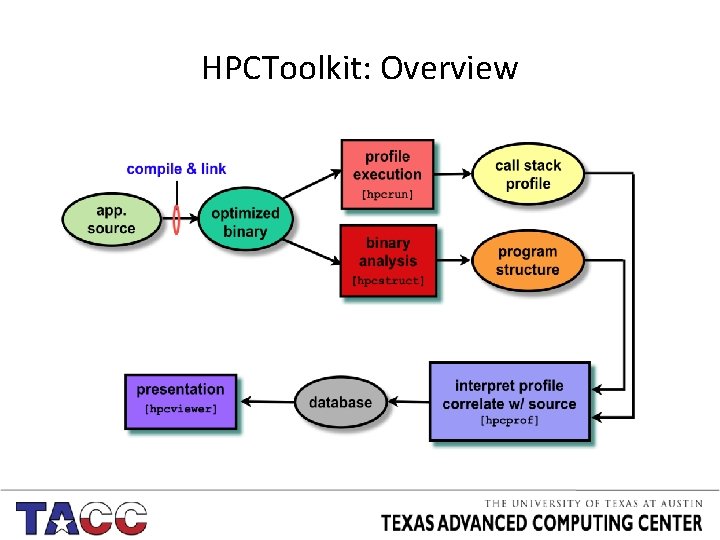
HPCToolkit: Overview

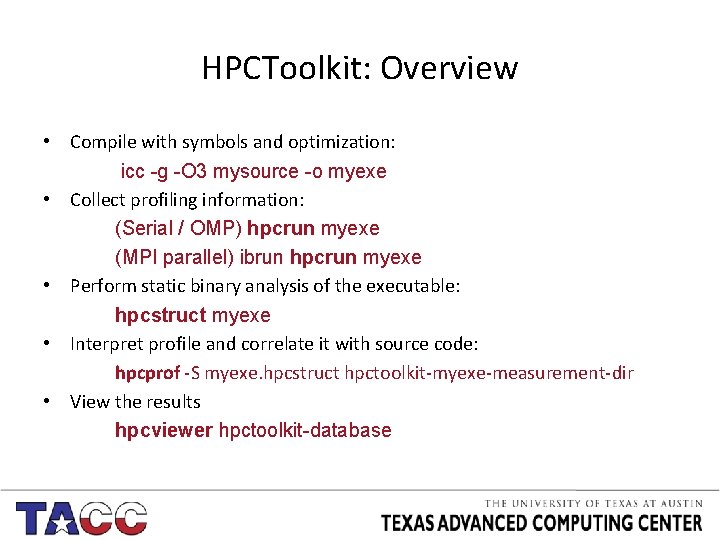
HPCToolkit: Overview • Compile with symbols and optimization: icc -g -O 3 mysource -o myexe • Collect profiling information: (Serial / OMP) hpcrun myexe (MPI parallel) ibrun hpcrun myexe • Perform static binary analysis of the executable: hpcstruct myexe • Interpret profile and correlate it with source code: hpcprof -S myexe. hpcstruct hpctoolkit-myexe-measurement-dir • View the results hpcviewer hpctoolkit-database

HPCToolkit: HW Counters • Specify what events must be measured during the collection: hpcrun –e event[@period] myexe • Multiple events can be specified (no multiplexing) hpcrun -e PAPI_L 2_TCM -e PAPI_L 2_DCA -e PAPI_TOT_CYC myexe • WALLCLOCK event cannot be used with other events hpcrun –e WALLCLOCK myexe • Find all available events and a brief description using: hpcrun --list-events

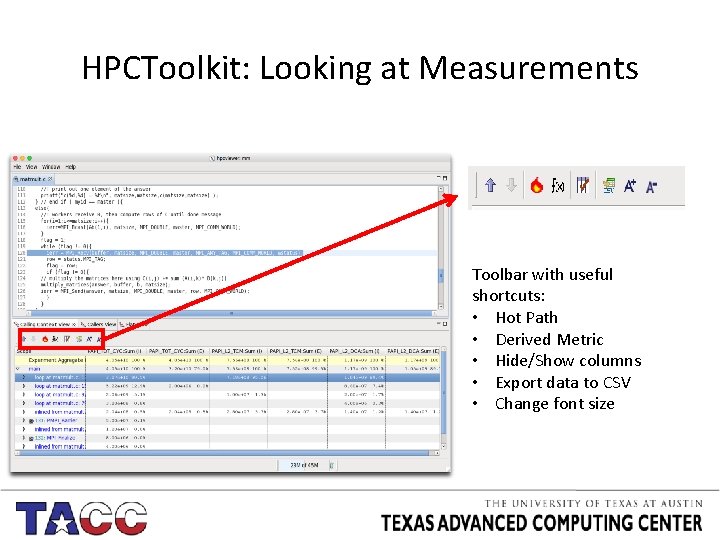
HPCToolkit: Looking at Measurements Toolbar with useful shortcuts: • Hot Path • Derived Metric • Hide/Show columns • Export data to CSV • Change font size

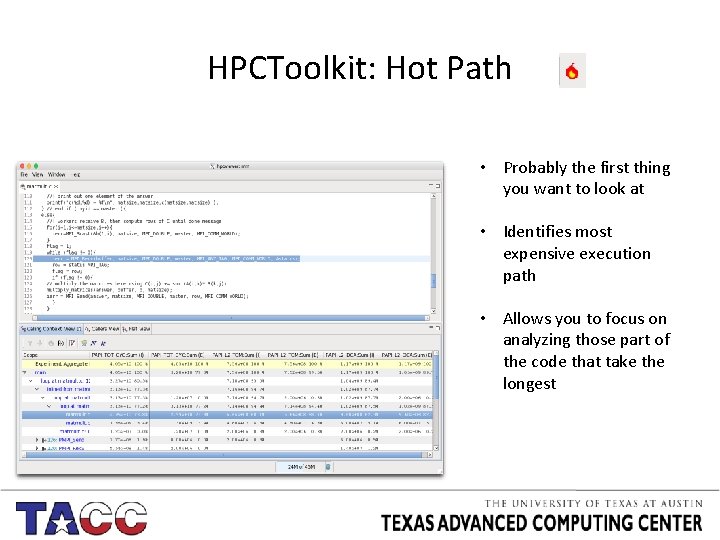
HPCToolkit: Hot Path • Probably the first thing you want to look at • Identifies most expensive execution path • Allows you to focus on analyzing those part of the code that take the longest

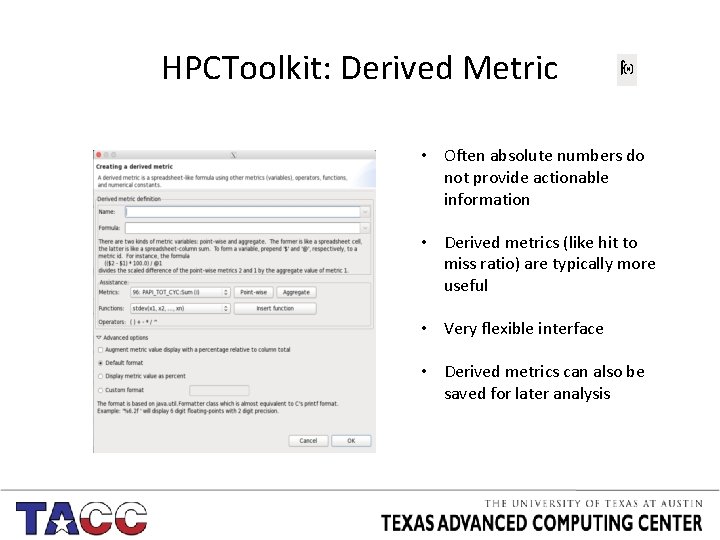
HPCToolkit: Derived Metric • Often absolute numbers do not provide actionable information • Derived metrics (like hit to miss ratio) are typically more useful • Very flexible interface • Derived metrics can also be saved for later analysis

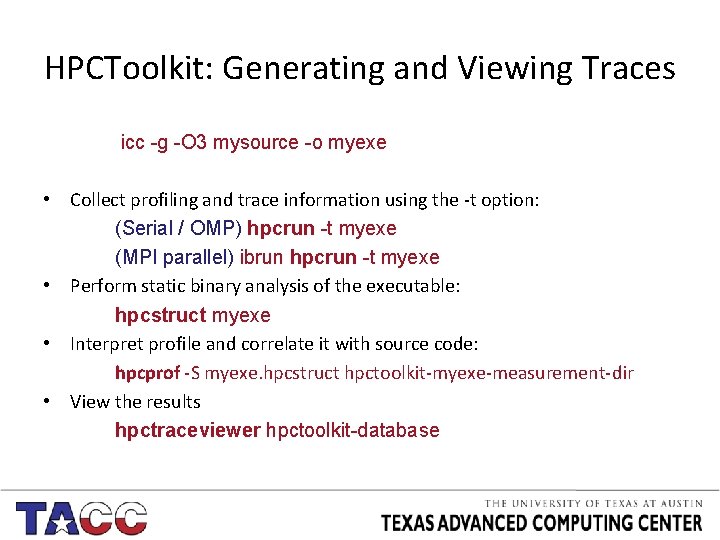
HPCToolkit: Generating and Viewing Traces icc -g -O 3 mysource -o myexe • Collect profiling and trace information using the -t option: (Serial / OMP) hpcrun -t myexe (MPI parallel) ibrun hpcrun -t myexe • Perform static binary analysis of the executable: hpcstruct myexe • Interpret profile and correlate it with source code: hpcprof -S myexe. hpcstruct hpctoolkit-myexe-measurement-dir • View the results hpctraceviewer hpctoolkit-database

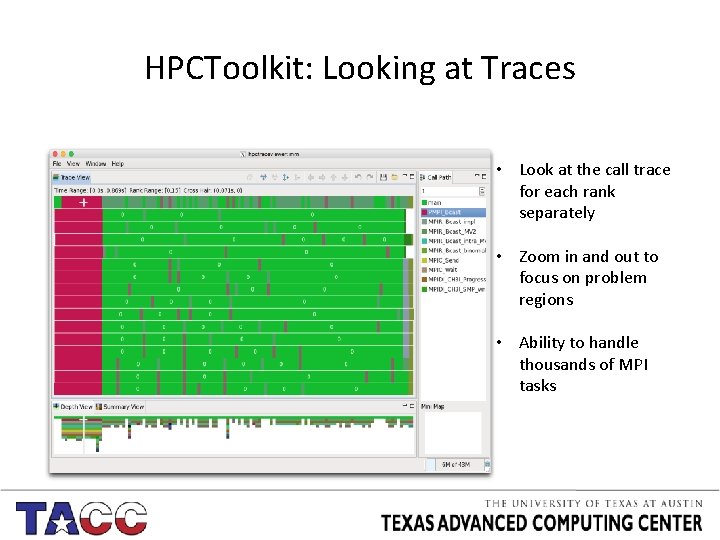
HPCToolkit: Looking at Traces • Look at the call trace for each rank separately • Zoom in and out to focus on problem regions • Ability to handle thousands of MPI tasks

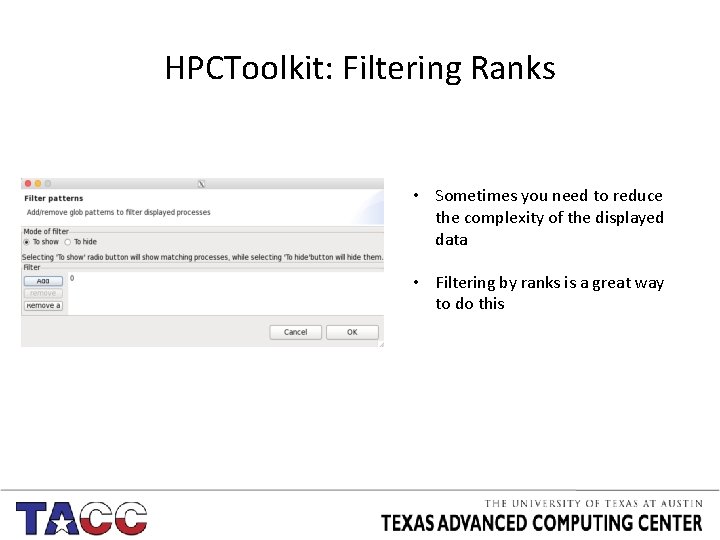
HPCToolkit: Filtering Ranks • Sometimes you need to reduce the complexity of the displayed data • Filtering by ranks is a great way to do this

VTUNE AMPLIFIER

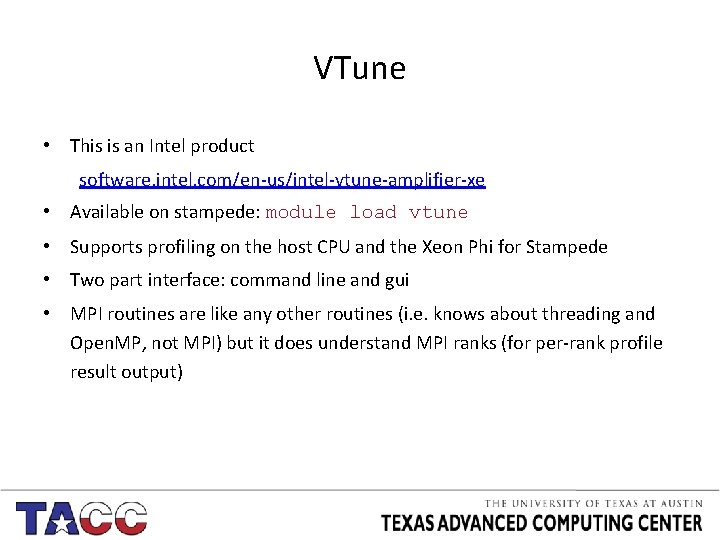
VTune • This is an Intel product software. intel. com/en-us/intel-vtune-amplifier-xe • Available on stampede: module load vtune • Supports profiling on the host CPU and the Xeon Phi for Stampede • Two part interface: command line and gui • MPI routines are like any other routines (i. e. knows about threading and Open. MP, not MPI) but it does understand MPI ranks (for per-rank profile result output)

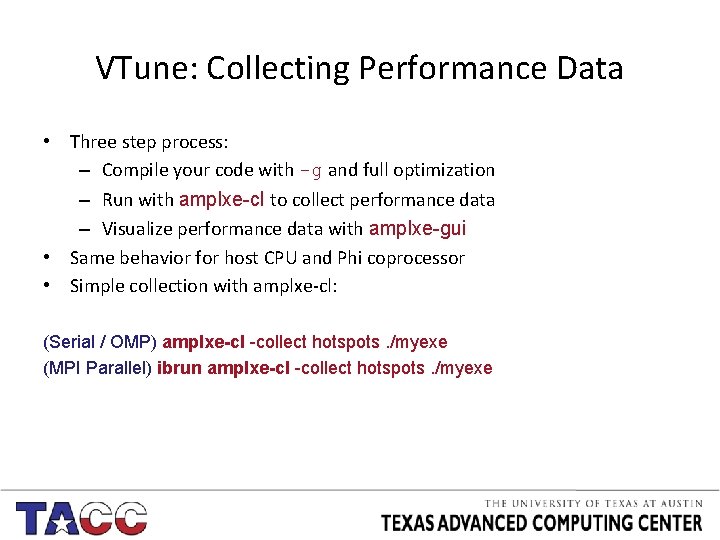
VTune: Collecting Performance Data • Three step process: – Compile your code with -g and full optimization – Run with amplxe-cl to collect performance data – Visualize performance data with amplxe-gui • Same behavior for host CPU and Phi coprocessor • Simple collection with amplxe-cl: (Serial / OMP) amplxe-cl -collect hotspots. /myexe (MPI Parallel) ibrun amplxe-cl -collect hotspots. /myexe

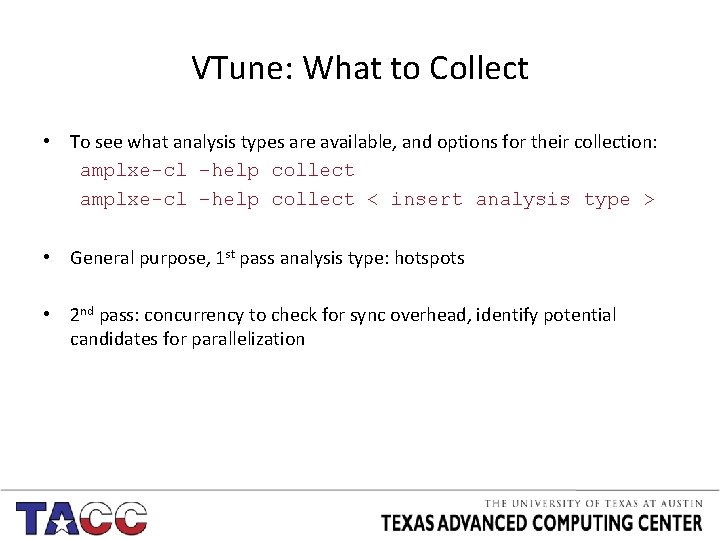
VTune: What to Collect • To see what analysis types are available, and options for their collection: amplxe-cl –help collect < insert analysis type > • General purpose, 1 st pass analysis type: hotspots • 2 nd pass: concurrency to check for sync overhead, identify potential candidates for parallelization

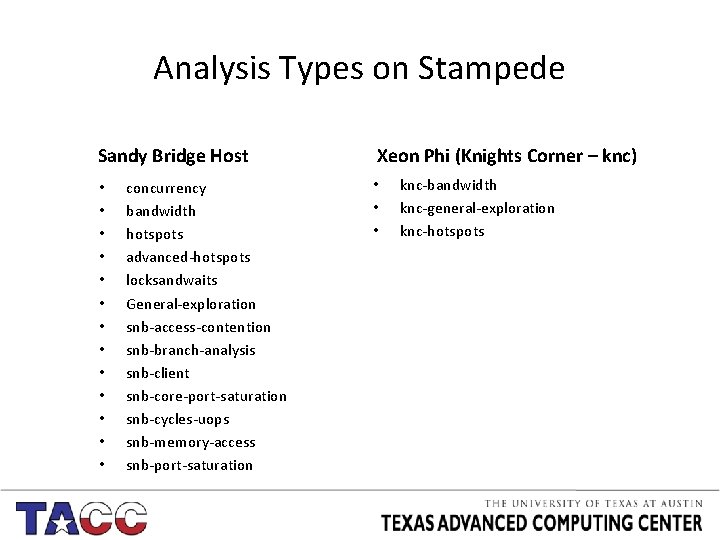
Analysis Types on Stampede Sandy Bridge Host • • • • concurrency bandwidth hotspots advanced-hotspots locksandwaits General-exploration snb-access-contention snb-branch-analysis snb-client snb-core-port-saturation snb-cycles-uops snb-memory-access snb-port-saturation Xeon Phi (Knights Corner – knc) • • • knc-bandwidth knc-general-exploration knc-hotspots

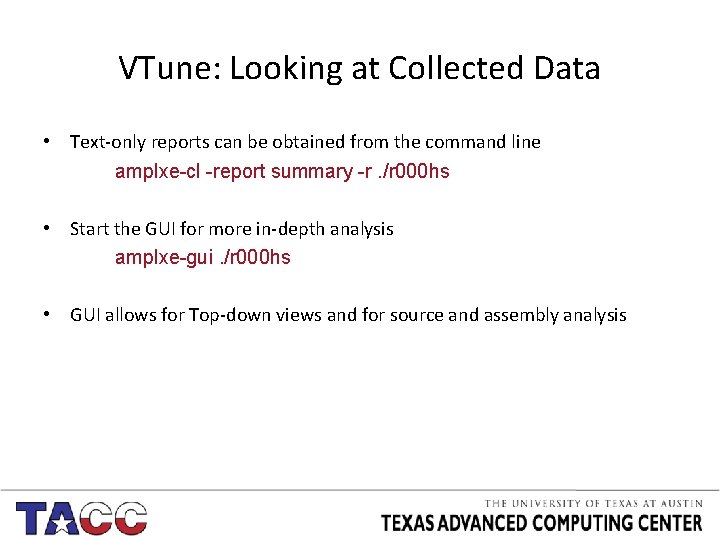
VTune: Looking at Collected Data • Text-only reports can be obtained from the command line amplxe-cl -report summary -r. /r 000 hs • Start the GUI for more in-depth analysis amplxe-gui. /r 000 hs • GUI allows for Top-down views and for source and assembly analysis

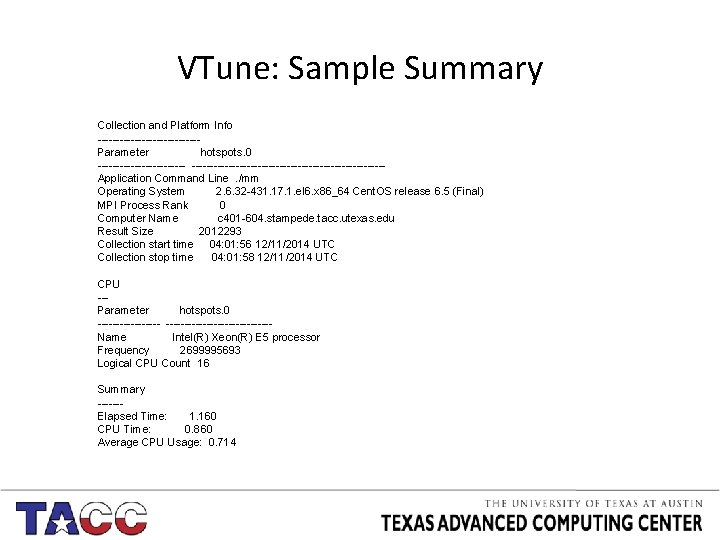
VTune: Sample Summary Collection and Platform Info --------------Parameter hotspots. 0 --------------------------------------Application Command Line. /mm Operating System 2. 6. 32 -431. 17. 1. el 6. x 86_64 Cent. OS release 6. 5 (Final) MPI Process Rank 0 Computer Name c 401 -604. stampede. tacc. utexas. edu Result Size 2012293 Collection start time 04: 01: 56 12/11/2014 UTC Collection stop time 04: 01: 58 12/11/2014 UTC CPU --Parameter hotspots. 0 -----------------------Name Intel(R) Xeon(R) E 5 processor Frequency 2699995693 Logical CPU Count 16 Summary ------Elapsed Time: 1. 160 CPU Time: 0. 860 Average CPU Usage: 0. 714

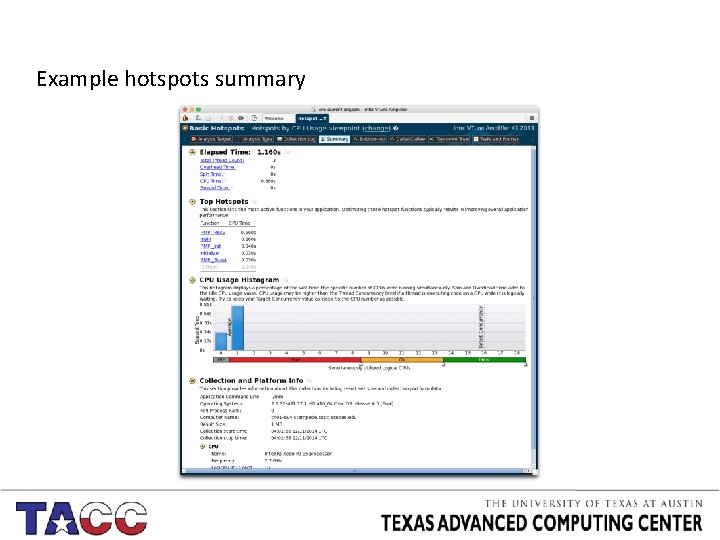
Example hotspots summary

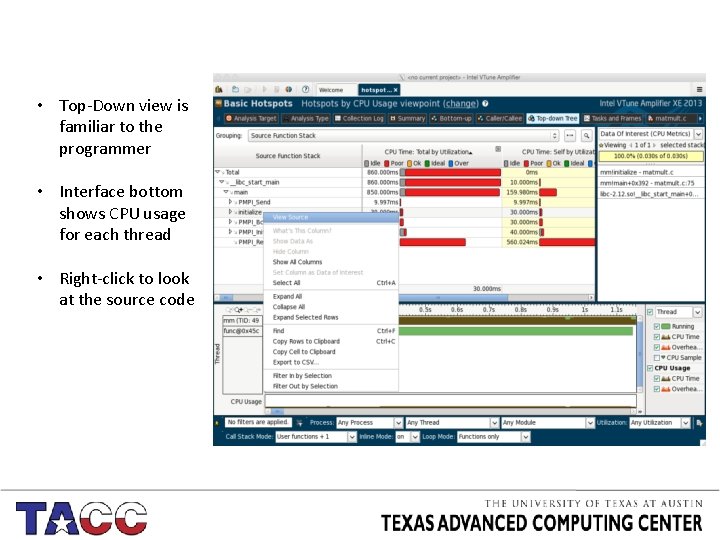
• Top-Down view is familiar to the programmer • Interface bottom shows CPU usage for each thread • Right-click to look at the source code

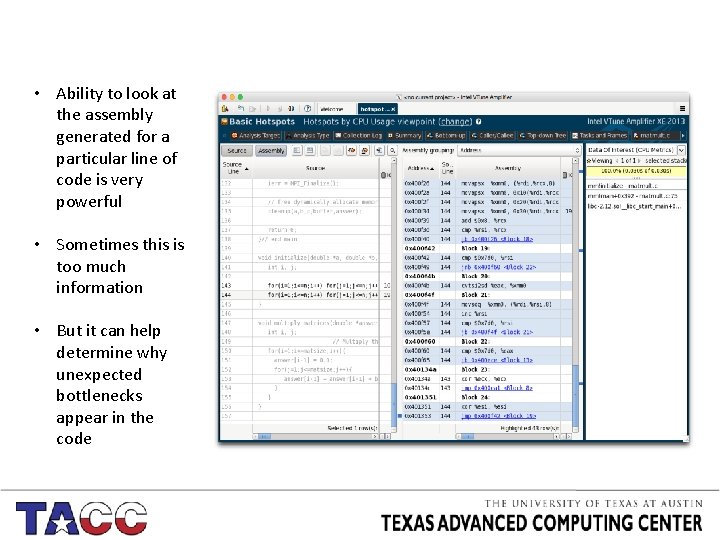
• Ability to look at the assembly generated for a particular line of code is very powerful • Sometimes this is too much information • But it can help determine why unexpected bottlenecks appear in the code

TAU

Tau TAU is a suite of Tuning and Analysis Utilities www. cs. uoregon. edu/research/tau • 12+ year project involving – University of Oregon Performance Research Lab – LANL Advanced Computing Laboratory – Research Centre Julich at ZAM, Germany • Integrated toolkit – – Performance instrumentation Measurement Analysis Visualization

Tau: Measurements • Parallel profiling – Function-level, block (loop)-level, statement-level – Supports user-defined events – TAU parallel profile data stored during execution – Hardware counter values (multiple counters) – Support for callgraph and callpath profiling • Tracing – All profile-level events – Inter-process communication events – Trace merging and format conversion

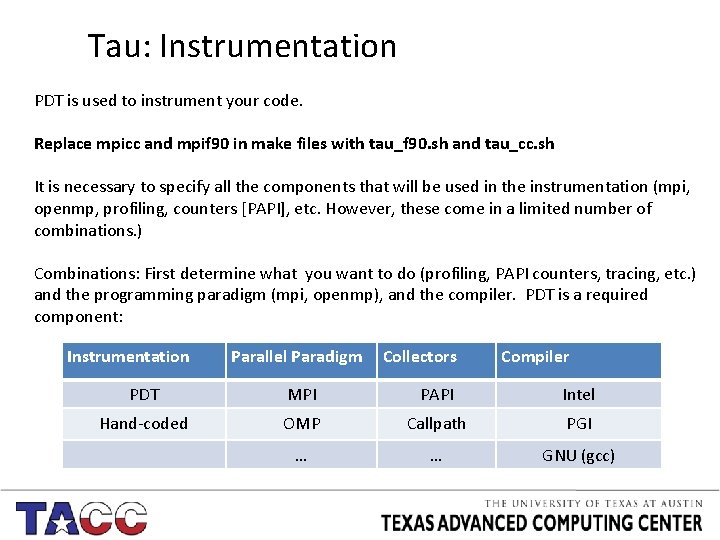
Tau: Instrumentation PDT is used to instrument your code. Replace mpicc and mpif 90 in make files with tau_f 90. sh and tau_cc. sh It is necessary to specify all the components that will be used in the instrumentation (mpi, openmp, profiling, counters [PAPI], etc. However, these come in a limited number of combinations. ) Combinations: First determine what you want to do (profiling, PAPI counters, tracing, etc. ) and the programming paradigm (mpi, openmp), and the compiler. PDT is a required component: Instrumentation Parallel Paradigm Collectors Compiler PDT MPI PAPI Intel Hand-coded OMP Callpath PGI … … GNU (gcc)

Tau: Instrumentation You can view the available combinations: ls -C 1 $TAU | grep Makefile Your selected combination is made known to the compiler wrapper through the TAU_MAKEFILE environment variable. For example, the PDT instrumention (pdt) for the Intel compiler (icpc) with MPI (mpi) is set with this command: export TAU_MAKEFILE=$TAU/Makefile. tau-icpc-papi-mpi-pdt Hardware counter options are setup using TAU_METRICS: export TAU_METRICS=LINUXTIMERS: PAPI_L 2_TCM: PAPI_L 2_DCA Other run-time and instrumentation options are set through TAU_OPTIONS. For verbose: export TAU_OPTIONS=‘-opt. Verbose’

Tau: Results • You can also enable tracing by using: export TAU_TRACE=1 • Run code normally: ibrun myexe • Then look at the results using paraprof: paraprof /path/to/results

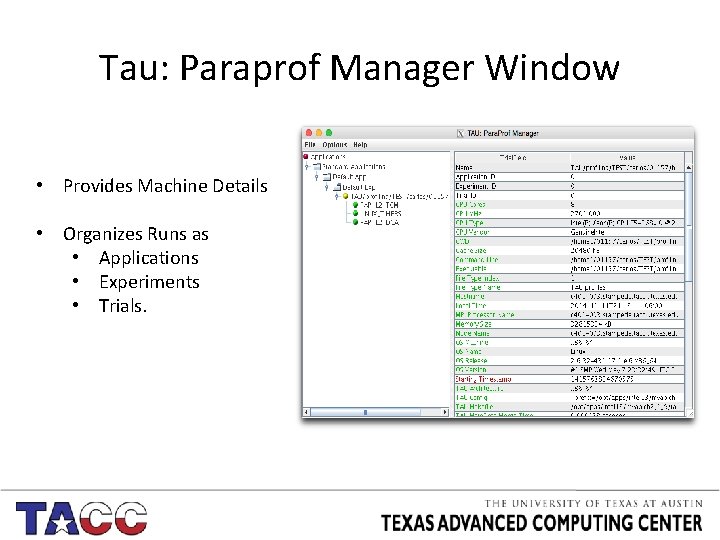
Tau: Paraprof Manager Window • Provides Machine Details • Organizes Runs as • Applications • Experiments • Trials.

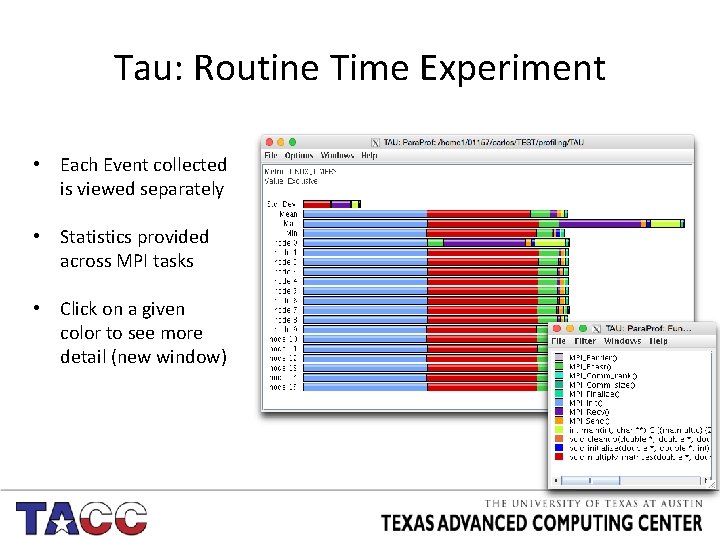
Tau: Routine Time Experiment • Each Event collected is viewed separately • Statistics provided across MPI tasks • Click on a given color to see more detail (new window)

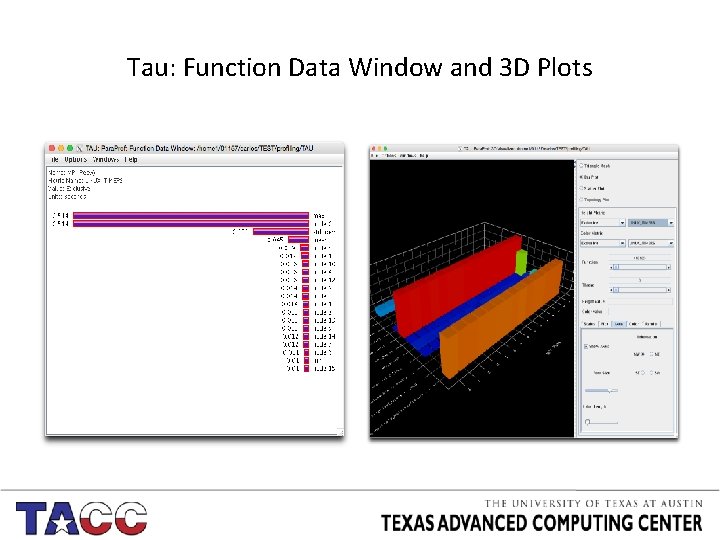
Tau: Function Data Window and 3 D Plots

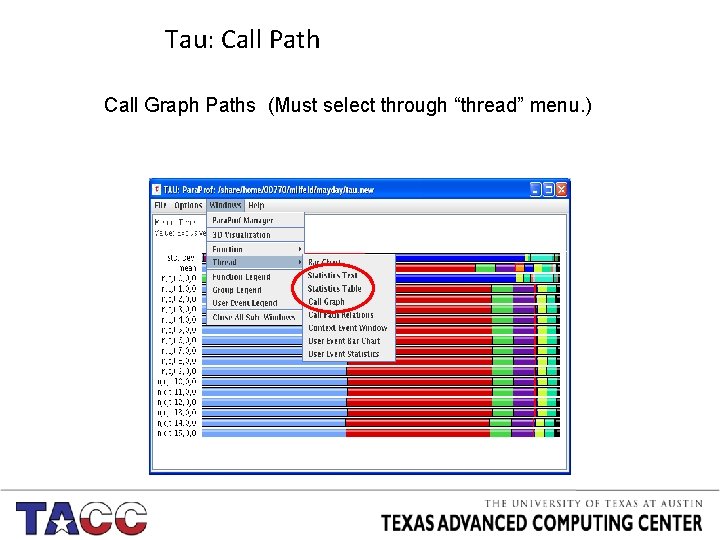
Tau: Call Path Call Graph Paths (Must select through “thread” menu. )

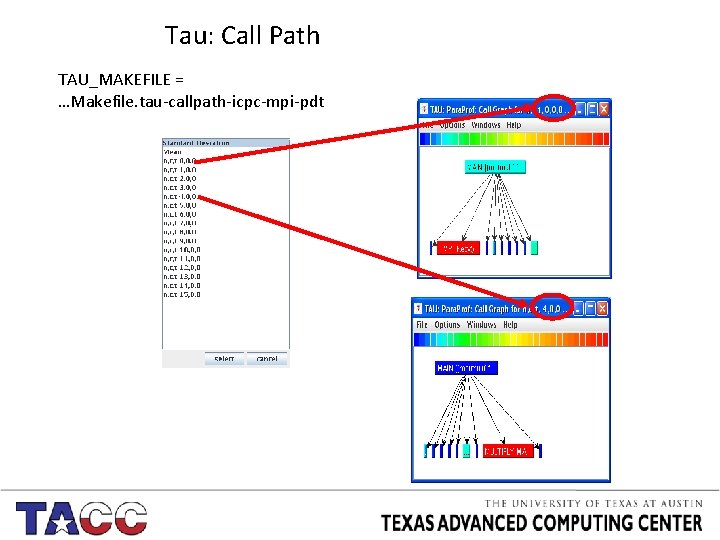
Tau: Call Path TAU_MAKEFILE = …Makefile. tau-callpath-icpc-mpi-pdt

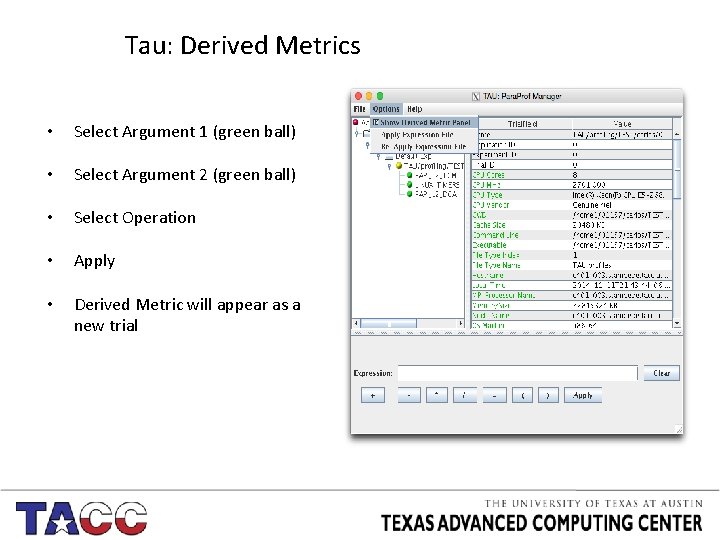
Tau: Derived Metrics • Select Argument 1 (green ball) • Select Argument 2 (green ball) • Select Operation • Apply • Derived Metric will appear as a new trial

Profiling dos and don’ts DO • • Test every change you make Profile typical cases Compile with optimization flags Test for scalability DO NOT • Assume a change will be an improvement • Profile atypical cases • Profile ad infinitum – Set yourself a goal or – Set yourself a time limit

Other tools • Valgrind* valgrind. org – Powerful instrumentation framework, often used for debugging memory problems • MPIP mpip. sourceforge. net – Lightweight, scalable MPI profiling tool • Scalasca www. fz-juelich. de/jsc/scalasca – Similar to Tau, complete suit of tuning and analysis tools.