Profiling and Detecting Bottlenecks in Software Bryan Call
Profiling and Detecting Bottlenecks in Software Bryan Call OSCON 2011 Yahoo! Engineer and Apache Commiter
Overview • • • Why profile your code? Rules of thumb Profiling pitfalls Types of bottlenecks Basic command line tools What is a profiler? Types of profilers Profiling Examples Ways to improve performance
Why profile your code? • Better understanding of your application and architecture • Reduced hardware and maintenance costs – Less hardware to setup and maintain • Learn how to be a better coder • Look smart
Rule of thumb • 80/20 rule – 80% of the runtime using only 20% of the code – Some people say 90/10
Profiling pitfalls • Pre-optimization, waist of time – Optimizing the 80% of the code that only runs 20% of the time – Don’t fully understand the architecture or workload • Over optimize code – Can overcomplicate code
Types of Bottlenecks • • • CPU Disk Network Memory Lock contention External resources – Databases, web service, etc. .
Basic Command-line Tools • • top, htop (great for threaded apps) vmstat, dstat strace time
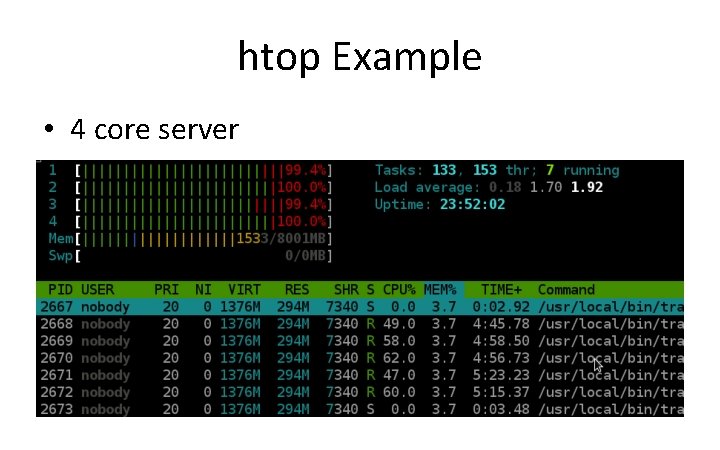
htop Example • 4 core server
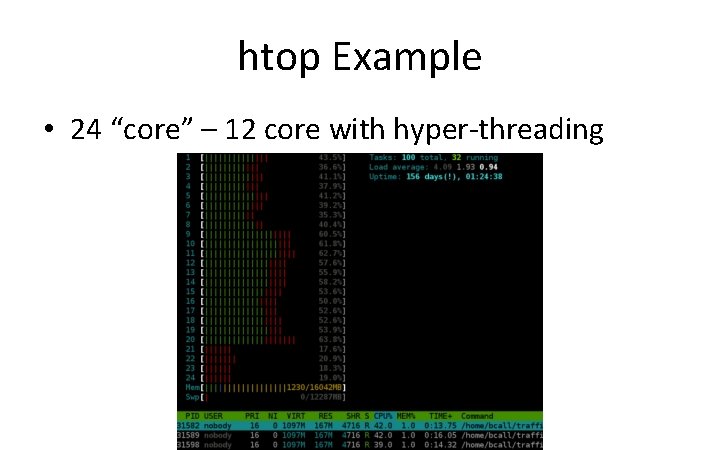
htop Example • 24 “core” – 12 core with hyper-threading
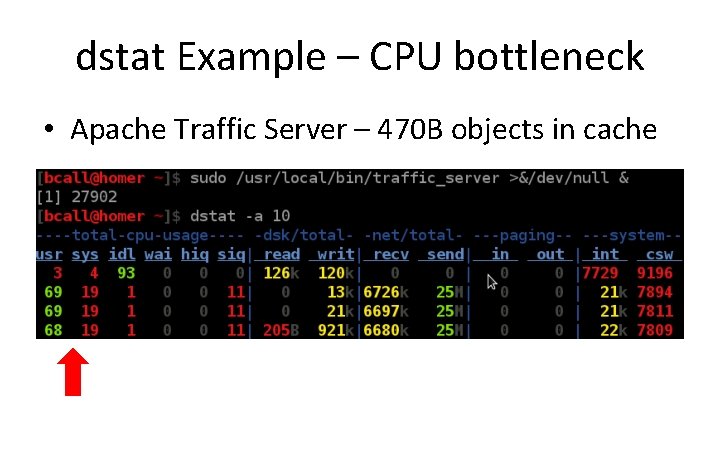
dstat Example – CPU bottleneck • Apache Traffic Server – 470 B objects in cache
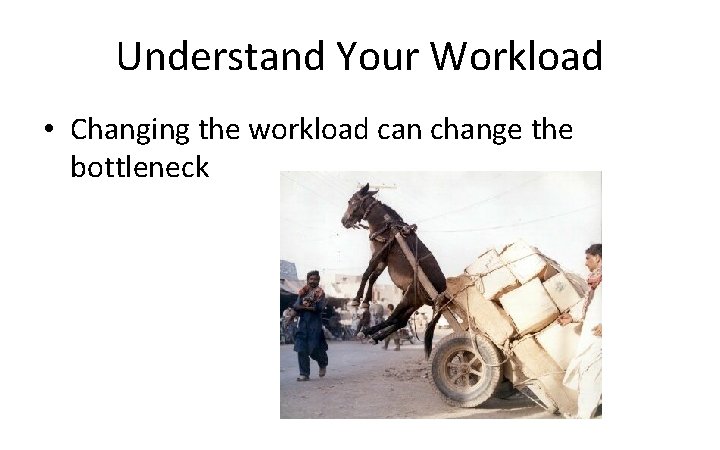
Understand Your Workload • Changing the workload can change the bottleneck
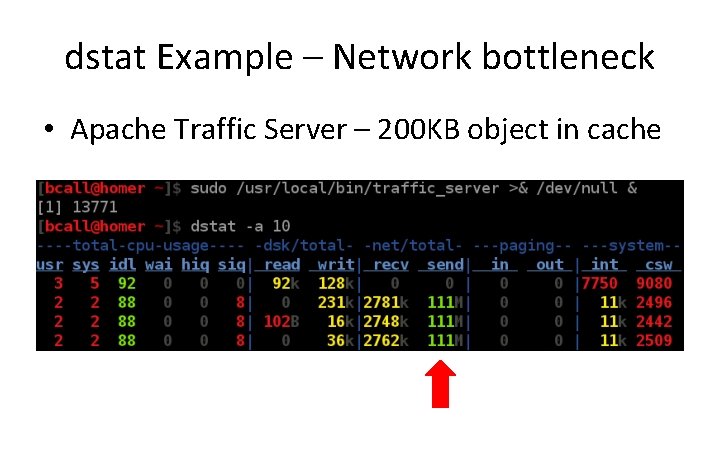
dstat Example – Network bottleneck • Apache Traffic Server – 200 KB object in cache
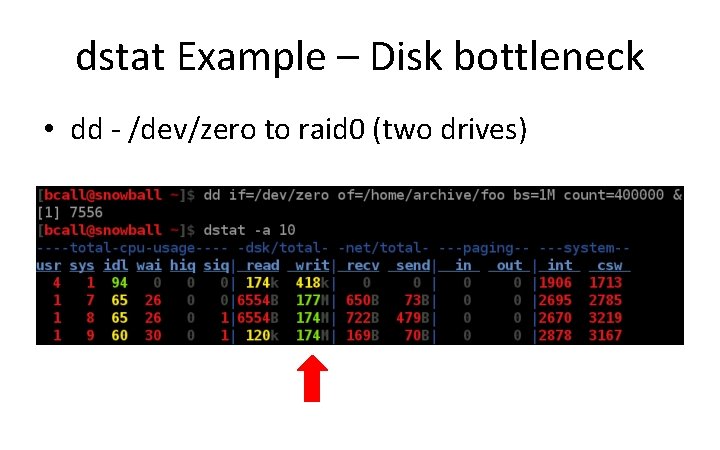
dstat Example – Disk bottleneck • dd - /dev/zero to raid 0 (two drives)
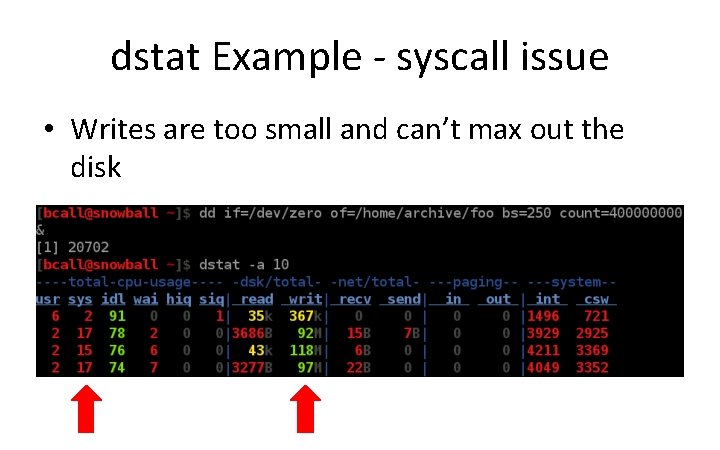
dstat Example - syscall issue • Writes are too small and can’t max out the disk
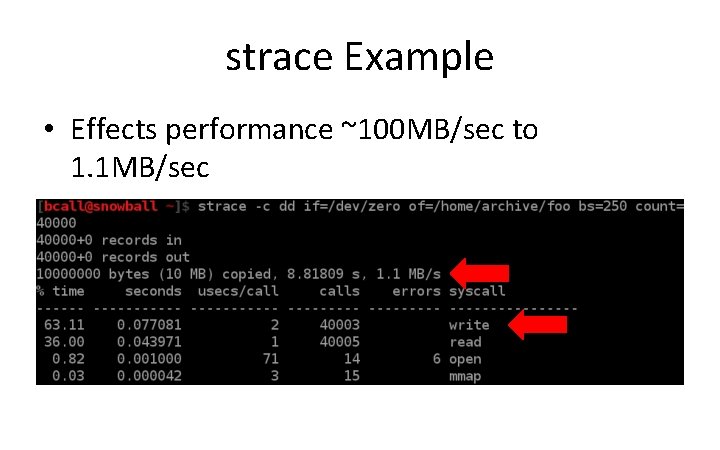
strace Example • Effects performance ~100 MB/sec to 1. 1 MB/sec
What is a Profiler? • Dynamic program analysis • Shows – Frequency of functions called – Usage of lines in code – Duration of function calls
Types of Profilers • Statistical – Examples: oprofile, google profiler – Good for interactive systems with lots of code – Doesn't slow down the application much (1% to 8%) – Fixed cost • Doesn't take up more CPU as the number of function calls per second increases
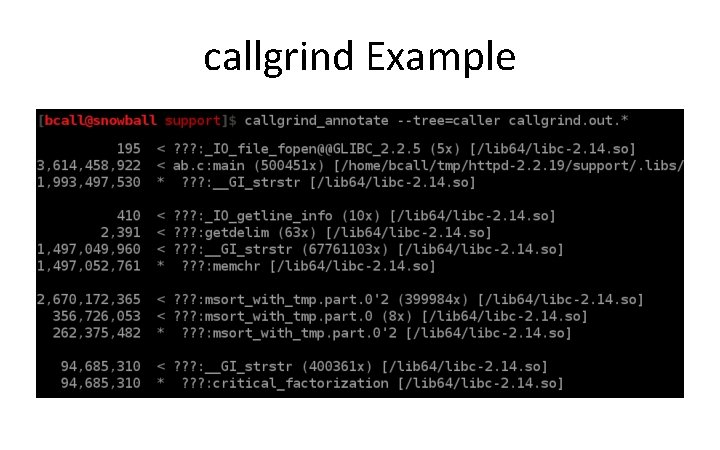
Types of Profilers • Instrumenting – Examples: valgrind's callgrind, gprof – More detail (time for each function call) – Can make programs much slower – Good for non-interactive systems
Oprofile • Requires kernel driver, need root access • System wide profiling, profiles everything running • Application doesn’t know about the profiler • Scripts to convert output for kcachegrind
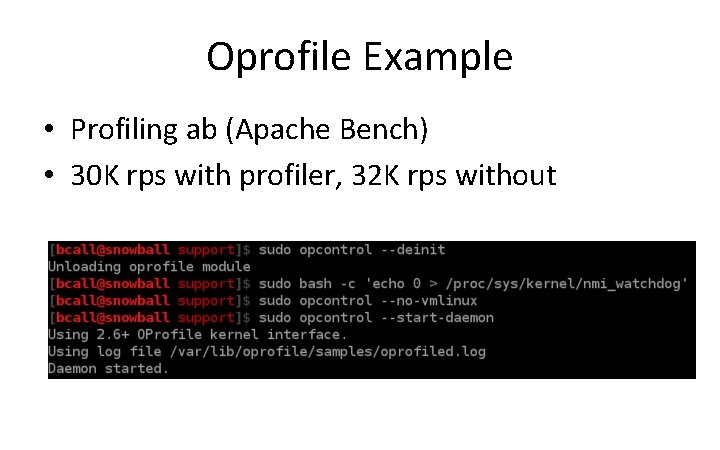
Oprofile Example • Profiling ab (Apache Bench) • 30 K rps with profiler, 32 K rps without
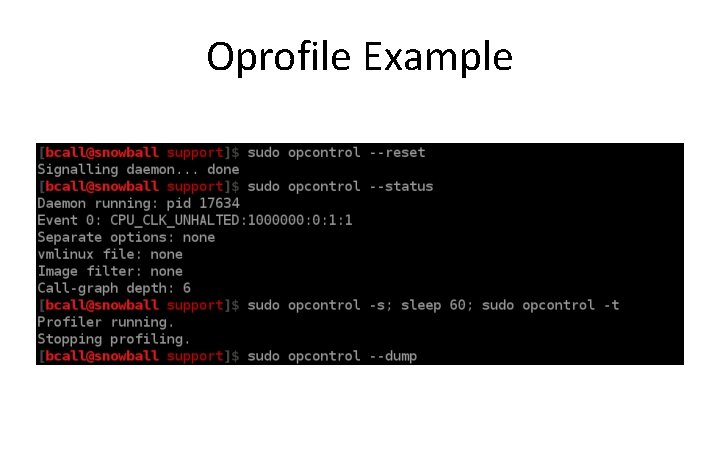
Oprofile Example
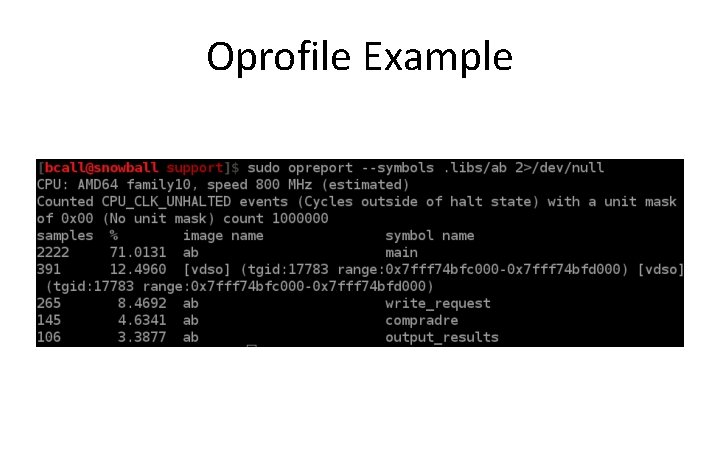
Oprofile Example
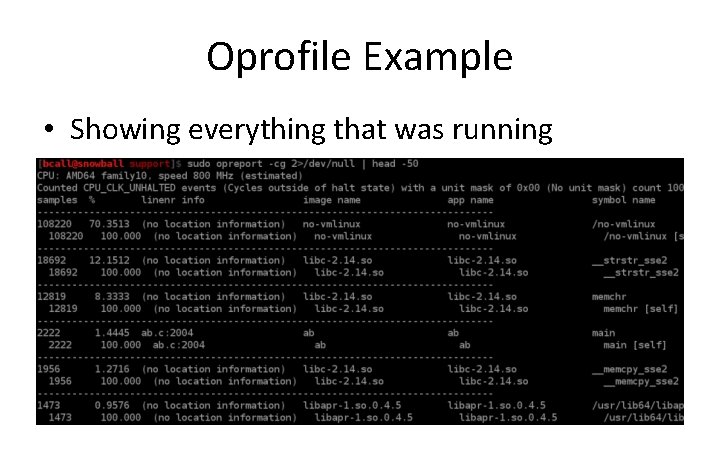
Oprofile Example • Showing everything that was running
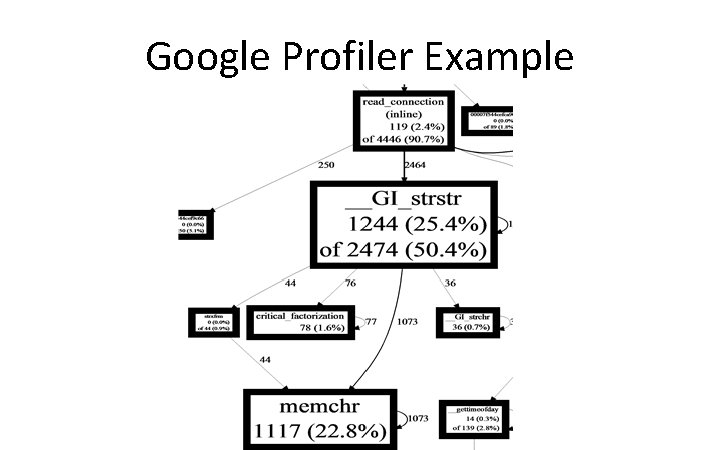
Google profiler • • • All in userland Profiles specific applications, not system wide Command-line LD_PRELOAD support Support to build it into your application Has graphing built in
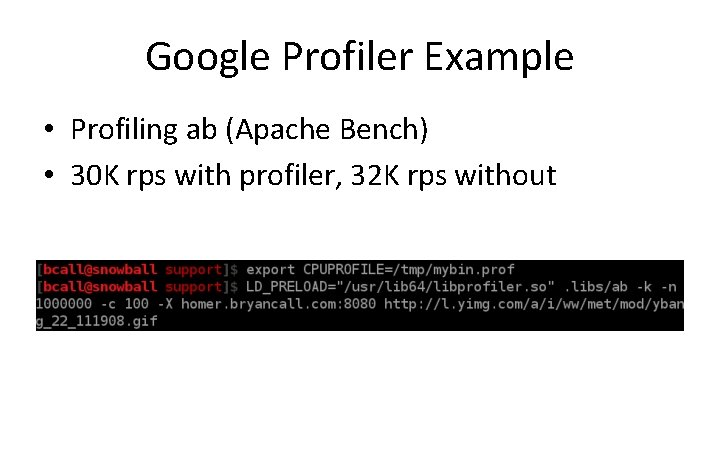
Google Profiler Example • Profiling ab (Apache Bench) • 30 K rps with profiler, 32 K rps without
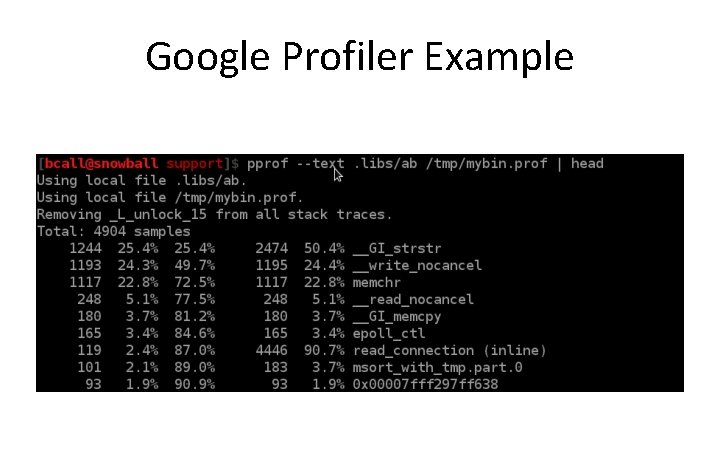
Google Profiler Example
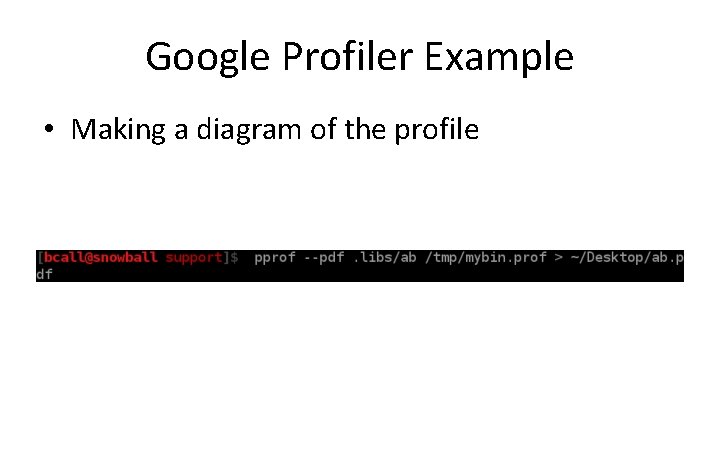
Google Profiler Example • Making a diagram of the profile
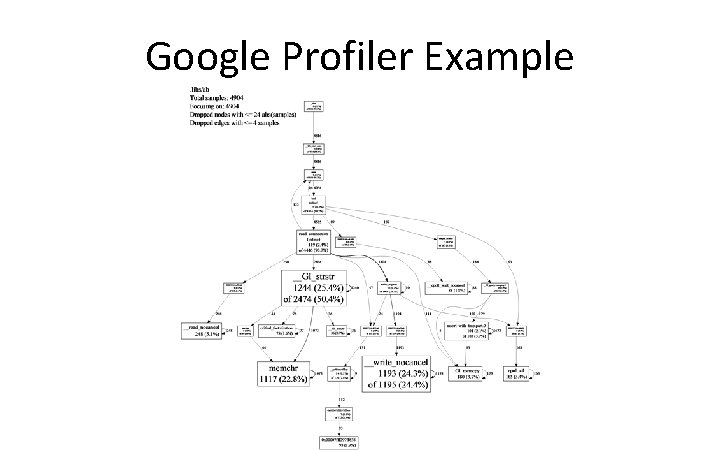
Google Profiler Example
Google Profiler Example
Vagrind’s callgrind • • All in userland Requires no code changes Really slows down your application Lots of detail since it is not sampling
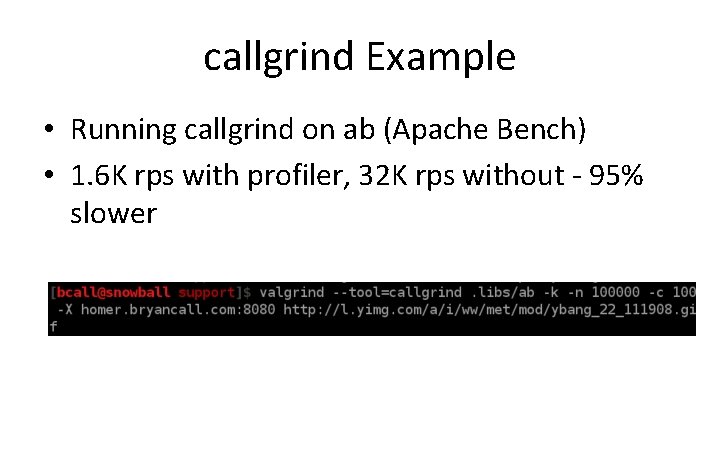
callgrind Example • Running callgrind on ab (Apache Bench) • 1. 6 K rps with profiler, 32 K rps without - 95% slower
callgrind Example
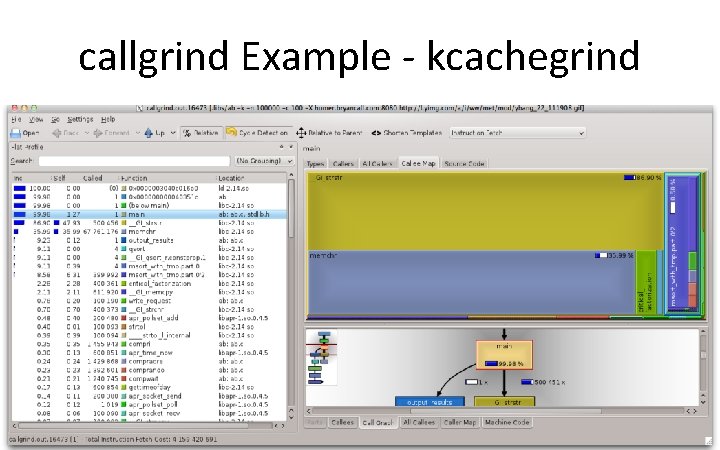
callgrind Example - kcachegrind
Recap • Understand your workload • Find your bottleneck • Profile
Ways to Improve Performance • Caching – Don't do the same work twice • Choose the correct algorithms and data structures – dqueue vs list, hash vs trees, locks vs read/write locks, bloom filter • Memory allocation – Reuse memory, stack vs heap, tcmalloc • Make fewer system calls – Larger writes and reads • Faster hardware – Bonded NICs, SSDs or RAID, CPU more cores
References • Email: bcall@apache. org • How to profile ATS – https: //cwiki. apache. org/TS/profiling. html
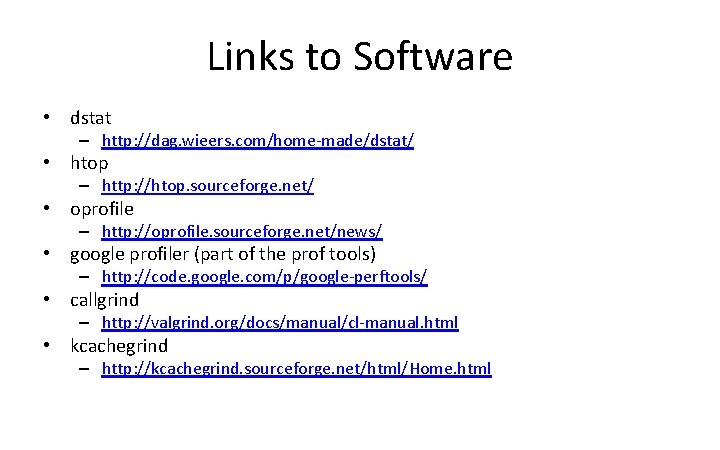
Links to Software • dstat – http: //dag. wieers. com/home-made/dstat/ • htop – http: //htop. sourceforge. net/ • oprofile – http: //oprofile. sourceforge. net/news/ • google profiler (part of the prof tools) – http: //code. google. com/p/google-perftools/ • callgrind – http: //valgrind. org/docs/manual/cl-manual. html • kcachegrind – http: //kcachegrind. sourceforge. net/html/Home. html
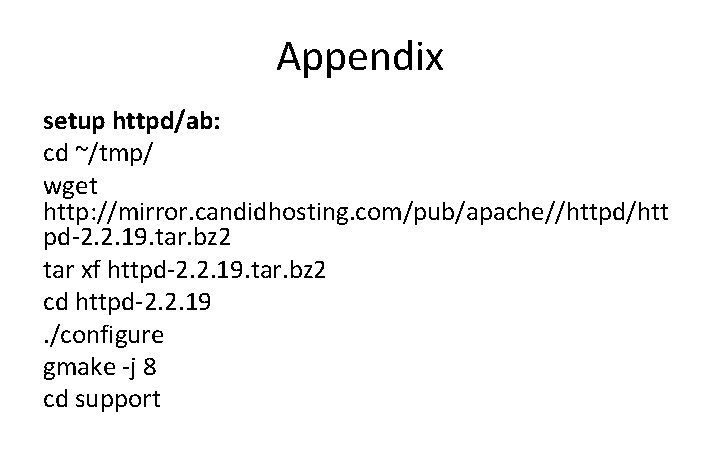
Appendix setup httpd/ab: cd ~/tmp/ wget http: //mirror. candidhosting. com/pub/apache//httpd/htt pd-2. 2. 19. tar. bz 2 tar xf httpd-2. 2. 19. tar. bz 2 cd httpd-2. 2. 19. /configure gmake -j 8 cd support
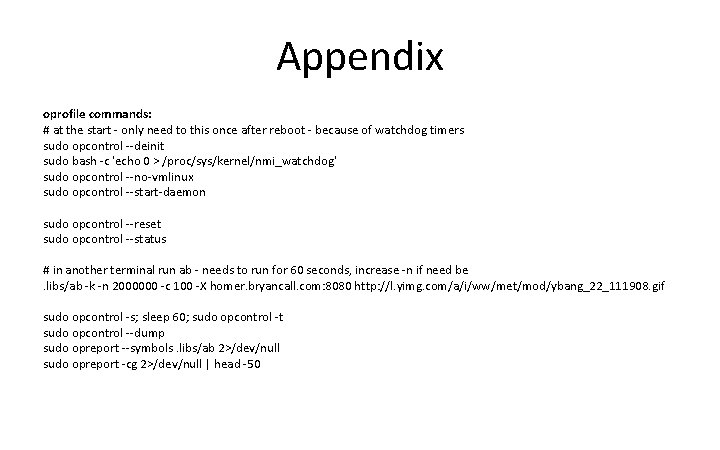
Appendix oprofile commands: # at the start - only need to this once after reboot - because of watchdog timers sudo opcontrol --deinit sudo bash -c 'echo 0 > /proc/sys/kernel/nmi_watchdog' sudo opcontrol --no-vmlinux sudo opcontrol --start-daemon sudo opcontrol --reset sudo opcontrol --status # in another terminal run ab - needs to run for 60 seconds, increase -n if need be. libs/ab -k -n 2000000 -c 100 -X homer. bryancall. com: 8080 http: //l. yimg. com/a/i/ww/met/mod/ybang_22_111908. gif sudo opcontrol -s; sleep 60; sudo opcontrol -t sudo opcontrol --dump sudo opreport --symbols. libs/ab 2>/dev/null sudo opreport -cg 2>/dev/null | head -50
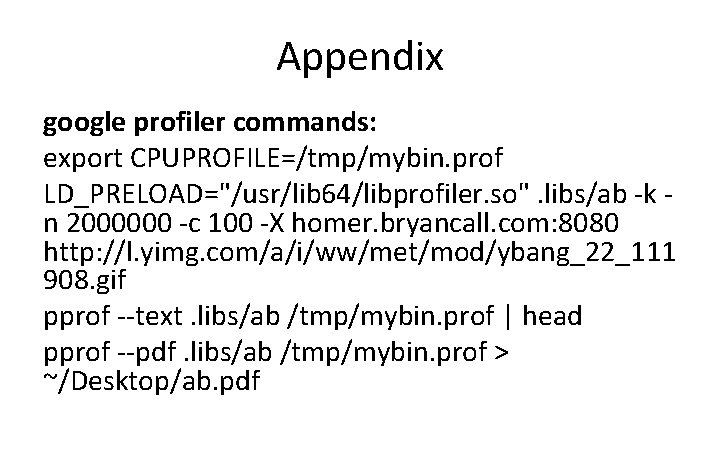
Appendix google profiler commands: export CPUPROFILE=/tmp/mybin. prof LD_PRELOAD="/usr/lib 64/libprofiler. so". libs/ab -k n 2000000 -c 100 -X homer. bryancall. com: 8080 http: //l. yimg. com/a/i/ww/met/mod/ybang_22_111 908. gif pprof --text. libs/ab /tmp/mybin. prof | head pprof --pdf. libs/ab /tmp/mybin. prof > ~/Desktop/ab. pdf
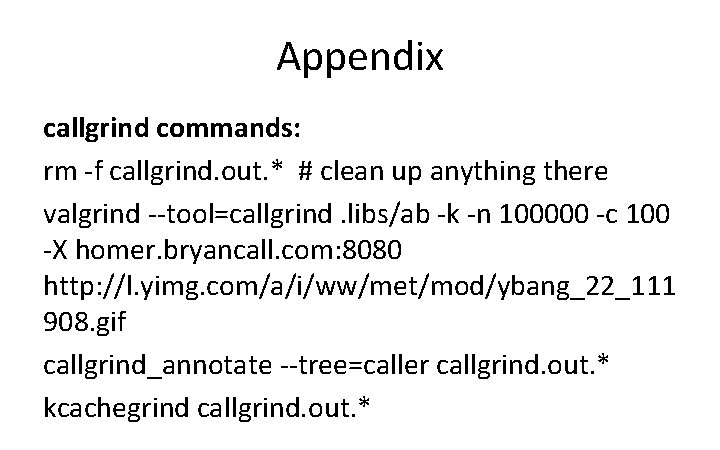
Appendix callgrind commands: rm -f callgrind. out. * # clean up anything there valgrind --tool=callgrind. libs/ab -k -n 100000 -c 100 -X homer. bryancall. com: 8080 http: //l. yimg. com/a/i/ww/met/mod/ybang_22_111 908. gif callgrind_annotate --tree=caller callgrind. out. * kcachegrind callgrind. out. *
Notes • Had problems with --separate=lib or -separate=thread not changing output on Fedora Core 15
- Slides: 42