Profiles and Fuzzy KNearest Neighbor Algorithm for Protein

Profiles and Fuzzy K-Nearest Neighbor Algorithm for Protein Secondary Structure Prediction Rajkumar Bondugula, Ognen Duzlevski and Dong Xu Digital Biology Laboratory, Dept. of Computer Science University of Missouri – Columbia, MO 65211, USA

Outline l Introduction å Protein secondary structure prediction å Popular methods å K-Nearest Neighbor method å Fuzzy K-Nearest Neighbor method l l Methods Filtering the prediction Results and discussion Summary and Future work

Introduction l l Goal: Given a sequence of amino acids, predict in which one of the eight possible secondary structures states {H, G, I, B, E, C, S, T} will each residue fold in to. CASP convention å {H, G, I} → H å {B, E} → E å {C, S, T} → C l Example: Amino Acid VKDGYIVDXVNCTYFCGRNAYCNEECTKLXGEQWASPYYCYXLPDHVRTKGPGRCH Secondary Structure CEEEEEECCCCCCHHHHHCCCCEEEEECCCCCCC

Protein 3 -Dimensional structure

Importance of Secondary Structure l l l An intermediate step in 3 D structure prediction å structure → function Classification å Ex: α, β, α/β, α+β Helps in protein folding pathway determination

Existing Methods l Popular Methods å Neural Network methods X Ex: PSIPRED, PHD å Nearest Neighbor methods X Ex: NNSSP å Hidden Markov Model methods

Why K-Nearest Neighbors method? l Methods based on Neural Networks and Hidden Markov models å perform well if the query protein have many homologs in the sequence database å not easily expandable l l The 1 -Nearest Neighbor rule is bound above by no more than twice the optimal Baye’s error rate [Keller et. al, 1985] K-NN will work better and better as more and more structures are being solved

K-Nearest Neighbor Algorithm Classified instances Instances to be classified

K-Nearest Neighbor Algorithm Classified instances Instances to be classified

K-Nearest Neighbor Algorithm class B class F Instances to be classified

K-Nearest Neighbor Algorithm l Advantages of Nearest Neighbor methods å Simple and transparent model å New structures can be added without re-training å Linear complexity l Disadvantage å Slower compared to other models as processing is delayed until prediction is needed

Why Fuzzy K-NN? l Disadvantages of Crisp K-NN å Atypical examples are given as much as weight as those that truly represent a particular class å Once instance is assigned to a class, there is no indication of its “strength” of its membership in that class

- - - N L G A G N S G L N L G H V A L T F

- - - N L G A G N S G L N L G H V A L T F - - - N L G A

- - - N L G A G N S G L N L G H V A L T F - - - N L G A G

- - - N L G A G N S G L N L G H V A L T F - - -- NN LL GG AA GG N

- - - N L G A G N S G L N L G H V A L T F - - -- N- LN GL AG GA N S

- - - N L G A G N S G L N L G H V A L T F - - -- N L G A G N S G

Position Specific Scoring Matrix. . . N L G A G N S G L N L G H V A L T F. . . PSI-BLAST A . . . R . . . -1 -3 -2 -2 -3 -3 -1 -3 -4 N . . . 3 -2 -1 -2 -2 D . . . 2 -3 -3 -3 -2 -2 -3 C . . . 0 -2 Q . . . -1 -3 -4 -4 -1 -3 -3 -4 -4 E . . . G . . . -1 -3 -3 -2 -2 -3 -3 -3 -4 -2 -3 -4 H . . . 4 -2 -1 -1 -2 -2 -2 -1 -2 -3 -1 3 0 3. . . I . . . 0 -1 4 4 3. . . L . . . 0 -3 -1 -2 -3 6 -3 -4 -4 -2 -3 -4 -3 -1 -2 3. . . K . . . 0 -3 -4 -4 -2 -3 -3 M . . . 2 -1 F . . . -2 -2 P . . . 2 -3 -3 -3 -2 -2 -3 S . . . 0 -2 T . . . -1 -3 -4 -4 -1 -3 -3 -4 -4 W . . . Y . . . -1 -3 -3 -2 -2 -3 -3 -3 -4 -2 -3 -4 V . . . 5 -2 -2 -2 -1 -1 -1 0 -2 -2 -2 -1 -1 -3 -1 0 -2 0 0 -3 3. . . 0 -1 -3 -2 -1 3. . . 8 -1 -2 4. . . 6 -4 -1 4 0 -3 -2 -2 0 -1 -1 -1 -2 -3 -3 -1 -2 -3 -1 3 4 4 0 -1 -1 -1 -2 -2 -3 -1 5 -3 3 -3. . . 4 0 -1 -1 -1 -2 -2 -2 -1 -2 -3 -2 1 0 4 -3 -1 -1 -2. . . 0 -1 -1 -1 -2 -2 -2 -1 -2 -3 -2 2 0 -3. . . 8 -1 -2 -4. . . 2 -2 -1 -2 -3 -2 1 1 1 3. . . 1 -2 -1 -4 -4 -2 -1 -1 5. . . 1 0 -2 0 4 -3 -1 -1 0 -1 -1 -1 -2 -2 -2 -1 -2 -3 -2 2 0 -3 5 2. . . 4 3. . . 0 -1 -3 -2 -1 3. . . 0 -1 -1 -1 -2 -2 -2 -1 -2 -3 -2 4 3. . . 8 -1 -2 4. . . 4 -2 -1 -1 -2 -2 -2 -1 -2 -3 -1 Length of protein(l) 4 2. . . 4 3 0 3. . . 20

Why Profile-FKNN? l Evolutionary information has been shown to increase the accuracy of secondary structure prediction by many popular methods l An attempt to combine the advantages of incorporating the evolutionary information, fuzzy set theory and nearest neighbor methods

Methods l Calculate profiles using PSI-BLAST å The popular Rost and Sander database of 126 representative proteins (<25% sequence Identity) l l l Find K-Nearest Neighbors Calculate the membership values of the neighbors Calculate the membership values of the current residue Assign classes Filter the output

Profile Calculation l The profiles of both the query protein and the test protein are calculated using the program PSI-BLAST l Parameters for PSI-BLAST å Expectation Value (e) = 0. 1 å Maximum number of passes (j) = 3 å E-value threshold for inclusion in multi-pass model (h) = 5 å Default values for the rest of the parameters

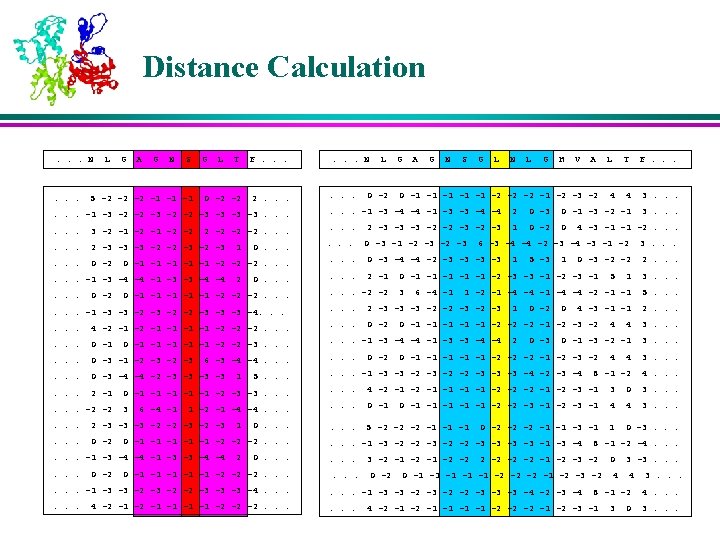
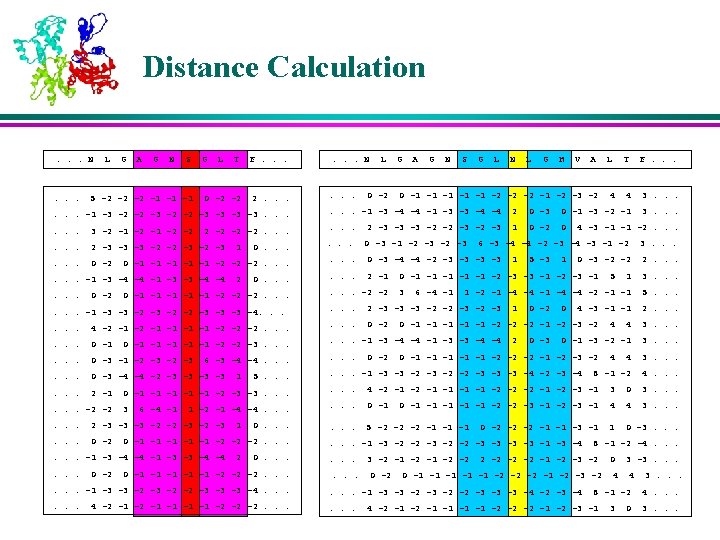
K-Nearest Neighbors l For each profile-window in the query protein, the position-weighted absolute distance ‘d’ is calculated from all profile-windows of all proteins in the database. l The profile-windows corresponding to K smallest distances are retained as the K-Nearest Neighbors
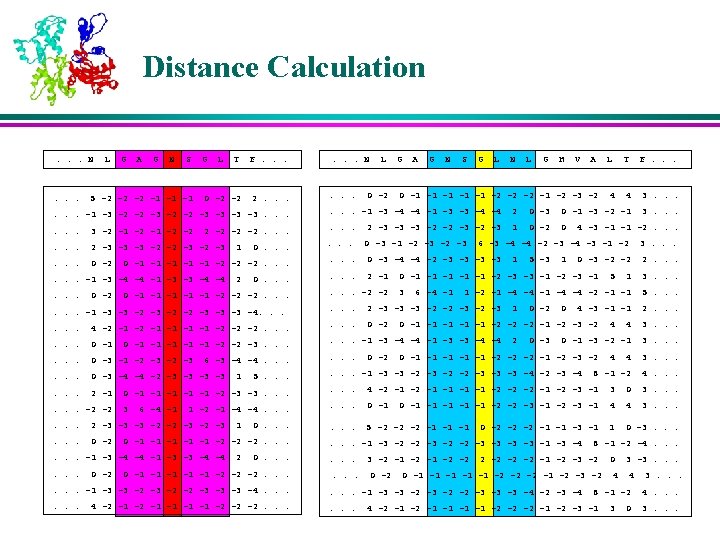
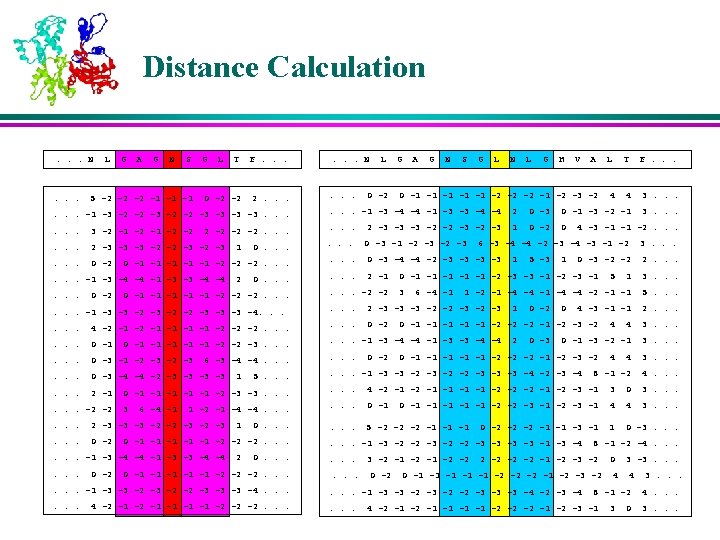
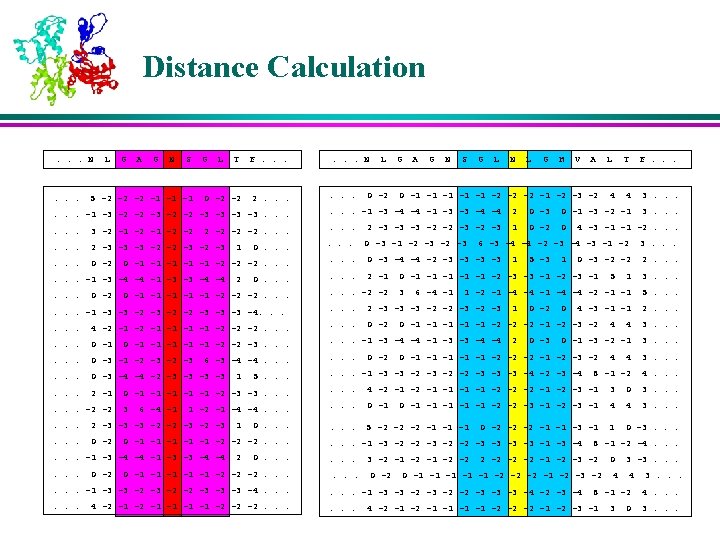
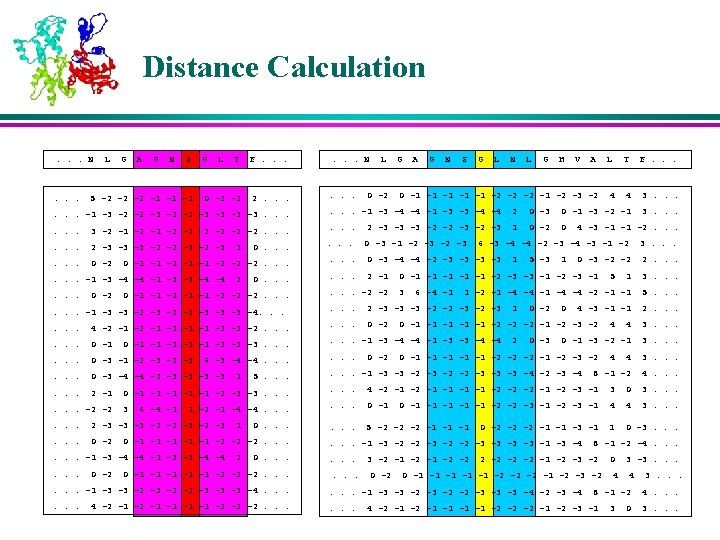

Membership Values of the Neighbors l The memberships of the nearest neighbors are assigned based on their corresponding secondary structures in various positions in the window l The residues near to the center are weighed more than the residues that are farther away

Membership values of the Neighbors N L G AA G N S 0. 067 0. 133 0. 20 0. 133 0. 067 H E C 1 1 1 C C E 1 E 1 1 C C H = 0 E = 0. 200 x 1 + 0. 20 x 1 = 0. 6 C C E EE E C C C = 0. 067 x 1 + 0. 133 x 1 + 0. 067 x 1 = 0. 4

Membership Value l The membership values of each residue in classes Helix, Sheet and Coil is calculated from the corresponding neighbors using the Fuzzy K-NN algorithm l Each residue is assigned to class in which it has the highest membership value Helix =. . . 15 22 61 91 Sheet =. . . 22 28 13 1 1 Coil 50 26 8 C H H =. . . 63 Final =. . . C 95 96 26 21 23 18 29 30 24 17 5 8. . . 2 8 8 12 11 42 44 46 29 14 10. . . 4 2 65 71 29 26 31 53 81 82. . . H H C C E E E C C C. . .

Fuzzy K-Nearest neighbor Algorithm BEGIN Where, Initialize i=1. DO UNTIL(r assigned membership in all classes) ui = membership value of Compute ui(r) using residue ‘r’ in class ‘i’, i = Helix, Sheet or Coil d(r, rj)= distance between query window centered in residue ‘r’ its jth Increment i. END DO UNTIL END neighbor m = 2 (Fuzzifier)

Structure Filtration l In the basic setting, the secondary structure state is class with highest membership value l Unrealistic structures may be present l Popular methods of structure filtration å Neural Network å Heuristic based

Heuristic Filter 1. Smoothen the memberships values 2. Filter unrealistic structures l Helix > 3 amino acids, -sheet > 2 amino acids 3. Calculate thresholds to filter noise 4. Mark the possible Helix and Sheet regions l 5. Resolve conflicts based on average membership value in overlap region Fill the rest of the structure with Coil

Filter: Final Structure Unfiltered CCCCCHHHHHHHHCCCCCCEEEEECCCCCCCEEEEEECCCCCCHHHCCCCC Target CCCHHHCCCCHHHHHHCCCCEEEEEECCCCCCEEEEEEECCCCEEC Filtered CCHHHHCCCHHHHHHHCCCEEEEEECCCCCCEEEEEEECCCCCCC

Metrics l Seven commonly used metrics å Q 3 = Number of correctly predicted residues x 100 Total number of residues å Q<H, E, C>= Number of <helix, sheet, coil> residues correctly predicted X 100 Total number of residues in <helix, sheet, coil> å Matthew’s Correlation Coefficient MCC<H, E, C>= where, p – true positives n – true negatives u – false negatives o – false positives
 generated by the PISCES")
Results Performance on database of 1973 proteins (<25% sequence identity) generated by the PISCES 1 server Q 3(%) QH(%) QE(%) QC(%) Unfiltered Filtered MH ME MC 74. 0 69. 6 55. 8 79. 9 0. 58 0. 61 0. 54 76. 2 68. 1 66. 1 80. 4 0. 64 0. 56 1. G. Wang and R. L. Dunbrack, Jr. PISCES: a protein sequence culling server. Bioinformatics, 19: 1589 -1591, 2003.

Relative Performance Method Accuracy MBR 1 66. 40 NN 2 68. 00 NNSSP 3 72. 20 PFKNN 76. 20 1. X. Zhang, J. P. Mesirov and D. L Waltz. Hybrid system for Protein Secondary Structure Prediction. J. Mol. Biol. , 225: 1049 -1063, 1992 2. Tau-Mu Yi and E. S. Lander. Protein Secondary Structure Prediction using Nearest-Neighbor Methods. J. Mol. Biol. , 232: 1117 -1129, 1993 3. A. A. Salamov and V. V. Solovyev. Prediction of Protein Secondary Structure by Combining Nearest-neighbor Algorithm and Multiple Sequence Alignments. J. Mol. Biol. , 247: 11 -15, 1995

Summary l A novel approach for PSSP å Evolutionary information å K-Nearest Neighbor algorithm å Fuzzy set theory Most accurate KNN approach to date l Easily expandable l Accuracy increases with new structures l Average computing time < 1 min on a single CPU machine l

Future Work l l System with faster search capabilities å Efficient search for neighbors Accurate prediction system

Acknowledgements l Dr. James Keller for insight into the Fuzzy K-Nearest Neighbor Algorithm l Oak Ridge National Laboratory for providing the supercomputing facilities l Members of Digital Biology Laboratory for their support

Software The enhanced version of the software is coded in C and is available upon request. Please e-mail your requests to Raj@mizzou. edu or Xu. Dong@missouri. edu

Thank you for Participation!
- Slides: 44