PRODUCTION POSSIBILITY CURVE PPC WATCH FOR Key Points

PRODUCTION POSSIBILITY CURVE PPC WATCH FOR *

*Key Points Production Possibility Curve What is it? What is it used for? What does it look like? Points-Inside & Outside 2 SHAPES

Define n Macroeconomics- n Microeconomics-

1. Macro economics – concerned with the economy as a whole Macro examines economy of countries OR ________ . . 2. Micro economics – examines individuals, households, companies & ________

**** Is the following Micro or Macro? 1. DELL raises price of PC’s last year. 2. Unemployment was 5. 4% for the U. S. workforce. 3. Unemployment in the auto industry was 8% last year. 4. USA National Bank lowered its interest rates on CDs to 8%. 5. The Inflation rate rose to 2. 7% last year. 6. The computer industry laid off 8% of its workers last year. 7. The price of gasoline rose 25% last year. 8. The EU (European Union) admits 2 new countries. 9. Weak Real Estate market in Pinellas Park. 10. Home sales in US down from last year.

MODELS n Oversimplification of reality n EX’s n Economists use a popular model called a ….

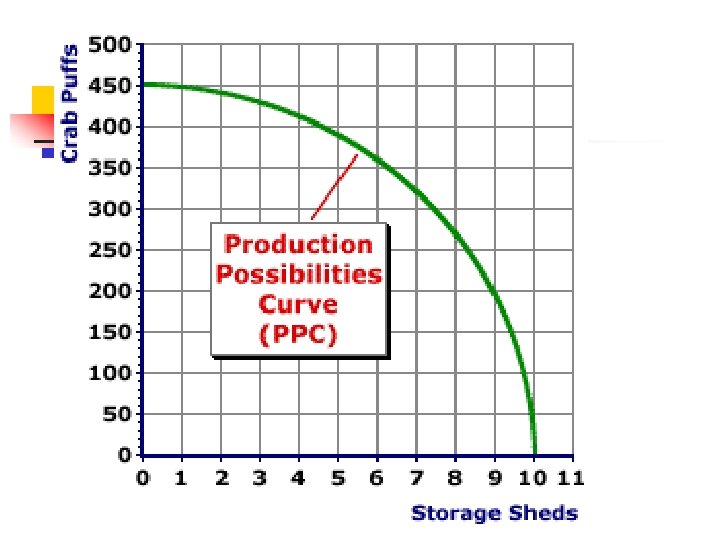
PRODUCTION POSSIBILITY CURVE PPC
 ? A graph that shows the maximum")
What is a production possibilities curve (PPC) ? A graph that shows the maximum combinations of two outputs that an economy can produce, given its available resources and technology
 A line that shows the maximum combinations")
What is a production possibilities frontier (PPF) A line that shows the maximum combinations of two outputs that an economy can produce, given its available resources and technology They are the same

PPC: FISH & JEANS FISH 3 A 2 If the country is at point A on the PPF It can produce the combination of _____ FISH and ____ BLUE JEANS What happened when production moved from Point A to B ? _______ B 1 OC= 2 OB= 3 3. 5 BLUE JEANS

From T to R OB= ? OC= ?

* n n is a hypothetical representation of the amount of two different goods that can be obtained by shifting resources from the production of one, to the production of the other. The curve is used to describe a country’s choice between two different goods. Q WHY SHOULD YOU CARE? ? n A- What if…? n

What 2 Types of Goods must ALL countries produce? GUNS & BUTTER: n THE CLASSIC ECONOMIC MODEL
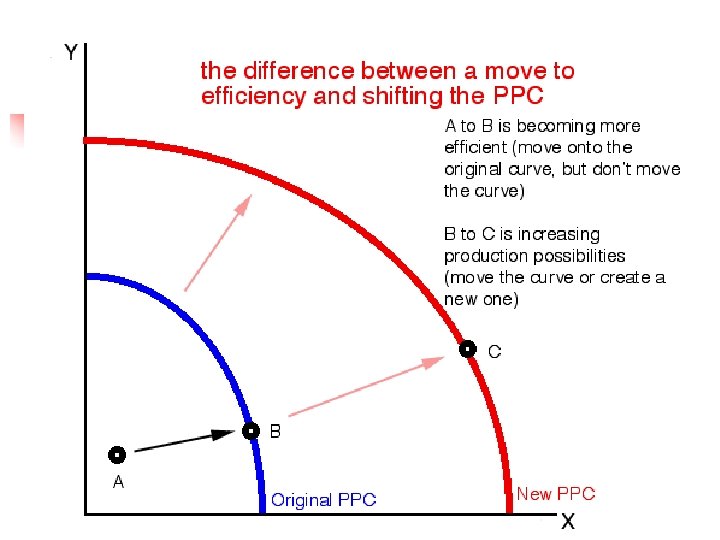
 PPC Concepts 1. Scarcity /Choices represented by pts A, B. or C. 2.")
(5) PPC Concepts 1. Scarcity /Choices represented by pts A, B. or C. 2. Opportunity Cost is illustrated in terms of moving from one point to another when resources are utilized to their full potential. [must make choices] 3. TRADE OFFS. 4. Efficiency - maximum output So… any point on the line (PPF) represents an economy working at its most efficient. 5. Economic growth

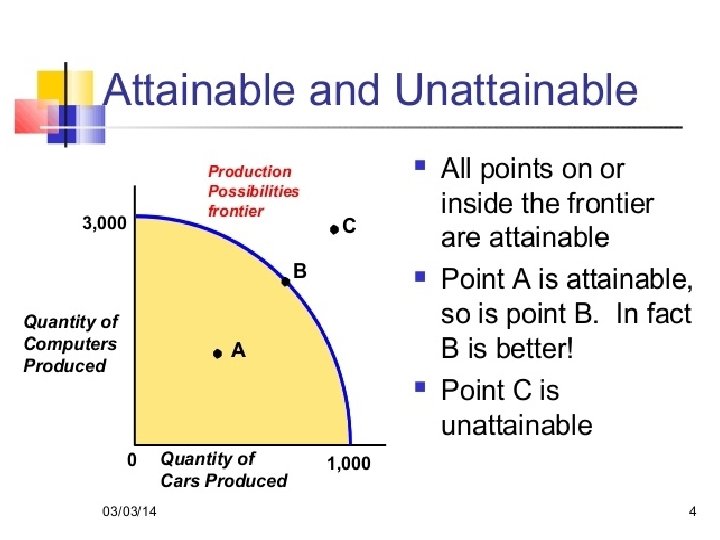
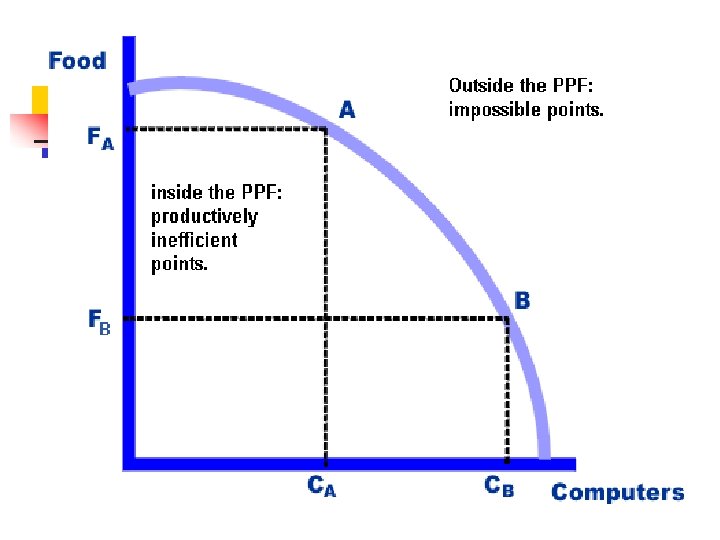
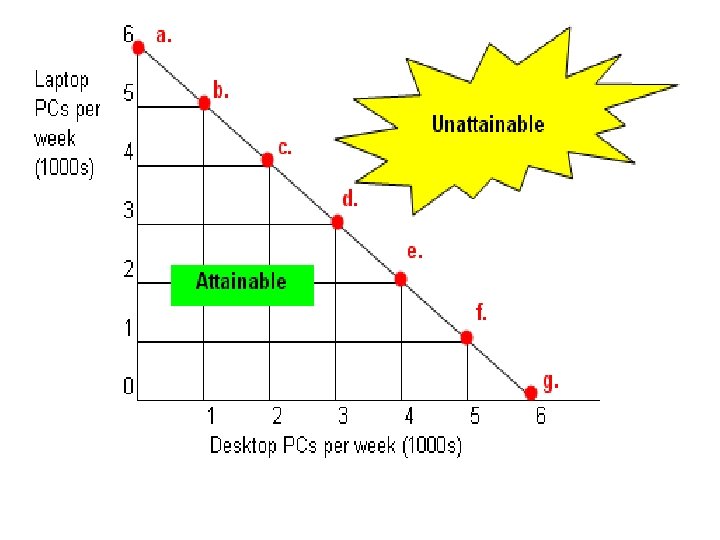
INSIDE & OUTSIDE the PPF n n No ‘ideal’ point on the curve Any point inside the curve – suggests resources are not being utilised efficiently INEFFICIENT or UNDERUTILIZED n Any point outside the curve – not attainable with the current level of resources UNATTAINABLE or IMPOSSIBLE n * Useful to demonstrate economic growth and opportunity cost

Production Possibilities Curve A Efficient Military Goods Unattainable Inefficient B Consumer Goods
 Q 14 13 12 11 A B 10 C 9")
PRODUCTION POSSIBILITIES Robots (thousands) Q 14 13 12 11 A B 10 C 9 8 7 D 6 5 Attainable 4 3 but 2 Inefficient 1 1 2 3 Pizzas Unattainable W Attainable & Efficient E 4 5 6 7 (hundred thousands) 8 Q
 Q 14 13 12 11 10 9 8 7 6")
PRODUCTION POSSIBILITIES Robots (thousands) Q 14 13 12 11 10 9 8 7 6 5 4 3 2 1 Unemployment & Underemployment Shown by Point U More of either or both is possible U 1 2 3 4 5 6 7 8 Pizzas (hundred thousands) Q
")
What is OC of moving from inefficient to efficient? (F to PPF)

What is OC of A to B?

GUNS & BUTTER: WWII
 When the U. S. entered WWl. I, we")
Going to War (U. S. ) When the U. S. entered WWl. I, we had severe unemployment. We were able to step up production of consumer goods and war materials simply by getting to full production. We went from 14. 6% unemployment in 1940 to 1. 2% in 1944. Over 7 million people went to work that were not working in 1940. United States C War Goods [Beginning of WWII] F Civilian Goods Going to War(Russia) Russia, on the other hand, entered WWII at full capacity. So their preparedness entailed a shifting of resources from civilian goods and a drop in their standard of living. The U. S. position was similar as we entered the Viet Nam War at full employment. Our attempt to achieve more “guns and butter” was doomed. We were trying to spend beyond capacity and ended up with double digit inflation in the 1970 s. C Russia War Goods D Civilian Goods [Beginning of WWII]
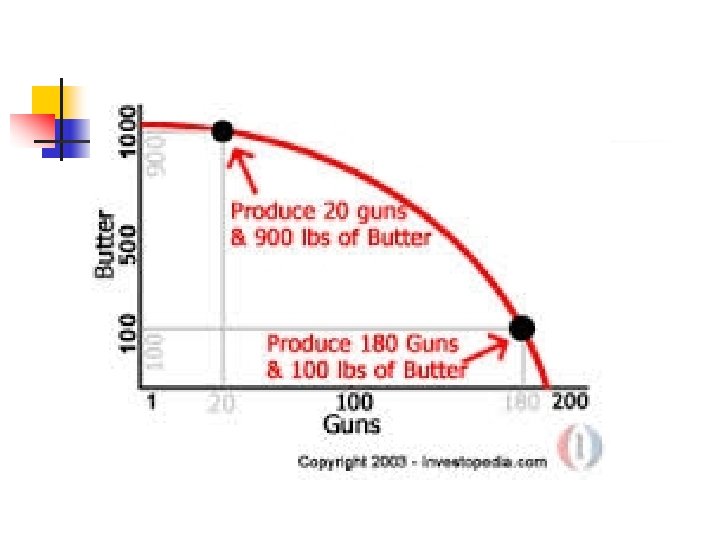

Economies/Countries must choose how they want to allocate resources efficiently To Eat or To War? We can make lots of food, but be vulnerable to attack We can be militarily strong, but be very hungry

n Macro OR Micro ?
 & (1) Available")
PPC : Assumptions n n Given period of time (FREEZE Time) & (1) Available resources are fixed (2) NO in Technology
 to points ______ or _______")
PPC & SCARCITY ? Scarcity limits an economy(or country) to points ______ or _______ its PPF

• BOB’S MEAN DOG n

Shapes & Shifts

SHAPE-*set up 2 Col Notes
 to the production of both types of goods")
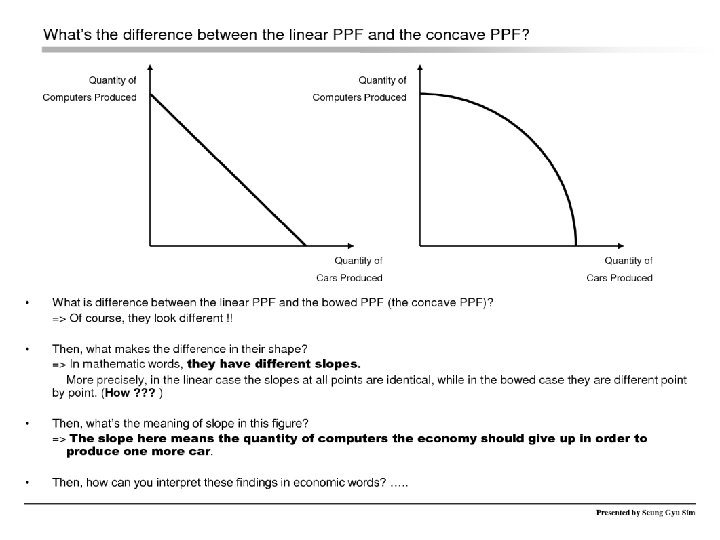
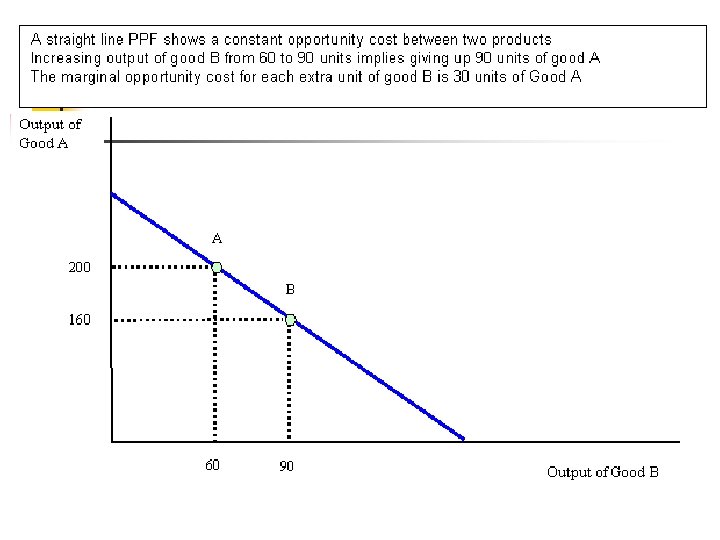
Linear - perfectly adaptable (or substitutable) to the production of both types of goods OC= ?

CURVED OR CONCAVE

**Concave vs. Convex***** ? ? ? ? ? n A concave surface curves inward. The word is easy to remember because a concave indentation in a wall makes a cave.

SHAPE ? Law of Increasing OC * Resources are not all perfectly adaptable to the production of both types of goods SO…. Costs increase as you shift resources to produce a new good. n Law of Increasing OC : as the production of one good rises, the opportunity cost of producing that good increases. It will be a CONCAVE curve

x


Law of Increasing Opportunity Cost

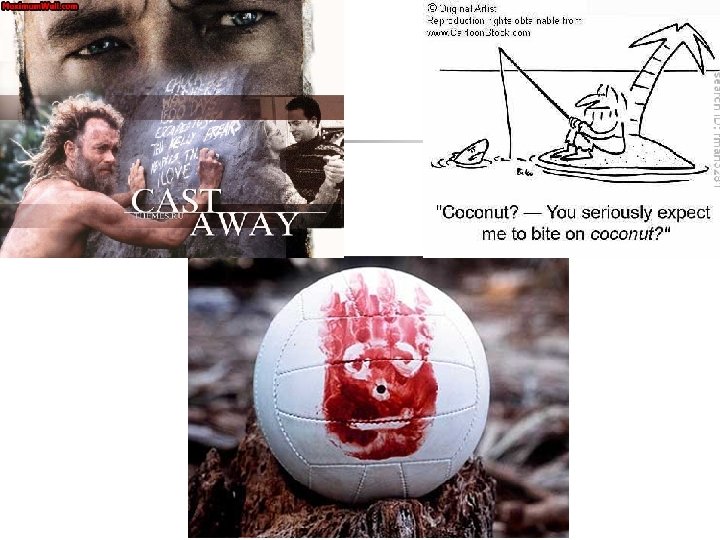
*The opportunity cost of 1 fish is the amount of coconuts Robinson could be collecting if he were not fishing. It takes him an hour to catch one fish (a lousy fisher, no doubt). n Since he can collect 10 coconuts per hour, the opportunity cost of one fish is ____ coconuts. n

*"when more and more time and effort is devoted to one activity, the cost in terms of other activities sacrificed becomes greater and greater. " * This is a principle of human behavior which everyone has seen in action. One example : tragedy of alcoholism (or drug addiction).

*Q-What can we conclude about OC based on the shape of this PPC? A- Resources appear to be perfectly substitutable, or equally adaptable to the production of either bullet trains or space missions.
 because n A) OC’s are")
Question Typically production possibilities frontiers are bowed outward (concave) because n A) OC’s are always positive. B) the problem of scarcity is ever present. C) producing one more of one good always entails producing less of another. D) resources are not equally well suited to the production of all goods and services. E) as we produce more and more of one good, the OC of producing that good declines.

SHIFTS

What is economic growth? The ability of an economy to produce greater levels of output, an outward shift of its PPF

SHIFTS = GROWTH Lift the ASSUMPTION Good A C Y 1 Yo . A B Xo X 1 Good B
resource")
What if there is a change? 3 Shifters of the PPC Change in (FOP)resource - 1. 2. Change in Technology 3. Change in Trade -

* And How Is Economic Growth Demonstrated on a Graph? Like This Economic Growth [Ability to produce a larger total output over time] Capital Goods C A b a 0 B D Consumer Goods
 Q 14 13 12 11")
PRODUCTION POSSIBILITIES Notes. . . Economic Growth Robots (thousands) Q 14 13 12 11 10 9 8 7 6 5 4 3 2 1 The ability to produce a larger total output - a rightward shift PPC 1 2 3 4 5 6 7 Pizzas (hundred thousands) 8 Q
 Q 14 13 12 11 10")
PRODUCTION POSSIBILITIES Caused by. . . Robots (thousands) Q 14 13 12 11 10 9 8 7 6 5 4 3 2 1 1. Increase in resources (FOP’s) 2. Technological advances R&D More of either or both is possible 1 2 3 4 5 6 7 8 Pizzas (hundred thousands) Q

-massive new sources of oil and coal are found. -new government comes into power that forbids the use of automated machinery -Suppose there is a major technological breakthrough in ONLY one industry on PPF

Economic Growth pushes the PPF out – better combinations are possible. PPF with new Wheat-making technology The old PPF The new PPF, with growth in Wheatmaking possibilities
 EX’s LABOR – longer")
SHIFTS : n in Resource Availability Discovery of new resources(FOP’s) EX’s LABOR – longer hrs (+) - training, motivation (+) - demand more $ (? ) LAND- Floods (? ) Drought(? ) CAPITAL GOODS- Oil after KATRINA (? ) ENTREPRENEURSHIP- Brain Drain

Computers Technological Advance A Pizzas

NEG SHIFTS

PRODUCTION POSSIBILITIES Assumes. . . Only Two Products Fixed Resources Fixed Technology A Capital Good for example. . . A Consumer Good

PRODUCTION POSSIBILITIES What if we could only produce. . . 10, 000 Robot Arms or 400, 000 Pizzas Using all of our resources, to get some pizza, we must give up some robot arms! for example. . .

Plotting PPC
 Robots 10 9 (in thousands)")
PRODUCTION POSSIBILITIES schedule PIZZA 0 1 (in hundred thousands) Robots 10 9 (in thousands) 2 3 4 7 4 0
 Robots 10 9 (in")
PRODUCTION POSSIBILITIES schedule Schedule PIZZA 0 1 (in hundred thousands) Robots 10 9 (in thousands) 2 3 4 7 4 0 (thousands) Robots graphical form Pizzas (hundred thousands)

PRODUCTION POSSIBILITIES PIZZA 0 1 2 3 4 Robots 10 9 7 4 0 (in hundred thousands) (in thousands) (thousands) Robots graphical form Pizzas (hundred thousands)

PRODUCTION POSSIBILITIES in schedule form PIZZA 0 1 2 3 4 Robots 10 9 7 4 0 (in hundred thousands) (in thousands) (thousands) Robots graphical form Pizzas (hundred thousands)

PRODUCTION POSSIBILITIES in table form PIZZA 0 1 2 3 4 Robots 10 9 7 4 0 (in hundred thousands) (in thousands) (thousands) Robots graphical form Pizzas (hundred thousands)

PRODUCTION POSSIBILITIES in table form PIZZA 0 1 2 3 4 Robots 10 9 7 4 0 (in hundred thousands) (in thousands) (thousands) Robots graphical form Pizzas (hundred thousands)

PRODUCTION POSSIBILITIES in table form PIZZA 0 1 2 3 4 Robots 10 9 7 4 0 (in hundred thousands) (in thousands) (thousands) Robots graphical form Pizzas (hundred thousands)

THE END n ANOTHER MR D PRODUCTION
- Slides: 73