
Production Activity Control When the plan has been

Production Activity Control
• When the plan has been developed, the next step is execution of the plan • Production Activity Control (or often called Shop Floor Control) is to have activities performed as planned • Techniques for scheduling different for various manufacturing systems: – – Project Job shop Batch Flow shop
Scheduling Batch Flow Line • A group of similar items is manufactured on the batch line • The focus is to minimize changeover time • The smaller the changeover time, the greater the scheduling flexibility • It is becoming very complicated when you have sequence-dependent setup
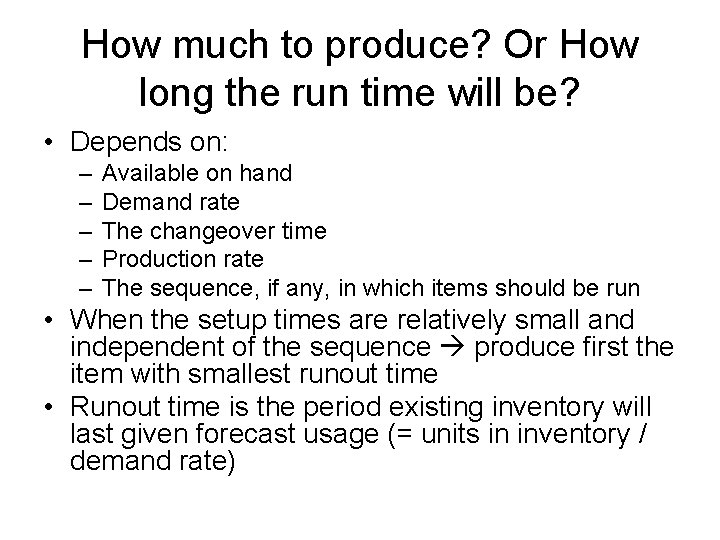
How much to produce? Or How long the run time will be? • Depends on: – – – Available on hand Demand rate The changeover time Production rate The sequence, if any, in which items should be run • When the setup times are relatively small and independent of the sequence produce first the item with smallest runout time • Runout time is the period existing inventory will last given forecast usage (= units in inventory / demand rate)
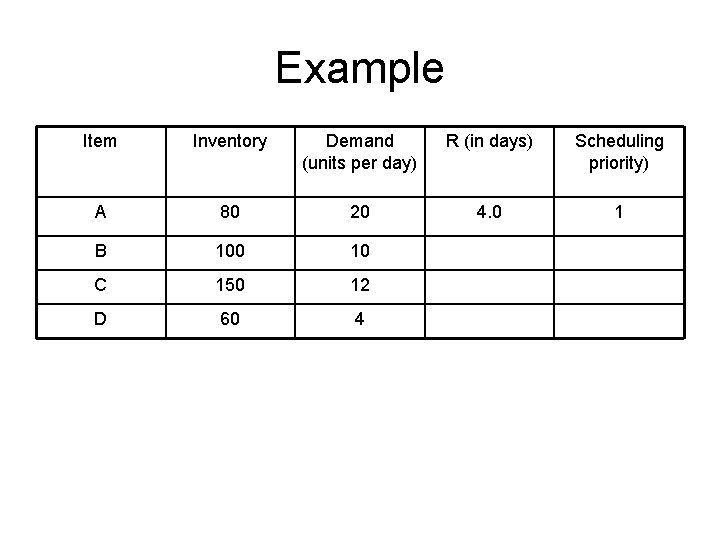
Example Item Inventory Demand (units per day) R (in days) Scheduling priority) A 80 20 4. 0 1 B 100 10 10. 0 2 C 150 12 12. 5 3 D 60 4 15. 0 4
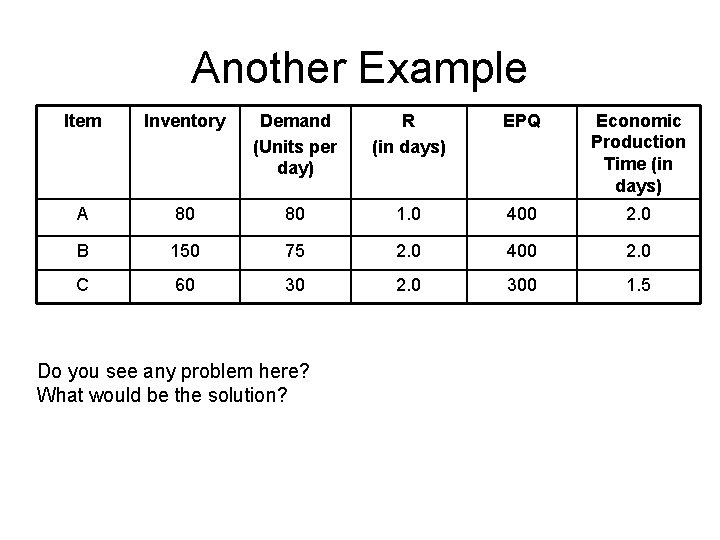
Another Example Item Inventory Demand (Units per day) R (in days) EPQ Economic Production Time (in days) A 80 80 1. 0 400 2. 0 B 150 75 2. 0 400 2. 0 C 60 30 2. 0 300 1. 5 Do you see any problem here? What would be the solution?
Job Shop Scheduling • Job shop production is characterized by: – Process layout – Many orders with different sequence of processes – Scheduling is assigning of starting and completion times to orders (jobs) and frequently includes the time when orders are to arrive and leave each department. – Sequencing is the assigning of the sequence in which orders are to be processed.
Priority Control • To determine the sequence in which orders should be processed • Common Priority Rules: – First come first served (FCFS) – Short processing time (SPT) : results in lowest WIP, lowest MLT, and lowest average job lateness – EDD (Earliest due date): works well when processing times are approximately the same – Slack time (ST): supports the achievement of due date objectives – Critical ratio (CR)
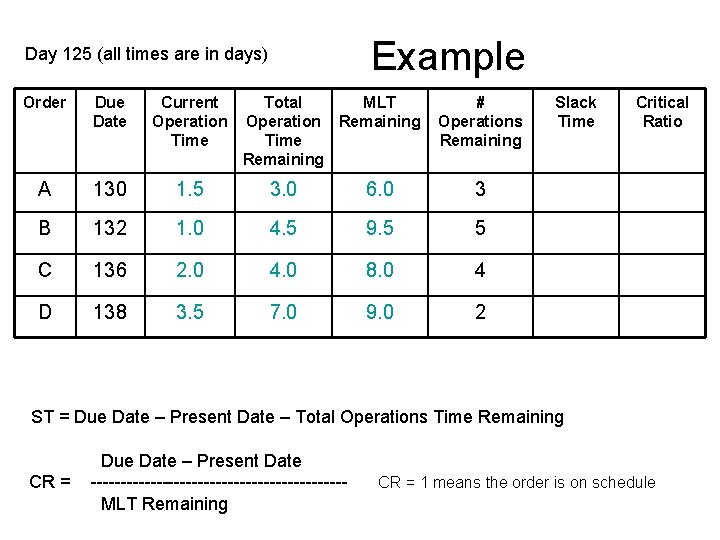
Example Day 125 (all times are in days) Order Due Date Current Operation Time Total MLT Operation Remaining Time Remaining # Operations Remaining Slack Time Critical Ratio A 130 1. 5 3. 0 6. 0 3 2. 0 0. 83 B 132 1. 0 4. 5 9. 5 5 2. 5 0. 74 C 136 2. 0 4. 0 8. 0 4 7. 0 1. 38 D 138 3. 5 7. 0 9. 0 2 6. 0 1. 44 ST = Due Date – Present Date – Total Operations Time Remaining CR = Due Date – Present Date ---------------------MLT Remaining CR = 1 means the order is on schedule
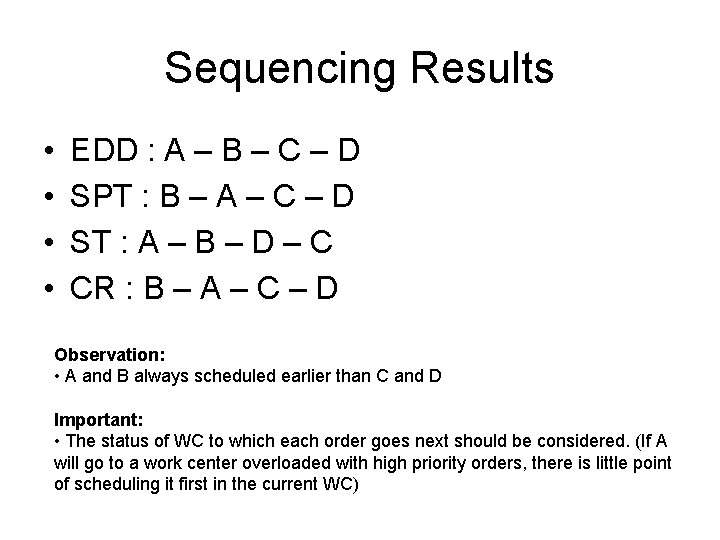
Sequencing Results • • EDD : A – B – C – D SPT : B – A – C – D ST : A – B – D – C CR : B – A – C – D Observation: • A and B always scheduled earlier than C and D Important: • The status of WC to which each order goes next should be considered. (If A will go to a work center overloaded with high priority orders, there is little point of scheduling it first in the current WC)
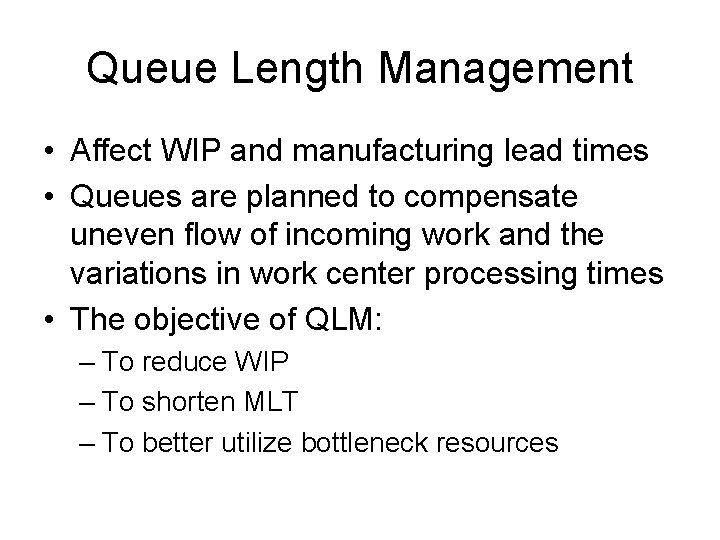
Queue Length Management • Affect WIP and manufacturing lead times • Queues are planned to compensate uneven flow of incoming work and the variations in work center processing times • The objective of QLM: – To reduce WIP – To shorten MLT – To better utilize bottleneck resources
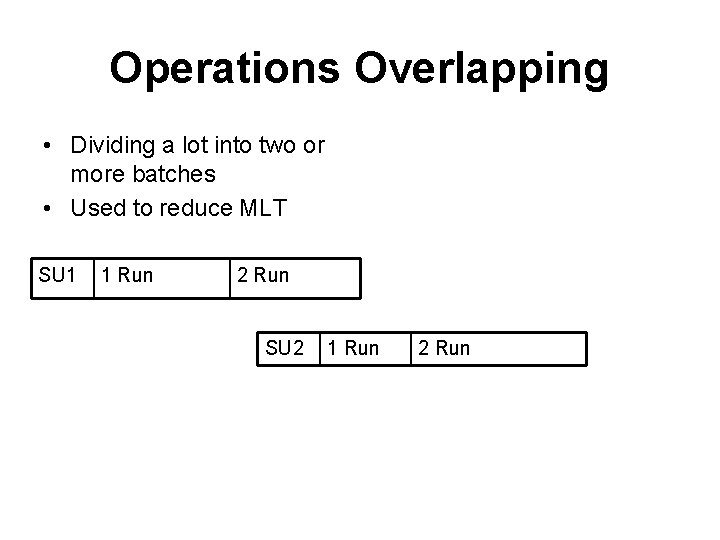
Operations Overlapping • Dividing a lot into two or more batches • Used to reduce MLT SU 1 1 Run 2 Run SU 2 1 Run 2 Run To avoid idle of operation B, SU 2+TAB+Q 1 PB>=Q 2 PA+TAB Where Q = Q 1+Q 2
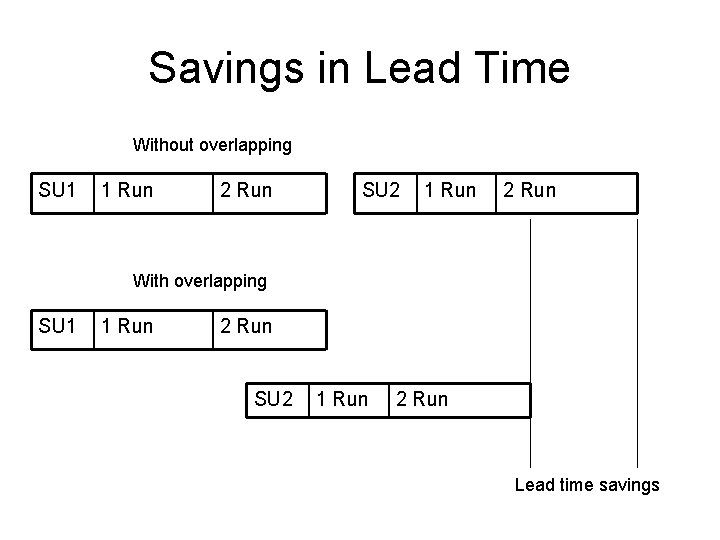
Savings in Lead Time Without overlapping SU 1 1 Run 2 Run SU 2 1 Run 2 Run With overlapping SU 1 1 Run 2 Run SU 2 1 Run 2 Run Lead time savings
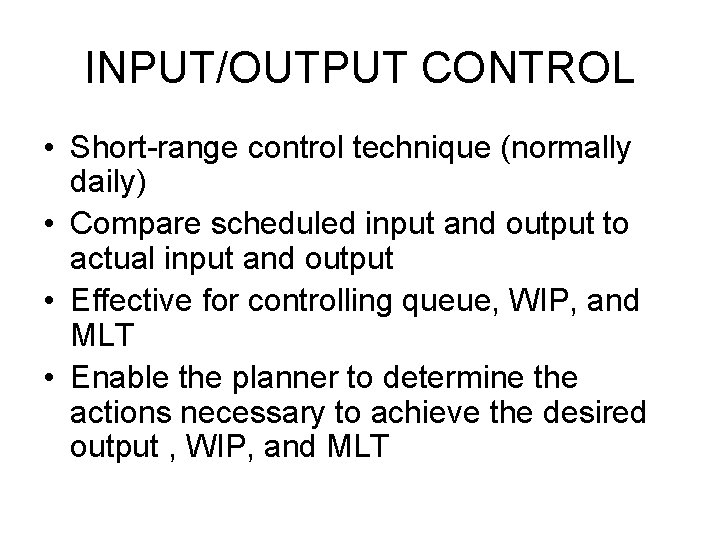
INPUT/OUTPUT CONTROL • Short-range control technique (normally daily) • Compare scheduled input and output to actual input and output • Effective for controlling queue, WIP, and MLT • Enable the planner to determine the actions necessary to achieve the desired output , WIP, and MLT
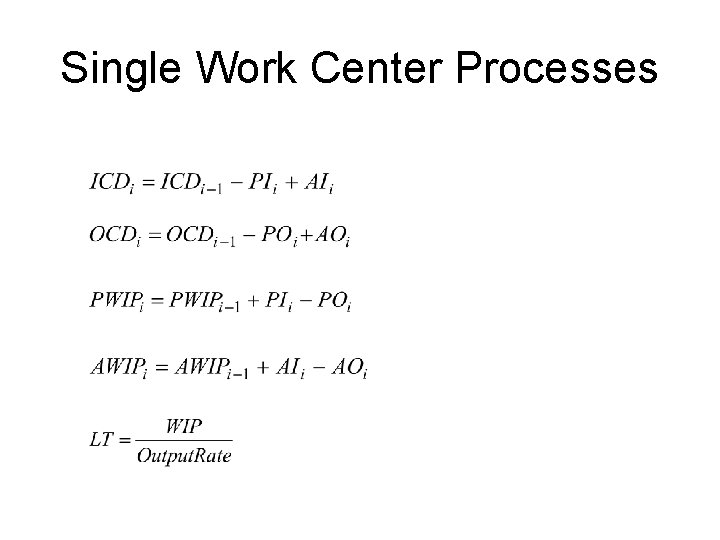
Single Work Center Processes
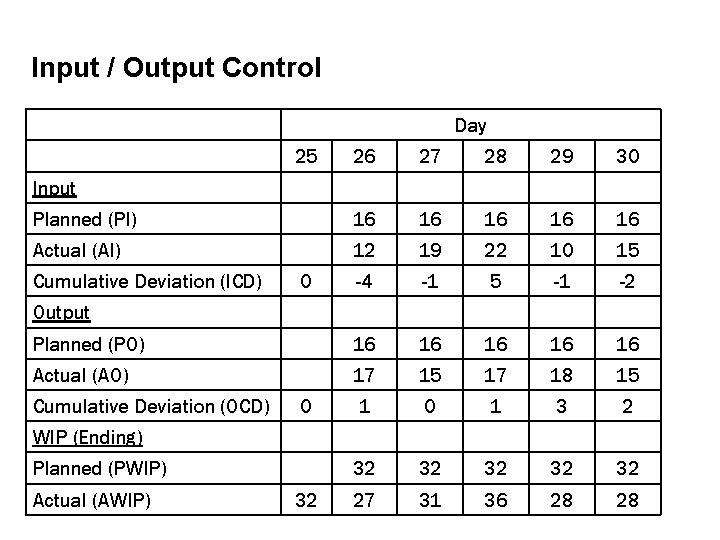
Input / Output Control Day 25 26 27 28 29 30 Planned (PI) 16 16 16 Actual (AI) 12 19 22 10 15 -4 -1 5 -1 -2 Planned (PO) 16 16 16 Actual (AO) 17 15 17 18 15 1 0 1 3 2 32 32 32 27 31 36 28 28 Input Cumulative Deviation (ICD) 0 Output Cumulative Deviation (OCD) 0 WIP (Ending) Planned (PWIP) Actual (AWIP) 32
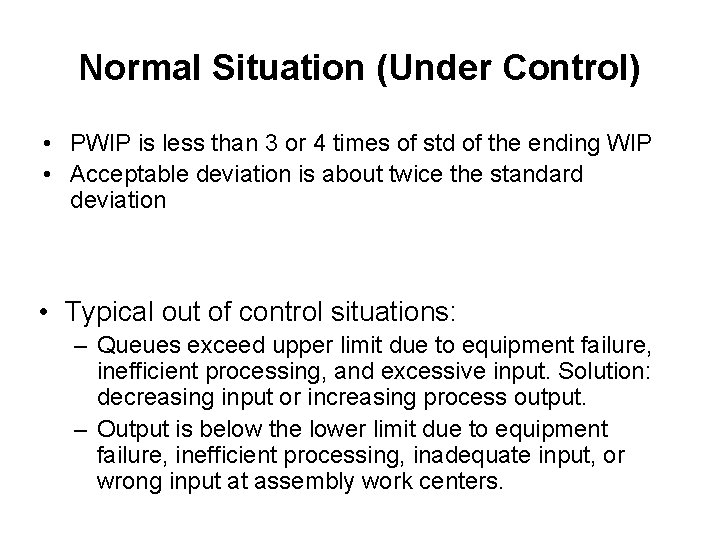
Normal Situation (Under Control) • PWIP is less than 3 or 4 times of std of the ending WIP • Acceptable deviation is about twice the standard deviation • Typical out of control situations: – Queues exceed upper limit due to equipment failure, inefficient processing, and excessive input. Solution: decreasing input or increasing process output. – Output is below the lower limit due to equipment failure, inefficient processing, inadequate input, or wrong input at assembly work centers.
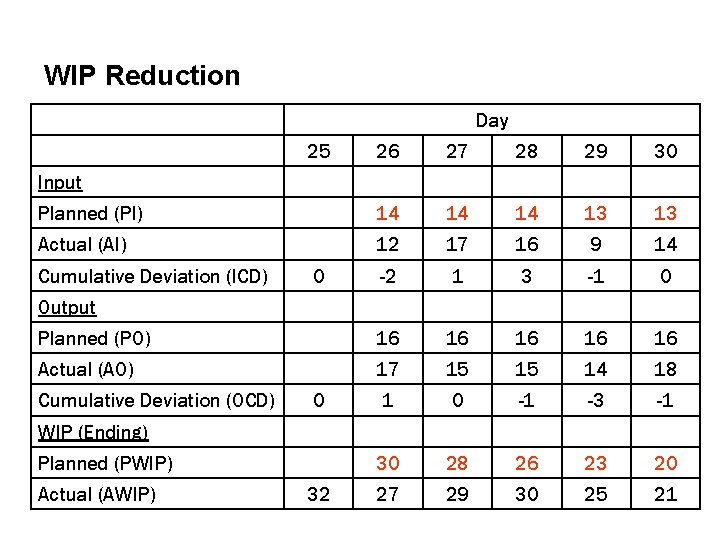
WIP Reduction Day 25 26 27 28 29 30 Planned (PI) 14 14 14 13 13 Actual (AI) 12 17 16 9 14 -2 1 3 -1 0 Planned (PO) 16 16 16 Actual (AO) 17 15 15 14 18 1 0 -1 -3 -1 30 28 26 23 20 27 29 30 25 21 Input Cumulative Deviation (ICD) 0 Output Cumulative Deviation (OCD) 0 WIP (Ending) Planned (PWIP) Actual (AWIP) 32
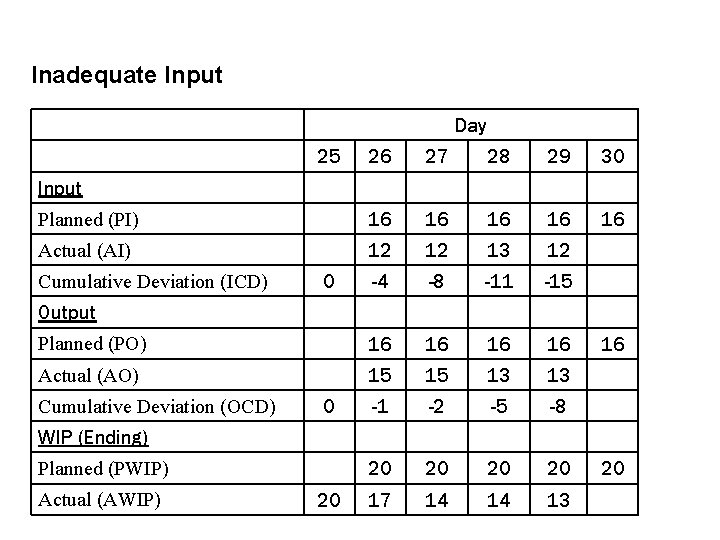
Inadequate Input Day 25 26 27 28 29 30 Planned (PI) 16 16 16 Actual (AI) 12 12 13 12 -4 -8 -11 -15 Planned (PO) 16 16 Actual (AO) 15 15 13 13 -1 -2 -5 -8 20 20 17 14 14 13 Input Cumulative Deviation (ICD) 0 Output Cumulative Deviation (OCD) 0 16 WIP (Ending) Planned (PWIP) Actual (AWIP) 20 20
- Slides: 19