Product Portfolio analysis A Level Business Name and

Product Portfolio analysis A Level Business

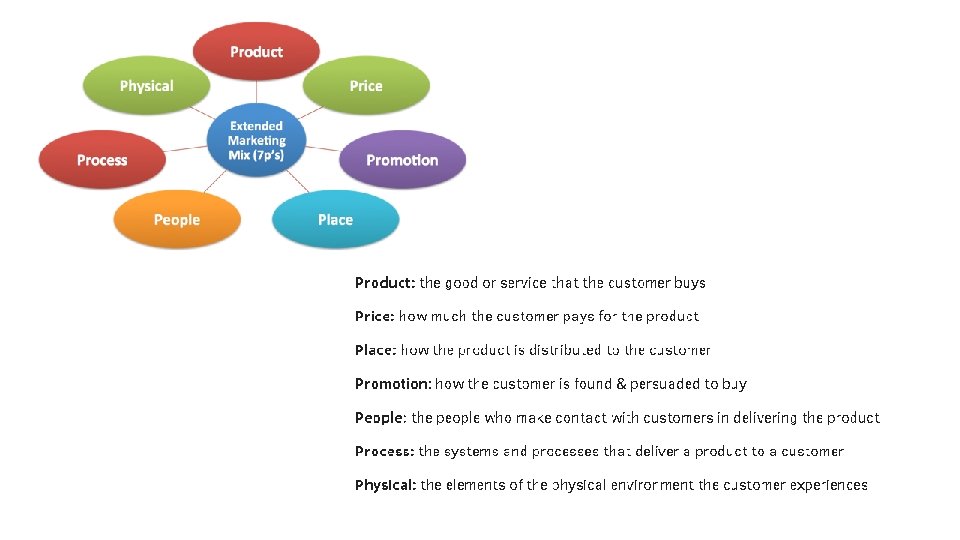
Name and define the 7 ps of the marketing mix Marketing Mix element (7 Ps) Definition Arrange yourselves in to the following groups 1. Basmila, Anustan, Shakur, Qaiser 2. Hashem, Liam, Junying 3. Nathan, Sachin, Phillip, Abdulrahman 4. Ravi, Zainab, Devante

Starter: How successful are these products? Arrange yourselves in to the following groups 1. Basmila, Anustan, Shakur, Qaiser 2. Hashem, Liam, Junying 3. Nathan, Sachin, Phillip, Abdulrahman 4. Ravi, Zainab, Devante

Aim and Objectives • Aim: to be able to analyse the product portfolio of a business using the Boston Matrix and the Product Life Cycle models • All students will draw and describe the Boston Matrix and the Product Life Cycle (Grade C) • Most students will successfully use both models to assess the product range of a business (Grade B) • Some students will evaluate the effectiveness of both models. (Grade A)

Starter: How successful are these products?

Discussion: How can we measure the success of these products? Market Share Market Growth Profitability

Stars are high growth products competing in markets where they are strong compared with the competition. Often Stars need heavy investment to sustain growth. Eventually growth will slow and, assuming they keep their market share, Stars will become Cash Cows The Boston Matrix Question marks are products with low market share operating in high growth markets. This suggests that they have potential, but may need substantial investment to grow market share at the expense of larger competitors. Management have to think hard about “Question Marks" - which ones should they invest in? Which ones should they allow to fail or shrink? High Cash cows are low-growth products with a high market share. These are mature, successful products with relatively little need for investment. They need to be managed for continued profit - so that they continue to generate the strong cash flows that the company needs for its Stars Low Unsurprisingly, the term “dogs" refers to products that have a low market share in unattractive, low-growth markets. Dogs may generate enough cash to break-even, but they are rarely, if ever, worth investing in. Dogs are usually sold or closed. High Low

The Boston Matrix ? /Problem Child Low High Star Cash Cow High Dog Low

Annual Sales Product Life Cycle

Discussion activity • In groups of three you will be given a product range and one of the Portfolio analysis tools. • You are to write on the model where you would put each of the products. • Once you have put the products on the model you need to answer the following two questions. 1. Explain which product you would recommend for further investment. 2. Explain which product you would recommend to be discontinued.

Samsung product range

Cadbury product range

Student feedback…

Discussion questions… • Why might companies such as Samsung and Cadbury use Product Portfolio analysis? • What benefits can you see for companies such as Samsung and Cadbury using both methods of Product Portfolio Analysis? • Which method of Product Portfolio analysis do you think is most relevant to Samsung? AO 2 Application AO 3 Analysis AO 4 Evaluation

Weaknesses of the Boston Matrix • Market growth is an inadequate measure of a market's attractiveness • Market share is an adequate measure of a products ability to generate cash • The focus on market share and market growth ignores issues such as developing a sustainable competitive advantages • The product life cycle varies

Weaknesses of the Product Life Cycle

Exam questions 1. Analyse the possible ways in which Product Portfolio analysis could influence Ford when deciding whether to invest heavily in developing a new model of car. (9 marks) 2. Ford has a large product portfolio and the life cycle of each model of car is around seven years. To what extent should Ford rely on the Boston Matrix when deciding to launch a new model? (20 marks)
- Slides: 18