Product Lifecycles Adoption Curve Presented by Bob Perry

Product Lifecycles & Adoption Curve Presented by Bob Perry

The Entrepreneur • One who: – organizes, – manages, and – assumes the risks of a business or enterprise • Risk Takers…Market Finders

The Marketing Mix Product Price C Customers Place Promo

Product The needs satisfying agent that is offered. • Convenience Goods – Staples – Impulse – Emergency • Shopping Goods – Homogeneous Goods – Heterogeneous Goods – Specialty Goods
 have a life cycle. Sometimes these life")
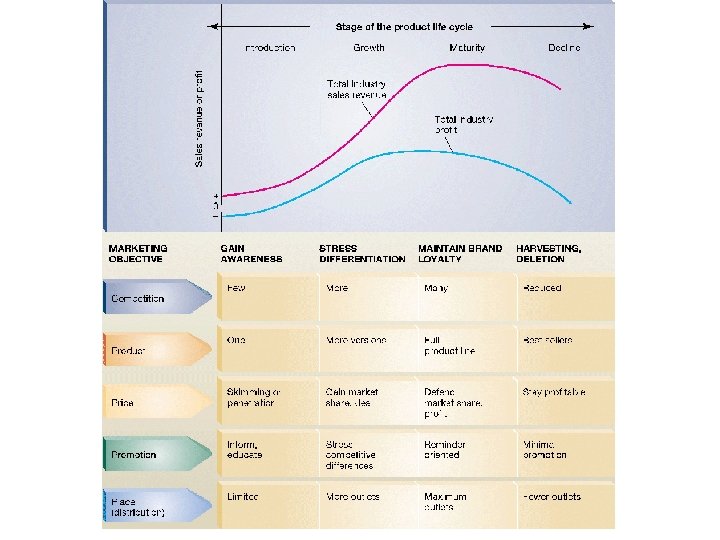
Product Life Cycle • Products (like customers) have a life cycle. Sometimes these life cycles can be short, but often the life cycle of a product can be longer. • Generally, a product will go through four stages during its life cycle: – Introduction/Development (Birth) – Growth – Maturity – Decline (Death)

Product Life Cycle Sales / Profits Development & Introduction Growth Maturity Decline

Introduction Stage Typical Characteristics • Sales grow slowly • Few if any established customers • Frequent product modification • Skimming price strategy • High failure rate • Profit minimal to negative Limited product models Little competition High Promotional Cost Focus is on creating awareness of product • Promotion strategies need to create demand • Intensive personal selling to distribution channel common • •

Growth Stage Typical Characteristics • Sales grow at an increasing rate • More customers are established • Profits increase as sales increase with more limited competition • Prices start falling as competitors are added • Large companies may acquire smaller, pioneering firms • Heavier brand advertising and focus on differentiation between brands • Economies of scale start to influence pricing

Maturity Stage Typical Characteristics • Sales continue to increase as the market place grows with adapters • Profit margins begin to shrink as more competitors enter market place • Product lines are widened or extended • Emphasis on product style more than just function • Marginal competitors begin to drop out of marketplace • Heavy promotion to maintain market share • Maturity stage can last for an extended period of time.

Decline Stage Typical Characteristics • Sales decline or • Some specialty firms disappear may stay in the market for a long time as • Sometimes new competition leaves the products with more marketplace. utility replace older products • Sales are generally low and the only way to • Falling demand forces survive is to find niches many and eventually for the product that can most competitors out of support higher pricing the marketplace

Adoption Curve • The Adoption Curve is adapted from a Everett Rogers Diffusion of Innovations and is used to show quickly differing consumer groups adopt new products • The Adoption Curve segments include: – Innovators (3% to 5%) – Early Adopters (10% to 15%) – Early Majority (about 34%) – Late Majority (about 34%) – Laggards (5% to 16%)

Adoption Curve is basically a statistical Bell Curve

Innovators • Do not rely on norms or past standards • First to adopt any new product, service, or idea. • Tend to be younger with higher social or economic status • Rely less on group norms and like to get their information from technical sources and experts. • Generally 3% to 5% of the population

Early Adopters • Relatively high is social status and often opinion leaders. • Typically younger, more mobile, and more creative than majority • Rely on input from innovators and technical sales

Early Majority • Early Majority consumers collect more information about the product and will weigh the pros and cons before they make a decision. • They listen to their opinion leaders and will rely on their groups’ opinions instead of forming them for themselves. • Early Majority group members are positioned between the earlier and later adopters and are deliberate in their data collection process.

Late Majority • Late Majority consumers adopt a new product mainly because their friends have all adopted them and they feel the need to conform. • This group is typically older and may have below average income and social status. • They listen to word-of-mouth communication over mass media, since they trust their friends more.

Laggards • Laggards do not rely on group norms and values, just like Innovators, which makes them difficult to reach. • Their past heavily influences their current decision process. • By the time Laggards adopt an innovation it has been possibly outmoded and replaced by something new and flashy. • They are extremely suspicious and feel alienated from a rapidly changing society. • This group probably bought their first black-and-white TV after color television was already dominantly used. • Marketers and advertisers tend to ignore Laggards since they are not motivated by advertising or personal selling and will only purchase a new product when they absolutely have to.

Adoption Curve Innovators Early Adopters Early Majority Percent of adoption 90% 50% 20% 5% Time Late Majority Laggards

Product Life Cycle Development & Introduction Growth Maturity Decline Moccasins Tablets Shoes Crocs Oculus Rift Microsoft Surface Pro MS Windows Atari Cassette players VCR Players Vinyl Records
- Slides: 20