Product Development Chapter 6 Introduction Product Development is


 = (Fixed Costs")


 ü Reliability ü Probability product performs intended function")
 MTTR (HR) A B")
 MTTR (HR) A B C 60 36 24 4.")


 ü Procedure for reducing number of parts ü Evaluate methods")
 ü A systematic approach for")
 Is there value added? ü Ratio of value / cost")


x = Fixed. B + (Var. B)x")


 movements ü")
 Initial block diagram 1 2 4 3 5")
 Initial block diagram 1 (b) Final block diagram 2 4 3")
 ü Used when quantitative data is not available ü Muther’s")


")


")


 ü Proximity of customers")


- Slides: 105
Product Development Chapter 6
Introduction Product Development is a process which generates concepts, designs, and plans to create services and goods to meet customer needs. 1. Analyze market to assess need 2. Design product 3. Design process for making product 4. Develop plan to market product 5. Develop plan for full-scale production 6. Analyze financial feasibility
Increasing Importance of Product Development 1. Customers demand greater product variety. 2. Customers are causing shorter product life cycles. 3. Improving technology is causing new products to be introduced 4. The impact of increasing product variety and shortening product life cycles is having a multiplicative effect on the need for product development. 5. Today, in order to be competitive, the firm may have to produce many different products with a life cycle of only five years or less. End of Life issues
Product Design ü Specifies materials ü Determines dimensions & tolerances ü Defines appearance ü Sets performance standards
Service Design ü Specifies what the customer is to experience ü Physical items ü Sensual benefits ü Psychological benefits
An Effective Design Process ü Matches product/service characteristics with customer needs ü Meets customer requirements in simplest, most cost-effective manner ü Reduces time to market - haste vs. speed to market ü Minimizes revisions - quality designed into the product
Stages in the Design Process ü Idea Generation — Product Concept - can you create your own market? What role does the voice of the customer play in idea generation? ü Feasibility Study — Performance Specifications ü Preliminary Design — Prototype - testing and redesign ü Final Design — Final Design Specifications ü Process Planning — Manufacturing Specifications - make to order/stock – assembly line?
Idea Generation ü Suppliers, distributors, salespersons ü Trade journals and other published material ü Warranty claims, customer complaints, failures ü Customer surveys, focus groups, interviews ü Field testing, trial users ü Research and development
More Idea Generators ü Perceptual Maps ü Visual comparison of customer perceptions ü Benchmarking ü Comparing product/service against best-in-class ü Reverse engineering ü Dismantling competitor’s product to improve your own product
Perceptual Map of Breakfast Cereals GOOD TASTE LOW NUTRITION HIGH NUTRITION BAD TASTE
Perceptual Map of Breakfast Cereals GOOD TASTE Cocoa Puffs LOW NUTRITION HIGH NUTRITION Rice Krispies Cheerios Wheaties BAD TASTE © Russell and Taylor, Prentice Hall, 2004 Shredded Wheat
Perceptual Map of Breakfast Cereals GOOD TASTE How do I get here? Cocoa Puffs LOW NUTRITION HIGH NUTRITION Rice Krispies Cheerios Wheaties BAD TASTE © Russell and Taylor, Prentice Hall, 2004 Shredded Wheat
Feasibility Study ü Market Analysis Market Segmentation ü Economic Analysis ü Technical / Strategic Analysis ü Performance Specifications ü Risk Analysis
Economic Analysis • Can we produce it at a volume to make a profit? • If not, why produce? • How many do we have to make to break even?
Break Even Analysis Total Costs = Total Revenues (Volume x Price) = (Fixed Costs + Variable Costs) Profit = (Total Revenue – Total Costs) Fixed Costs B/E Point = Sales Price – Variable Costs
Example Fixed Costs = $2000 Variable Costs = $5/item Sales Price = $10/item Fixed Costs ($2000) B/E PT = Sales Price ($10) – Variable Costs ($5) B/E point = ($2000/$5) 400 items
Risk Analysis 1. Identify the Hazards 2. Assess hazards to determine risks. 3. Develop controls and make risk decisions. 4. Implement controls. 5. Supervise and evaluate.
Preliminary Design How will it look? ü Create form & functional design ü Build prototype ü Test prototype ü Revise prototype ü Retest
Functional Design (How the Product Performs) ü Reliability ü Probability product performs intended function for specified length of time ü Maintainability ü Ease and/or cost or maintaining/repairing product
System Availability, SA = MTBF + MTTR PROVIDER MTBF (HR) MTTR (HR) A B C 60 36 24 4. 0 2. 0 1. 0
System Availability PROVIDER MTBF (HR) MTTR (HR) A B C 60 36 24 4. 0 2. 0 1. 0 SAA = 60 / (60 + 4) =. 9375 or 93. 75% SAB = 36 / (36 + 2) =. 9473 or 94. 73% SAC = 24 / (24 + 1) =. 96 or 96%
Production Design ü Part of the preliminary design phase ü Simplification ü Standardization ü Modularity
Final Design & Process Plans ü Produce detailed drawings & specifications ü Create workable instructions for manufacture ü Select tooling & equipment ü Prepare job descriptions ü Determine operation & assembly order ü Program automated machines
Improving the Design Process ü Design teams ü Concurrent design ü Design for manufacture & assembly ü Design to prevent failures and ensure value ü Design for environment ü Measure design quality ü Utilize quality function deployment ü Design for robustness ü Engage in collaborative design
Design Teams Preferred solution = cross functional teams ü Marketing, manufacturing, engineering ü Suppliers, dealers, customers ü Lawyers, accountants, insurance companies
Concurrent Design ü Improves quality of early design decisions ü Decentralized - suppliers complete detailed design ü Incorporates production process ü Scheduling and management can be complex as tasks are done in parallel ü include the customer in the process!!
Design for Manufacture and Assembly ü Design a product for easy & economical production ü Incorporate production design early in the design phase ü Improves quality and reduces costs ü Shortens time to design and manufacture ü also known as Design for Six Sigma
Design for Six Sigma • Define – the goals of the design activity • Measure – customer input to determine what is critical to quality from the customers’ perspective – what are customer delighters? What aspects are critical to quality? • Analyze – innovative concepts for products and services to create value for the customer • Design – new processes, products, and services to deliver customer value • Verify – new systems perform as expected
DFM Guidelines 1. Minimize the number of parts, tools, fasteners, and assemblies 2. Use standard parts and repeatable processes 3. Modular design 4. Design for ease of assembly, minimal handling 5. Allow for efficient testing and parts replacement
Design for Assembly (DFA) ü Procedure for reducing number of parts ü Evaluate methods for assembly ü Determine assembly sequence
Design Review ü Failure Mode and Effects Analysis (FMEA) ü A systematic approach for analyzing causes & effects of failures ü Prioritizes failures ü Attempts to eliminate causes
Value Analysis (Value Engineering) Is there value added? ü Ratio of value / cost ü Assessment of value : 1. Can we do without it? 2. Does it do more than is required? 3. Does it cost more than it is worth? 4. Can something else do a better job 5. Can it be made by less costly method, tools, material? 6. Can it be made cheaper, better or faster by someone else? Should we contract it out?
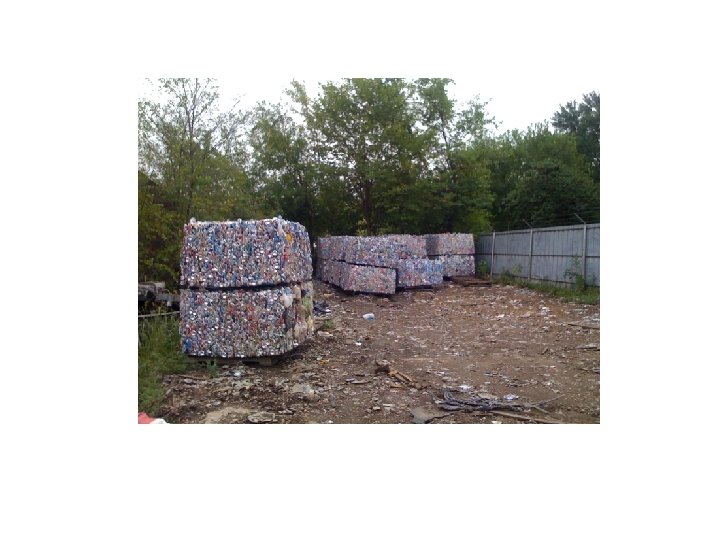
Design for Environment ü Design from recycled material ü Use materials which can be recycled ü Design for ease of repair ü Minimize packaging ü Minimize material & energy used during manufacture, consumption & disposal ü green laws in Europe -
Design for Robustness ü Product can fail due to poor design quality ü Products subjected to many conditions ü Robust design studies üControllable factors - under designer’s control üUncontrollable factors - from user or environment ü Designs products for consistent performance
A Well-Designed Service System is ü Consistent with firm’s strategic focus ü Customer friendly ü Easy to sustain ü Effectively linked between front & back office ü Cost effective ü Visible to customer
CHAPTER 8 Process Selection affects the outcome – in production or sports: 38
What is Process Selection? • Series of decisions that includes technical/engineering issues and volume/scale issues • Technical/engineering: basic methods that produce a good or service • Scale: how many or how much to produce; how many to serve at a time • Trade off analysis between capacity and costs 39
Why process selection is critical • Dell – from make/assemble to order in Texas to make/assemble to stock off shore • Does this work? • Break even analysis may depend on process costs • Which process gives the lowest costs – assumption? 40
The Point of Indifference Comparing Two Processes • What is it? • Who cares? • How do you calculate it? 41
Comparing Two Processes • Process A • Fixed = $2000 • Variable = $5/item • Process B • Fixed = $11000 • Variable = $2/item
Comparing the Processes Fixed. A + (Var. A)x = Fixed. B + (Var. B)x 2000 + 5 x = 11, 000 + 2 x 3 x = 9000 X = 3000 So what?
Trade off analysis • Customer demanded quantity drives the trade off analysis and decision process • Example: → retail stocks at Christmas 2008 and 2009 season - goal save money by stocking less → At what point do you lose sales due to lower stockage levels? 44
Process Design/Selection/Capacity • Have to be simultaneous operations – some texts suggest sequential steps • Decision process has to be customer based → what should it be? → how many should be produced/how many are we capable of producing? → how should it be produced? 45
Process Strategy - Defines • • Capital intensity Process flexibility Vertical integration Customer involvement 46
Goal of Process Design • Reduce lead time for product to the customer • Is it best to be the first to market and establish the market? • Or, be the follower and let someone else do the R&D/design/risk? 47
Problems with Managing Large, Unfocused Operations • Growing facilities add more levels of management and make coordination and control difficult. • New products are added to the facility as customers demand greater product variety. • Hidden overhead costs increase as managers add staff to deal with increased complexity. 48
Process Planning ü Make-or-buy decisions ü Process selection ü Specific equipment selection ü Process plans ü Process analysis 49
Make-or-Buy Decisions 1. 2. 3. 4. 5. 6. Cost Capacity Quality Speed Reliability Expertise What about Proprietary Information? Barrier to Make-or-Buy? 50
Source: Aberdeen Research, “Low-Cost Country Sourcing Success Strategies: Maximizing and Sustaining the Next Big Supply Savings Opportunity, ” Jun 2005 51
Process Plans ü Blueprints ü Bill of material Flat or multiple layers part or assembly ü Assembly chart / product structure diagram ü Operations process chart - list of operations involved in assembly ü Routing sheet - sequence of events 52
Process Analysis ü The systematic examination of all aspects of a process to improve its operation ü ü Faster More efficient Less costly More responsive ü Basic tools ü Process flowchart ü Process diagrams ü Process maps 53
Operations Process Chart Part name Crevice Tool Part No. 52074 Usage Hand-Vac Assembly No. 520 Oper. No. Description Dept. Machine/Tools Time 10 Pour in plastic bits 041 Injection molding 2 min 20 Insert mold 041 #076 2 min 30 Check settings & start machine 041 113, 67, 650 20 min 40 Collect parts & lay flat 051 Plastics finishing 10 min 50 Remove & clean mold 042 Parts washer 15 min 60 Break off rough edges 051 Plastics finishing 10 min 54
Process Analysis – What processes feed other processes? 55
Process Flowchart Description of process 1 Unload apples from truck 2 Move to inspection station 3 Weigh, inspect, sort 4 Move to storage 5 Wait until needed 6 Move to peeler 7 Apples peeled and cored 15 8 Soak in water until needed 20 9 Place in conveyor 5 10 Move to mixing area 11 Weigh, inspect, sort Page 1 0 f 3 Total Distance (feet) Location: Graves Mountain Process: Apple Sauce Time (min) Operation Transport Inspect Delay Storage Step Date: 9 -30 -02 Analyst: TLR 20 100 ft 30 50 ft 360 20 ft 30 480 190 ft 56
Principles for Redesigning Processes • • • Walk the Process! Remove waste, simplify, consolidate Link processes to create value Let the swiftest and most capable execute Capture information digitally, data mine, and use information to improve operations 57
Principles for Redesigning Processes • • • Provide visibility through information about process status Fit the process with sensors and feedback loops Add analytic capabilities Connect, collect and create knowledge around the process Personalize the process 58
Techniques for Generating Innovative Ideas ü ü Vary entry point to a problem Draw analogies Change your perspective Use attribute brainstorming 59
RFID Active Tags Always on Battery powered Can be read from up to 300 ft • US Army • Savi Tags • • • Passive Tags Small Must be activated May be turned off England California Rolex 60
61
62
Robotics ü Programmable manipulators ü Follow specified path ü Better than humans with respect to ü Hostile environments ü Long hours ü Consistency ü Adoption has been slowed by ineffective integration and adaptation of systems ü Welding at Harley Davidson Plant Questions? 63
Facilities
Objectives of Facility Layout ü Eliminate waste or redundant movement ü Facilitate the entry, exit, and placement of material, products, or people ü Incorporate safety and security measures ü Promote product and service quality ü Encourage proper maintenance activities ü Provide a visual control of operations or activities ü Provide flexibility to adapt to changing conditions ü Increase capacity
Objectives of Facility Layout ü Minimize material handling costs ü Utilize space efficiently ü Utilize labor efficiently ü Eliminate bottlenecks ü Facilitate communication and interaction between workers, between workers and their supervisors, or between workers and customers ü Reduce manufacturing cycle time or customer service time
Basic Types of Layouts ü Process Layout ü Machines grouped by process they perform ü Product Layout ü Linear arrangement of workstations to produce a specific product ü Fixed Position Layout ü Used in projects where the product cannot be moved
Manufacturing Process Layout Lathe Department L L L L L Milling Department Drilling Department M M D D D D G G G P Grinding Department Receiving and Shipping Painting Department A A Assembly A
A Product Layout In Out
Fixed-Position Layouts ü Typical of projects ü Equipment, workers, materials, other resources brought to the site ü Highly skilled labor ü Often low fixed ü Typically high variable costs
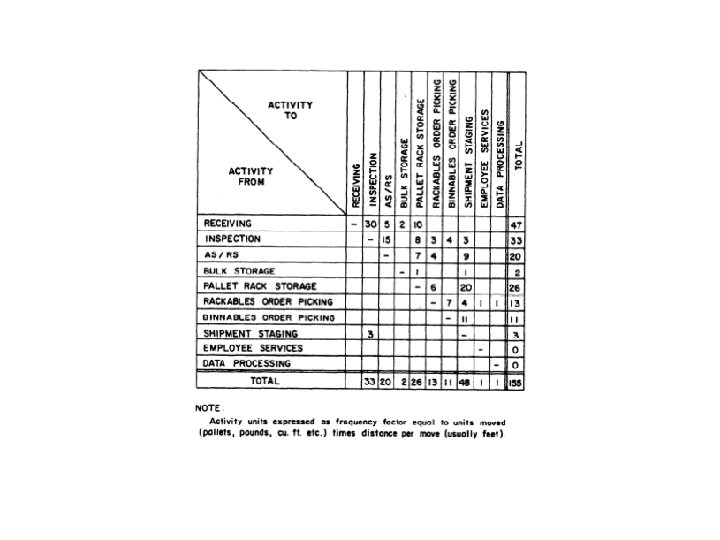
Designing Process Layouts ü Minimize material handling costs ü Block Diagramming ü Minimize nonadjacent loads ü Use when quantitative data is available ü Relationship Diagramming ü Based on location preference between areas ü Use when quantitative data is not available
Block Diagramming ü Create load summary chart ü Calculate composite (two way) movements ü Develop trial layouts minimizing number of nonadjacent loads
Block Diagrams (a) Initial block diagram 1 2 4 3 5
Block Diagrams (a) Initial block diagram 1 (b) Final block diagram 2 4 3 5 1 3 2 4 5
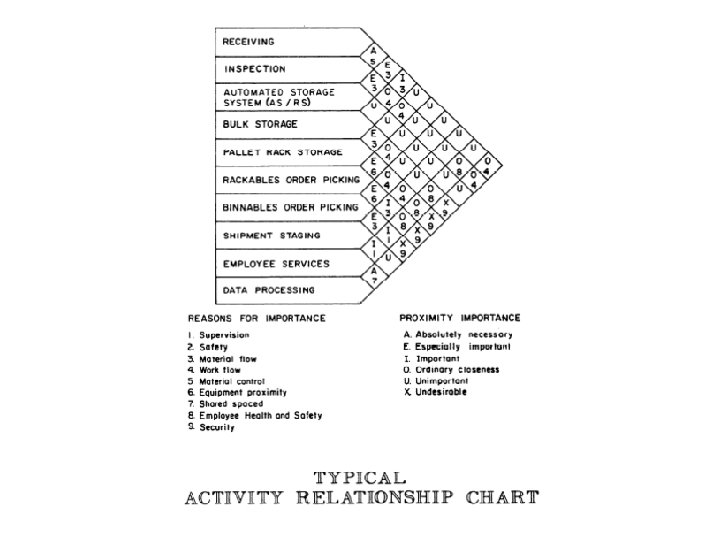
Relationship Diagramming (Murther’s Grid) ü Used when quantitative data is not available ü Muther’s grid displays preferences ü Denote location preferences with weighted lines
Relationship Diagramming Example Production Offices Stockroom Shipping and receiving Locker room Toolroom
Relationship Diagramming Example A E Production Offices Stockroom Shipping and receiving Locker room Toolroom O U A U O A O U O I X O E U I O U X A Absolutely necessary Especially important Important Okay Unimportant Undesirable
Relationship Diagramming Example A E Production Offices Stockroom Shipping and receiving Locker room Toolroom O U A U O A O U O I X O E U I O U X A Absolutely necessary Especially important Important Okay Unimportant Undesirable
Relationship Diagramming Example 1 2 Production Offices Stockroom Shipping and receiving Locker room Toolroom 4 5 1 5 6 1 4 5 4 3 6 4 2 5 3 4 5 6 1 Absolutely necessary Especially important Important Okay Unimportant Undesirable
Service Layouts ü Usually process layouts due to customers needs ü Minimize flow of customers or paperwork ü Retailing tries to maximize customer exposure to products ü Computer programs consider shelf space, demand, profitability ü Layouts must be aesthetically pleasing
Designing Product Layouts ü Product layouts or assembly lines ü Develop precedence diagram of tasks ü Jobs divided into work elements ü Assign work elements to workstations ü Try to balance the amount work of each workstation
Line Balancing ü Precedence diagram ü Network showing order of tasks and restrictions (constraints) on their performance ü Cycle time ü Maximum time product spends at any one workstation
Hybrid Layouts ü Cellular layouts ü Group machines into machining cells ü Flexible manufacturing systems ü Automated machining & material handling systems ü Mixed-model assembly lines ü Produce variety of models on one line
Cellular Layouts 1. Identify families of parts with similar flow paths 2. Group machines into cells based on part families 3. Arrange cells so material movement is minimized 4. Locate large shared machines at point of use
Advantages Of Cellular Layouts ü Reduced material handling and transit time ü Reduced setup time ü Reduced work-in-process inventory ü Better use of human resources ü Easier to control - visibility ü Easier to automate
Disadvantages Of Cellular Layouts ü Inadequate part families ü Poorly balanced cells ü Expanded training and scheduling of workers ü Increased capital investment
Paths of three workers moving within cell Material movement Key: S L HM VM G = Saw = Lathe = Horizontal milling machine = Vertical milling machine = Grinder Direction of part movement within cell Manufacturing Cell HM VM Worker 3 VM L Worker 2 G L Final inspection Finished part S Worker 1 In Out
Mixed Model Assembly Lines ü Produce multiple models in any order on one assembly line ü Harley, Opel ü Issues in mixed model lines ü Line balancing ü U-shaped line ü Flexible workforce ü Model sequencing
Facility Location Models
Types Of Facilities ü Heavy manufacturing üAuto plants, steel mills, chemical plants ü Light industry üSmall components mfg, assembly ü Warehouse & distribution centers ü Retail & service
Factors in Heavy Manufacturing Location ü ü ü Construction costs Land costs Raw material and finished goods shipment modes Proximity to raw materials Utilities Labor availability
Factors in Light Industry Location ü Construction costs ü Land costs ü Easily accessible geographic region ü Education & training capabilities
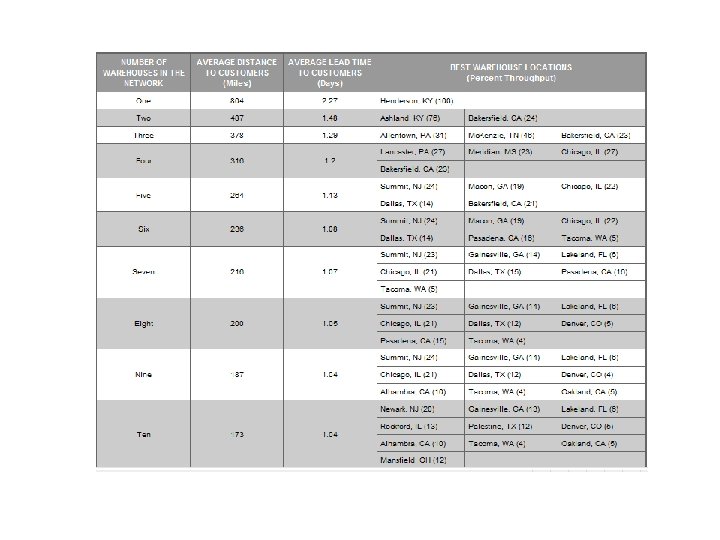
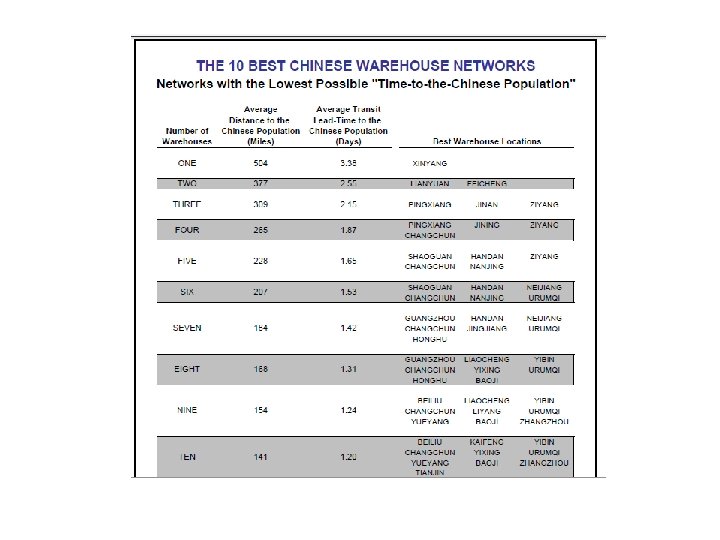
Factors in Warehouse Location ü Transportation costs ü Proximity to markets (Customers)
Warehouse Size Considerations • • • Customer service level layout # of products (Stock Keeping Units - SKUs) customer base size of products racks/shelving demand variability MHE requirements/aisle size regulations - CAL OSHA - earthquake; safety; fire
Factors in Retail Location ü Proximity to customers ü Ease of customer entry and exit ü Location is everything
Global Location Factors ü ü ü ü Government stability Government regulations Political and economic systems Economic stability and growth Exchange rates Culture Climate Export import regulations, duties and tariffs ü Raw material availability ü Number and proximity of suppliers ü Transportation and distribution system ü Labor cost and education ü Available technology ü Commercial travel ü Technical expertise ü Cross-border trade regulations ü Group trade agreements
Regional Location Factors ü Labor (availability, education, cost and unions) ü Proximity of customers ü Number of customers ü Construction/leasing costs ü Land costs ü Modes and quality of transportation ü Transportation costs ü Incentive packages ü Governmental regulations ü Environmental regulations ü Raw material availability ü Commercial travel ü Climate ü Infrastructure ü Quality of life
Regional Location Factors ü ü ü Community government Local business regulations Government services Business climate Community services Taxes ü ü ü Availability of sites Financial Services Community inducements Proximity of suppliers Education system
Site Location Factors ü Customer base ü Construction/ leasing cost ü Land cost ü Site size ü Transportation ü Utilities ü Zoning restrictions ü Traffic ü Safety/security ü Competition ü Area business climate ü Income level
Location Incentives ü ü ü Tax credits Wal-Mart in Wyandotte Relaxed government regulation Job training Infrastructure improvement Money
Center-of-Gravity Technique ü Locate facility at center of geographic area ü Based on weight and distance traveled ü Establish grid-map of area ü Identify coordinates and weights shipped for each location