PROCRUSTES SHAPE ANALYSIS VERIFICATION TOOL Steve Lack 1


 and convective")
 with convective/ stratiform mask (right)")


 through different options available in")
- Slides: 15
PROCRUSTES SHAPE ANALYSIS VERIFICATION TOOL Steve Lack 1, Neil Fox 2, George Limpert 2, and Brice Lambi 1 1 NOAA ESRL-Forecast Verification Section 2 University of Missouri-Columbia
Review � Micheas et al. 2007 � Landmark based method (matches points along identified cell boundary) � Identification of cells using minimum threshold of intensity and size � Matches objects based on minimizing centroid location or minimizing error based on fit � Can be run on an ensemble product � Penalty based on sum of squares error of matched cells � MATLAB® code
Updates � Cell Identification � Added a component to enable the use of identifying cells based on FFT at multiple scales � Size threshold may still be used for binary images � � � Matching--full attribute matching scheme, tunable False alarm identification and penalties Recode into C++, build interactive Java webpage
Cell Identification � Spectral Analysis � Spectral analysis is performed using the Fourier Transform � Instead of working in a spatial (x, y) domain, some work is done in a frequency (u, v) domain � As u and v increase, structure size decreases � Therefore by selecting appropriate u and v values, some of the work of identifying structures at multiple scales is already done � Use IFFT to get back into the spatial domain
RADAR Application � � Can easily breakdown image into stratiform (low frequency) and convective (high frequency) components Breakdown convective image into multiple spatial scales (cells, segments, and clusters) Larger clusters are used for most of the verification exercises May be adapted for precip rates or amounts.
Classification � Original Image (left) with convective/ stratiform mask (right)
Multi-scale Breakdown
Matching � � Get away from centroid matching or minimum shape matching Combine the two and include other parameters: size, rotation, intensity Sum of squares penalty function of all attributes becomes a matching tool Can tune the parameters to put more weight on displacement or intensity, etc
Matching – distance vs. Procrustes 9
Fit Comparison 10
Fit Comparison 11
Matching Tags � Once the code finds the correct matches and assesses penalties, cell pairs are tagged � � � Hits Misses False Alarms Multiple forecast cells can be matched to a single truth (hits and false alarms) Truth cells can be matched to the same forecast cell (hits and misses) False alarms penalties can be assessed in a total domain penalty � � Allows for higher penalties for false alarms with high displacement Lower penalties for low displacement (tight cluster of cells in forecast with lower count of truth cells)
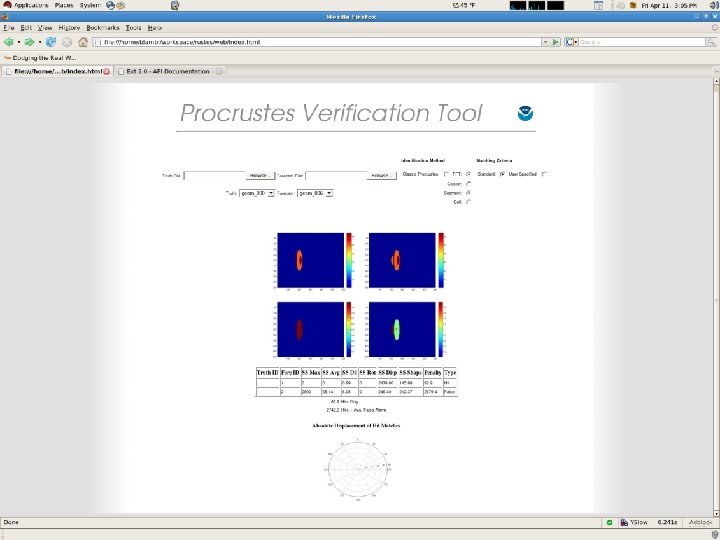
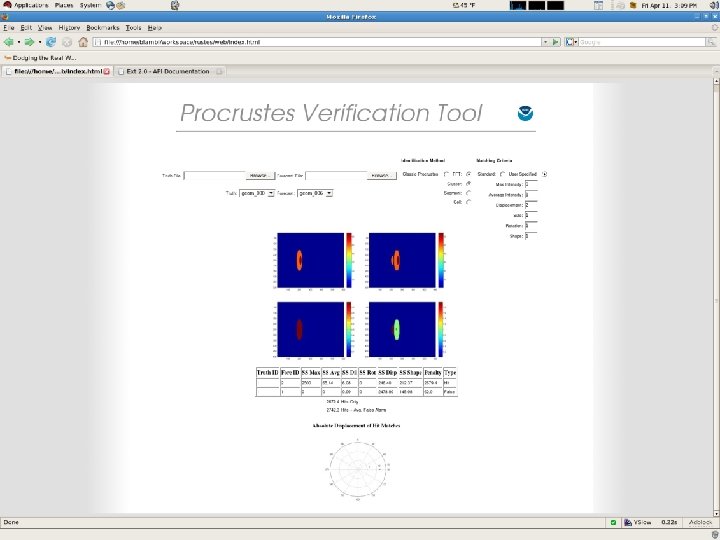
Interface � � Select use cases (geometric test data) through different options available in the Procrustes scheme Retains a classic version (min. size, min. intensity threshold) and new FFT version Customize matching criteria Display SS error results and absolute displacement vector for now