Processes and facility selection OPERATIONS MANAGEMENT DR RON


 Repetitive (cars, motorcycles) Medium Product Focus")
 Low volume, high variety, “do it all” “Job shop” environment")


 60 30 D A B 60")
 A&B candidates 60 30 D A B 60")


- Slides: 44
Processes and facility selection OPERATIONS MANAGEMENT DR. RON LEMBKE
Process Strategies Price / Quality / Speed? Decoupling Point ◦ Make to Stock – ready on the shelf – Breyer’s ◦ Assemble to Order – parts waiting for an order – DQ ◦ Make to Order – Raw Materials waiting – Cold Stone MTS ATO MTO Design Produce Assemble Deliver
Make to Stock Processing Materials Stock Finished Goods Storable products, most efficient processes, high-volume production Customers perceive delivery as instantaneous Harder to do with services: bus system, airline flights?
Make to Order Stock Processing Finished Good Materials Demand is known. Longer Lead Time. No stockpile of finished goods. Delivered directly to consumer Customizable product, or where Freshness is important Services more likely MTO. Costs higher.
Assemble to Order Stock Materials Processing Stock Processing WIP subassemblies Combination of MTS, MTO, benefits of both Offer variety to customer, but quick delivery Efficiencies of MTS, work ahead on components during slow times Pre-cooked burgers, French fries Finished Good
Remanufacturing Re-use components Can be ATO?
Process Strategy Variety High Process Focus (job shops) Repetitive (cars, motorcycles) Medium Product Focus (steel, glass) Low Medium High Volume
Process Focus (Job Shop) Low volume, high variety, “do it all” “Job shop” environment (e. g. Kinko’s) High amount of flexibility Each job is different Relatively high cost per unit Very high flexibility
Process Selection / Evolution Products tend to move through the four stages over life cycle. Unit costs decrease as standardization increases, and production increases. Flexibility decreases as volume, standardization increase
Process Strategy Variety High Medium project Workcenter Manufacturing Cell Assembly Line Continuous Process Low Medium High Volume
Process Flow Structures Job Shop - low standardization, every order is a different product, new design Batch Shop - Stable line of products, produced in batches Assembly Line - Discrete parts moving from workstation to workstation Continuous Flow - Undifferentiated flow of product (beer, paper, etc. )
Assembly-Line Balancing Situation: Assembly-line production. Many tasks must be performed, and the sequence is flexible Parts at each station same time Tasks take different amounts of time How to give everyone enough, but not too much work for the limited time.
Chipotle Production Line. Experience Warm Tortill a Beans & Rice Meat 29 Salsa 29 Cheese/ Lettuce 29 44 29 Order 44 29 Sour Cream /Guacamole Wrap Tortilla 67 94 Cashier
Chipotle Production Line. Experience Warm Tortill a Beans & Rice Meat 29 Salsa 29 Cheese/ Lettuce 29 44 29 Order 44 29 174 Sour Cream /Guacamole 125 CT = 174 sec TH = 60*60 sec/hr = 20. 7/hr 174 sec Wrap Tortilla 67 94 Cashier
Chipotle Production Line. Experience Warm Tortill a Meat Beans & Rice 29 Salsa 29 Cheese/ Lettuce 29 44 29 145 29 Sour Cream /Guacamole 154 Order 44 Wrap Tortilla 67 CT = 154 sec TH = 60*60 sec/hr = 23. 4/hr 154 sec Increase (23. 4 -20. 7)/20. 7 = 13% 94 Cashier
Chipotle Production Line. Efficient Probability Beans & Rice Warm Tortilla 44 29 73 Meat Salsa 29 29 Cheese/ Lettuce Sour Cream /Guacamole 29 87 29 73 Order 44 CT = 94 sec TH = 60*60 sec/hr = 38. 3/hr 154 sec Wrap 67 Tortilla 94 Cashier
Target Cycle Times – 4 Stations B&R 44 Ord 44 SC&G 29 125 CT = 125 Wrap 67 73 B&R 44 Tlla 29 Ch& L 29 102 Tlla 29 Ord 44 Sls 29 Mt 29 Pay 94 Mt 29 Sls 29 Ch& L 29 87 SC&G 29 96 117 CT = 117 Wrap 67 Pay 94
Target Cycle Times- 5 Stations Mt 29 B&R 44 Tlla 29 Ord 44 73 Sls 29 Ch& L 29 SC&G 29 87 67 73 CT = 94 Wrap 67 Pay 94
Cycle Time The more units you want to produce per hour, the less time a part can spend at each station. Cycle time = time spent at each spot CT = Production Time in each day Required output per day (in units) D =400 units, OT = 12 hrs – 30 min setup, 90 min delivery = 10 hrs CT = 10 hrs/400 units = 0. 025 hrs/unit 0. 025 hrs * 60 min/hr = 1. 5 min = 90 sec = OT D
Number of Workstations Given required cycle time, find out theoretical minimum number of stations Nt = Sum of task times (T) Cycle Time (C) Theoretical Minimum # Workstations = ST / CT = 325/90 = 3. 611 = 4 (Always round up)
Scenario 1 c- Precedence Diagram (times in seconds) 60 30 D A B 60 I C E 45 20 F 30 H G 10 10 60
Scenario 1 c (times in seconds) A&B candidates 60 30 D A B 60 B is longer, so it gets chosen C can’t be considered yet, A has to be done before C I C E 45 20 F 30 H G 10 10 60
Scenario 1 c A&C one station, C next candidate, AB 90 sec 60 30 D A B 60 C start of new position D, E, F next possibilities D too big to add with C F can work, added to C I C E 45 20 F 30 H G 10 10 60
Scenario 1 c C&F now combined D, E, G eligible D, E too big, G will fit 60 30 D A B 60 H now eligible, but too big I C E 45 20 F 30 H G 10 10 60
Scenario 1 c CFG combined 30 D A B 60 D, E, H eligible D biggest I not eligible until E & H done E biggest H can be added 60 I C E 45 20 F 30 H G 10 10 60
Scenario 1 c DEH combined I is finally eligible, But can’t be added to DEH 60 30 D A B 60 I C E 45 20 F 30 H G 10 10 60
Scenario 1 c I is finally eligible, But can’t be added to DEH Summary 60 30 D A C B 60 45 I E 20 F 30 G 10 H 10 60 4 stations Longest time 90 sec
60 30 Scenario 1 d D A C B 45 60 I E 20 F G 10 30 A, B C, F, G D, E, H Efficiency = ST / (CT * N) = 325 / (4*90) = 90. 3% Balance Delay = 1 – 0. 903 = 0. 0972 = 10% Theoretical Minimum # Workstations = ST / CT = 325/90 = 3. 611 = 4 (Always round up) I H 10 60
Precedence Requirements A 20 C B 5 D 5 G 10 Why not put J with F&G? E 15 I 8 H 12 F 12 3 AB CDE HI FG J J 7
Legal arrangements. CT = maximum of A 20 C 5 B G 5 D 10 workstation times E 15 I 8 H 12 F 3 J 7 12 AC|BD|EG|FH|IJ = max(25, 15, 23, 15, 19) = 25 ABG|CDE|FHI|J = max(40, 23, 27, 7) = 40 C|ADB|FG|EHI|J = max(5, 35, 18, 32, 7) = 35 AC BD EG FH IJ
Handling Long Tasks Long tasks make it hard to get efficient combinations. Consider splitting tasks, if physically possible. If not: ◦ Parallel workstations ◦ use skilled (faster) worker to speed up
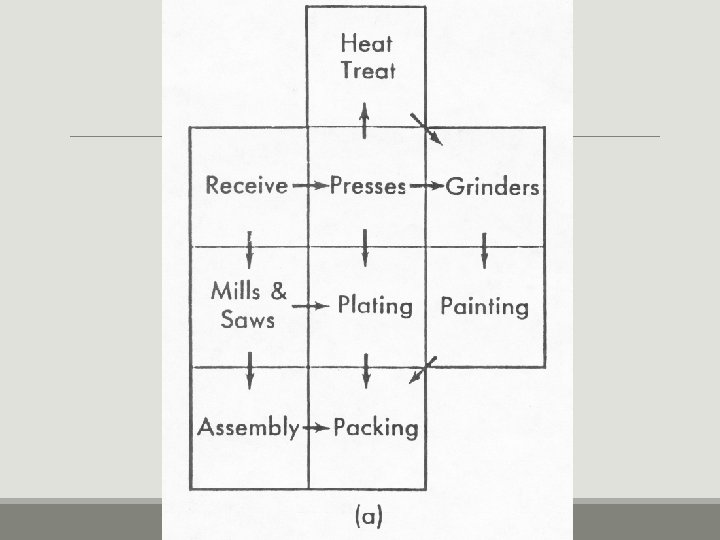
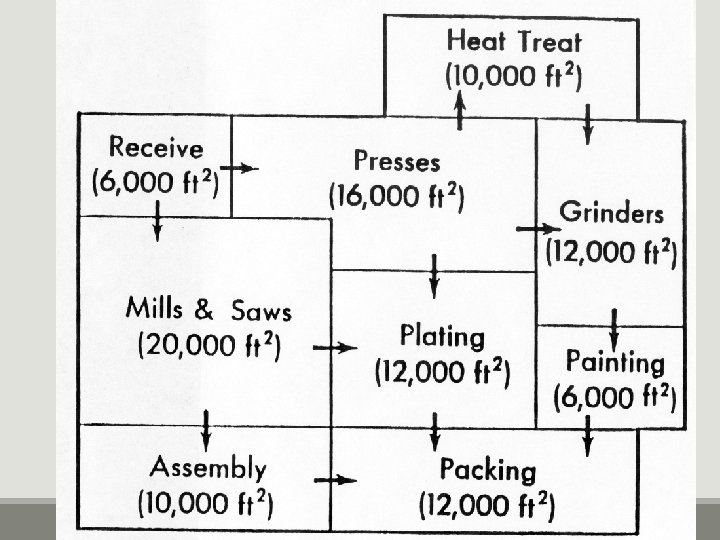
Process Layout + Allows specialization - focus on one skill + Allows economies of scale - worker can watch several machines at once + High level of product flexibility -- Encourages large lot sizes -- Difficult to incorporate into JIT -- Makes cross-training difficult
Process Layout 8! = 8 * 7 * 6 * 5 * 4 * 3 *2 * 1 = 40, 320 possible arrangements Rectilinear (taxi-cab) distances Minimize load-distance total
Process Example High Rack 1 10 HR 2, 10 HR 3, 30 Staging High Rack 2 10 HR 1, 10 HR 3, 30 Staging High Rack 3 10 HR 1, 10 HR 2, 30 Staging Area 30 HR 1, 30 HR 2, 30 HR 3, 50 Tent, 50 Soft Tent Storage 50 Staging Soft Goods Storage 50 Staging Administrative Office none Tool Crib none
Process Example High Rack 1 High Rack 2 High Rack 3 Admin Offices Tents Staging Soft Goods Tool Crib
Process Example Cost 10*2+10+10+30*2+30 + 50 = 290 10 High Rack 1 10 Tents 50 10 30 30 High Rack 2 Staging High Rack 3 Admin Offices 30 50 Soft Goods Tool Crib
Rating A E I O U Z REL Diagram High Rack Storage 1 High Rack Storage 2 High Rack Storage 3 Staging Area Tent Storage Soft Goods Storage Administrative Office Tool Crib A A E A I U X A E U U X A U X U Points 100 50 25 5 0 -100 X U U
REL chart HR 1 A HR 2 A HR 3 U E U Tent A Staging A Soft X Office X A Tools 5 A (100) + E(50) + 2 X(-100) = 350
REL chart HR 1 A HR 3 A HR 2 U Tent E U Office A E Staging A Tools A 5 A (100) + E(50) = 600 U Soft
Fixed-Position Design is for stationary project Workers & equipment come to site ◦ ◦ Limited space at site Changing material needs Ship building (18, 400 TEU, 2014) Highway construction
Summary Production Process selection very important ◦ Strategic considerations – decoupling ◦ Volume / Variety tradeoffs ◦ Maturation of processes over life cycle Little’s Law: FT = TH * INV