Process Mapping Financial Aid Processes for Greater Efficiency


")


- Slides: 23
Process Mapping Financial Aid Processes for Greater Efficiency DREAM 2013 FEBRUARY 6, 2013
About Broward College Founded in 1960 • 2 nd Largest of 28 Colleges in the Florida College System • Achieving the Dream Leader College • 3 Campuses/ 8 Centers
Enrollment & Demographics • Annual Headcount 67, 000 • credit and non-credit • Certificates, Associates and Workforce Demand Baccalaureate Degree • A diverse student population
College Readiness Fall 2012 SUBJECT AREA COLLEGE READY DEVELOPMENTAL MATH 45% 55% ENGLISH 72% 28% READING 72% 28%
Financial Aid Process Mapping
Financial Aid Volume Total Aid Disbursed $180, 000 $160, 000 $140, 000 $120, 000 $100, 000 $80, 000 $60, 000 $40, 000 $20, 000 $0 1999 2000 2001 2002 2003 2004 2005 2006 2007 2008 2009 2010 2011 2012
Financial Aid Student Profile • 89% of BC degree-seeking students received some type of financial aid • 29, 876 (65%) of aid recipients had family income qualifying them for Federal Pell Grant
EFC Breakdown # Students 30000 25000 20000 0 - 2800 15000 2801 -5274 + 10000 5000 0 2008 2009 2010 2011 2012
Why Process Mapping? Reached our tipping point – Increased enrollment – Increased Financial Aid applicants and recipients – Numerous regulatory changes – Complaints about customer service related to many processes
Process Mapped T 4 2 R Awardin g Proces s SA P cess o r np o i t a A c ppli s oan Process p i h L rs a l o Sch. E ligibility Determ ination Hiring y d u t S Work Disbu rsem ent iation l i c n o c Re G O A L
Process Mapping • Outside Facilitator-Lead Sessions • Multiple Stakeholders involved – – – Students Financial Aid Staff Student Accounts Registrar Advisement Human Resources
Remap Priorities • • • Application process SAP R 2 T 4 Loan Process Work-study Hiring
Re-Mapped Application Process and Results 32% Students Awarded 2011 -12 - as of 7/15/11: 9, 303 2012 -13 – as of 6/1/12: 12, 255 Awarded 6 weeks earlier App Status Complete 11% ISIRs Appointments As of May 31, 2012 Continuing Students: 16, 772 New Students: 651 Prior to June 1, 2011: 35, 263 Prior to June 1, 2012: 39, 307 March – May 2012: 4, 687 students
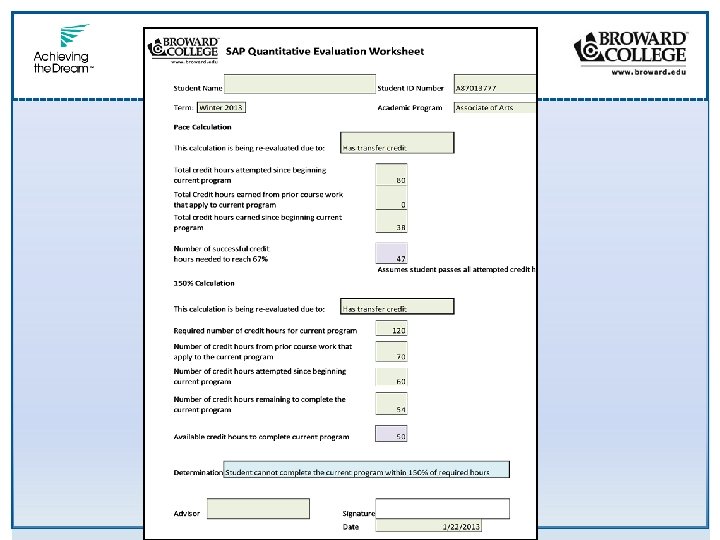
Content Experts for SAP Financial Aid Leadership/Staff • Create a SAP Policy aligned to the needs our student demographics. • Identify the students who are in jeopardy of losing aid • Review and make a determination of eligibility Advisement Leadership/Staff • Qualitative and Quantitative (Academic Progress) • Remedial credit • Transfer credit • Timely Completion of Educational Plan • Change of program/major
Satisfactory Academic Progress (SAP)
CULTURE SHIFT 1. Communication 2. Training 3. Understanding and Buy-in From Silos To Collaboration I, ME, That’s Their Job Our Job to Help Students
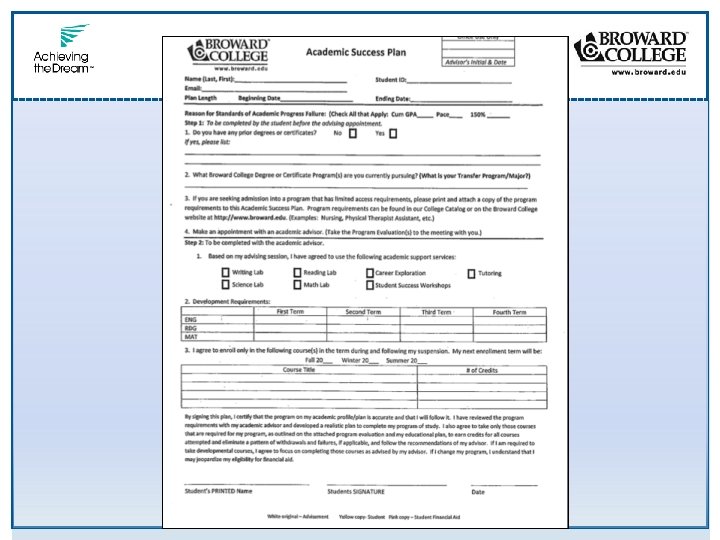
SAP Process Remapped Financial Aid Identifies students in jeopardy of losing aid, or lost aid Student Advisor Notifies students to contact advisement Makes appointment with advisor Review the academic record Which criteria apply? Complete Academic Success Plan
• Academic Progress Impacts Aid No-show rate • Decreased from 35% to 14% More students maintain eligibility • Over 1400 became eligible for an advisement review aligned to policy Unexpected Outcomes Student awareness
A d d e d V A L U E S Career Planning Advisor and Student Relationship Reinforced Holistic Advisement
Evaluate Processes Annually Assess Process Performance Keep Stakeholders Engaged Continuous Improvements
Bob Robbins Janice Stubbs ? ? ? 4 Kaye Francis