Process Instrumentation ERT 213 Process Flow Diagram PFD
")


 Pump, Compressor, Fan &")


 Example 1: Mixed Gas 2610 kg/hr Toluene, C 7 H")
 ��Conveys the major processing steps represented by the equipment useful")


 Since")


 A/B Example Hot water out Ethylene Cold water in Ethanol")

- Slides: 21
Process Instrumentation ERT 213 Process Flow Diagram (PFD)
�� Process diagram/Flowsheeting �� Block Flow Diagram �� Process Flow Diagram �� Introduction to Microsoft Visio Outline
Learning outcome: • By the end of this lecture, students will be able to: • Understand interpret block flow diagram • Analyze and demonstrate process flow diagram based on symbology • To employ process flow diagram to Microsoft Visio Software
LEARNING FLOW Valves In Industry Process & Instrumentation Diagram (P&ID) Pump, Compressor, Fan & Blower ISA Symbology Process Flow Diagram (PFD)
Roughly speaking, communication is paramount ~ As an Engineer, transfer the most amount of information with the least amount of effort on the part of the reader
Introduction to Flowsheeting Flowsheets are the pictorial representation of the process GOAL: Transmit the most amount of information with the least amount of effort on the part of the reader
Type of Flowsheeting/Diagram �� Block Diagram �� Material Flow Sheet �� Energy Flow Sheet �� Process Flow Diagram �� Information Flow Diagram �� Piping and Instrumentation Diagram
What is Block Flow Diagram? It is the simplest flowsheet. Particularly useful in initial studies Useful to show interrelation of streams Process engineer begins process design with a block diagram in which only the feed and product streams are identified. The processes described in the BFD are then broken down into basic functional elements such as reaction and separation sections. Also identify the recycle streams and additional unit operations to achieve the desired operating conditions.
BLOCK FLOW DIAGRAM (BFD) Example 1: Mixed Gas 2610 kg/hr Toluene, C 7 H 8 10, 000 kg/hr Reactor Hydrogen H 2 820 kg/hr C 6 H 6 Gas Separator Benzene, C 6 H 6 8, 210 kg/hr CH 4 C 7 H 8 Mixed Liquid 75% Conversion of Toluene Reaction : C 7 H 8 + H 2 C 6 H 6 + CH 4 Figure 1: Block Flow Diagram for the Production of Benzene
Process Flow Diagram (PFD) ��Conveys the major processing steps represented by the equipment useful for conveying the heat and material balances Useful for conveying major pieces of equipment Useful for conveying processing conditions Useful for conveying utilities ��There are no hard and fast rule but Howat Standards include: ��Essentially every major pieces of equipment ��Every flow stream ��Every temperature ��Every pressure ��Utility flows ��Process unit tagging and numbering
R‐‐‐ 100 P‐‐‐ 100 Reactor Pump Major Pieces of Equipment T‐‐‐ 100 E‐‐‐ 100 P‐‐‐ 101 R‐‐‐ 101 Distillation Column Condenser Pump Reactor Hot water out Ethylene E‐‐‐ 100 V‐‐‐ 104 Cold water in T‐‐‐ 100 CV‐‐‐ 100 Ethanol H 2 SO 4 V‐‐‐ 100 V‐‐‐ 101 V‐‐‐ 103 R‐‐‐ 100 P‐‐‐ 100 CV‐‐‐ 101 V‐‐‐ 105 Ethylene liq. V‐‐‐ 106 Hydrogen V‐‐‐ 102 V‐‐‐ 107 H 2 O Ni P‐‐‐ 101 R‐‐‐ 101 Ethane
Utility Streams R‐‐‐ 100 P‐‐‐ 100 T‐‐‐ 100 E‐‐‐ 100 Reactor Pump Distillation Column Condenser P‐‐‐ 101 R‐‐‐ 101 Pump Reactor Hot water out Ethylene E‐‐‐ 100 V‐‐‐ 104 Cold water in T‐‐‐ 100 CV‐‐‐ 100 Ethanol H 2 SO 4 V‐‐‐ 100 V‐‐‐ 101 V‐‐‐ 103 R‐‐‐ 100 P‐‐‐ 100 CV‐‐‐ 101 V‐‐‐ 105 Ethylene liq. V‐‐‐ 106 Hydrogen V‐‐‐ 102 V‐‐‐ 107 H 2 O Ni P‐‐‐ 101 R‐‐‐ 101 Ethane
Process Flow Streams Stream Numbering and Drawing ‐‐‐Number streams from left to right as much as possible. ‐‐‐Horizontal lines are dominant. Yes No No
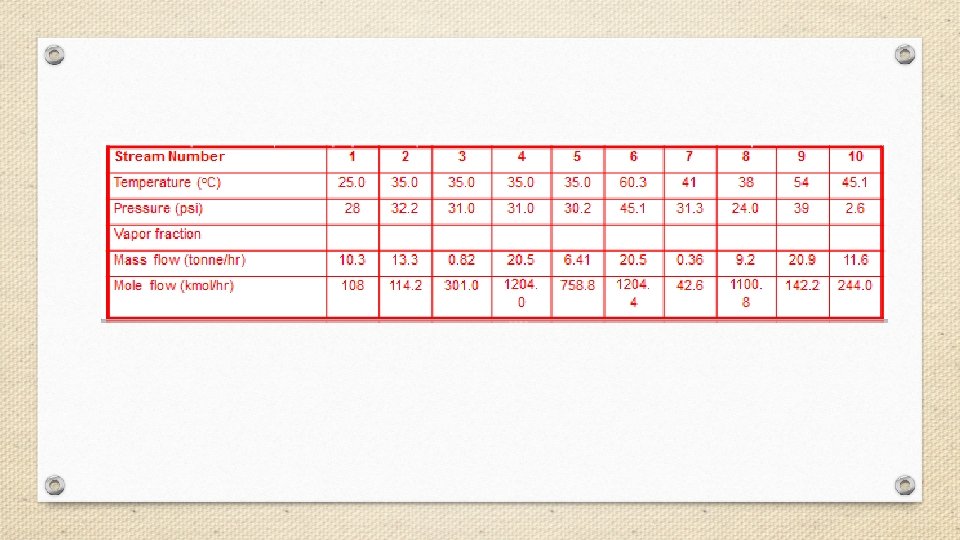
Process Flow Streams �� Stream Information (Operating conditions such as P, T, F) Since diagrams are small not much stream information can be included. Include important data – around reactors and towers, etc. Flags are used Full stream data Details information for each stream in PFD is represented in the table below the drawing.
Process Flow Streams Stream Information ‐ ‐ ‐ Flag 600 Temperature 300 3 24 8 6 9 7 1 10 600 24 2 5 12 11 4 24 Pressure 13 10. 3 Mass Flowrate 108 Molar Flowrate Gas Flowrate Liquid Flowrate
R‐‐‐ 100 P‐‐‐ 100 T‐‐‐ 100 E‐‐‐ 100 P‐‐‐ 101 Reactor Pump Distillation Column Condenser Pump Reactor Stream Information ‐‐‐Flag Hot water out Ethylene liq. E‐‐‐ 100 6 V‐‐‐ 104 25 28 Ethanol H 2 SO 4 T‐‐‐ 100 CV‐‐‐ 100 1 V‐‐‐ 100 V‐‐‐ 101 4 35 32. 2 V‐‐‐ 105 5 20 38 V‐‐‐ 103 3 P‐‐‐ 100 V‐‐‐ 106 Hydrogen R‐‐‐ 100 2 V‐‐‐ 102 Cold water in CV‐‐‐ 101 35 31. 0 Ni V‐‐‐ 107 R‐‐‐ 101 8 7 9 H 2 O P‐‐‐ 101 Ethane 10
Process Unit Tagging & Numbering Process Equipment General Format XX-YZZ A/B XX are the identification letters for the equipment classification C - Compressor or Turbine E - Heat Exchanger H - Fired Heater P - Pump R - Reactor T - Tower TK - Storage Tank V - Vessel Y - designates an area within the plant Supplemental Information ZZ - are the number designation for each item in an equipment class A/B - identifies parallel units or backup units not shown on a PFD Additional description of equipment given on top of PFD
Process Unit Tagging & Numbering R‐‐‐ 100 P‐‐‐ 100 T‐‐‐ 100 E‐‐‐ 100 P‐‐‐ 101 Reactor Pump Distillation Column Condenser Pump Reactor Hot water out Ethylene E‐‐‐ 100 V‐‐‐ 104 Cold water in Ethanol H 2 SO 4 T‐‐‐ 100 CV‐‐‐ 100 V‐‐‐ 101 V‐‐‐ 103 R‐‐‐ 100 P‐‐‐ 100 CV‐‐‐ 101 V‐‐‐ 105 Ethylen e liq. V‐‐‐ 106 Hydrogen V‐‐‐ 102 V‐‐‐ 107 H 2 O Ni P‐‐‐ 101 R‐‐‐ 101 Ethane
PROCESS FLOW DIAGRAM (PFD) A/B Example Hot water out Ethylene Cold water in Ethanol Ethylene liq. Ethanol H 2 SO 4 Hydrogen Ni H 2 O Ethane Ethylene liq. Cold water in H 2 SO 4 Hydrogen Ni H 2 O P‐‐‐ 100 A/B P‐‐‐ 100 B In PFD In Real Plant Ethane
Thank you