Process Improvement Process analysis problem solving to improve

Process Improvement Process analysis & problem solving to improve productivities Chap 7

• Continuous improvement in service organization – Business become more productivity conscious – Sleep Inn chain • Washers and dryers locate behind front desk – Night clerk can load & unload laundry • Night stands are bolted to the wall – No need to vacuum around the legs

Quality & Productivity improvement process • Foundation of Continuous Improvement – Deming – Helping Japanese industries recover from WWII » Quality » Low cost • Customer satisfaction – Putting the customers first • Management by fact – Decision based on objective data – Formal data gathering – Statistical analysis

• Respect for people – Companywide quality improvement program » Train employee with capacity • Problem solving • Self motivated » Encourage problems to be solved at the lowest level • 現地現物

• Plan-Do-Check-Act cycle – Deming’s approach • Checking & inspecting for quality is too late • Focus on process – Plan • Selection of the problems – Change to important indicators » Rate of defections or complaints

– Current process is documented » Flowcharts – Data are collected – Root causes » Possible causes are brainstormed » Using data – Develop action plan » Workable solution » Measure of success » Implementation target agreed upon

– Do • Implement the solution • Monitor the implementation plan – Collect data on performance measure – Noting progress against milestones – Check • Evaluate the results of change – Intended effects – Unforeseen consequence

– Act • Reflect and act on learning – – Process changes are STANDARDIZED Communicated to all involved Celebrate the success Repeat the PDCA cycle

• Problem solving – Table 7. 1

Quality Tools for analysis and problem solving • Midway Airlines – Systemwide on-time performance had deteriorate • • • Check sheet Run chat Histogram Pareto chart Flowchart …

– Check sheet • • Historical record of observations Source of data List of potential problems Frequency of occurrence 正

• Run chart – Track change of important variable over time • Trends • Shifts • Cycles

• Histogram – Frequency distribution • Lack of symmetry • Skewness • Two peaks – Two distributions

• Pareto chart – Orders problems by their relative frequency • Focus efforts on the greatest potential • 80/20 rules

• Flowchart – Visual presentation of process – Identify problems or intervention points • Diamond: decision • Rectangle: activity • Oval: beginning, ending, connection

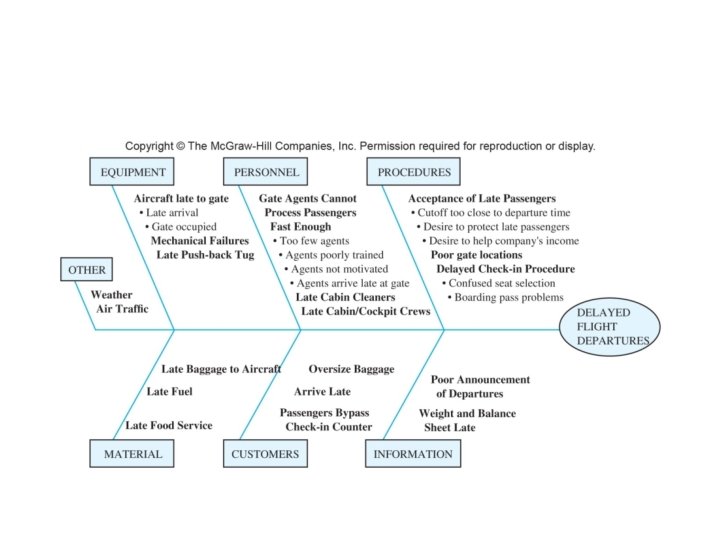
• Cause-and-effect diagram – Structured approach – Identify, explore, and display potential causes – Discover root cause • Causes are uncovered by asking – Who, what, where, why, when, and how – Fishbone chart 魚骨圖 – Ishikawa chart 石川圖

• Scatter Diagram – Visually display the relationship between two variables • Identify possible correlation

– Midway airlines • Scatter diagram confirm – Late passengers versus departure delayed • Established and advertised on-time departures – Refuse late passengers to board » Even planes are still at gate • After passengers realized Midway is serious – Late arrivals declined significantly

• Control chart 管制圖 – Monitor process – Management take action only at out-of-control

Benchmarking • Comparison with the performance of “best in class” – Singapore airlines: outstanding cabin service – Fedex: consistent overnight delivery – Hampton Inn: clean room – Nordstrom: attentive salesperson

– Visiting the leading firm to learn the firsthand – Going outside one’s own field • Manufacturing – Pit-stop of auto racing » Quick production-line changeover – Domino’s pizza » Deliver customized pizza within 30 minutes

– Benchmarking process • Select a critical process that need improvement • Identify an organization that excels in the process • Contact the benchmark firm – Make a visit – Study the process • Analyze the finding • Improve our process accordingly

Improvement programs • Quality begins – Develop positive attitude among all people • • Employee selection Training Initial job assignments Career advancement

• Deming’s 14 -points program – Management is responsible 85 percent of all quality problems – Management needs to provide leadership in changing • The system • The processes

1. Create constancy of purpose for improvements of product and service • • Stop focus on next quarter solely Build for future

2. Adopt new philosophy • Refuse to allow commonly accepted poor level of work, delay, and lax service 3. Cease dependence on mass inspection • Focus on improving the process

4. End the practice of awarding business on price tag only • • • Purchase should based on quality, not price Reduce the number of vendors Reward high-quality suppliers with long-term contracts 5. Constantly and forever improve the system of production and service • • Search problems in the system, Seek ways of improvement

6. Institute modern methods of training on the job • Use statistical method 7. Institute modern methods of supervising • Provide tools and techniques to help worker do their jobs 8. Drive out fear • Encourage communication of problems and expression of ideas

9. Break down barriers between departments • Encourage problem solving through – – Teamwork quality control circle 10. Eliminate numerical goals for the workforce • • Numerical goals do not work by itself Most of needed changes are outside workers’ control

11. Eliminate work standard and numerical quotas • • Focusing on quantity will lead to poor quality Continuous improvement in quality and productivity will motivate workers 12. Remove barriers that hinder hourly workers • Worker need feedback on the quality of their work

13. Institute a vigorous program of education and training • Training & re-training is necessary – – Changes in technology Personnel turnover 14. Create a structure in top management • Push the above 13 points everyday – Permanent commitment to continuous improvement

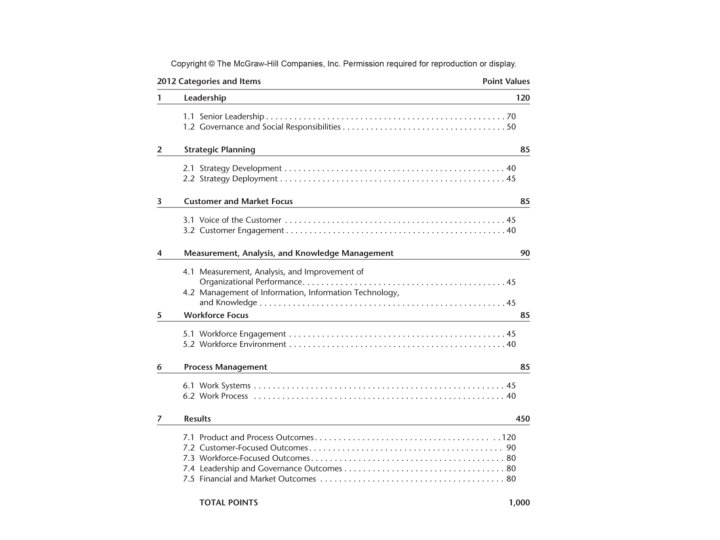
• Baldrige National Quality Award – 1987 – Recognize US companies excel in quality • • • Manufacturing Service Healthcare Education Small business

• ISO 9000 – Quality management system standards – De facto requirement for doing business • “qualifier” – International organization of standardization – Certification • Signal a quality management system in place – Ensures consistency of output quality – “say what you do, and do what you say”

– ISO 9000 important characteristics • Does not prescribe specific practices • Does not say anything directly about the quality • Certification is provided by a highly decentralized system

– ISO 9000 implement a three-component cycle • Planning – Activities affecting quality must be planned » Goals, authority, and responsibility • Control – Activities affect quality must be controlled » At all levels » Problems are anticipated and averted » Corrective actions are planned and carried out

• Documentation – Activities affecting quality must be documented » Quality objectives and methods » Smooth interaction within organization » Feedback for planning cycle » Objective evidence of quality system performance

• Six Sigma – Rigorous and disciplined methodology • Use data and statistical analysis – Measure and improve company’s performance • Identify and eliminate defects – Enhance customer satisfaction – Motorola, 1980 s – Jack Welch, General Electric

– Objective of Six Sigma • To reduce or narrow variation in performance • Variation – Natural part of any process • Statistical measure of process variation – Cp: process capability index – Cpk: process capability index » (if mean is not centered between USL, LSL)

– Training and responsibility hierarchy

– Improvement methodology • Define – Define customer’s requirements • Measure – Measure current performance • Analyze – Identify potential causes • Improve – Process design/redesign • Control – Standardization

• Lean service – Principles pioneered by Toyota • • • Toyota Production Systems (TPS) Waste elimination Continuous flow Customer demand pull Just in time – Continuous rapid flow of value-adding activities to satisfy customer needs

– Process flow improvement • Service blueprinting – Potential source for improvement – Ex. Mapping patient’s flow thru hospital

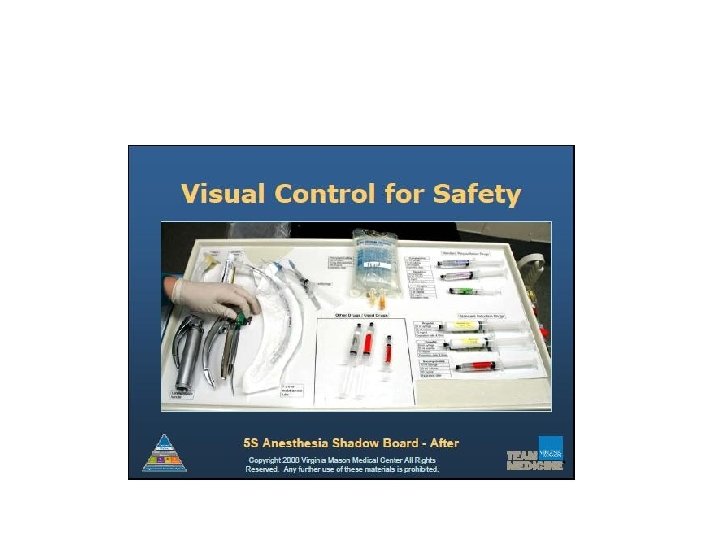
– Internal groups for quality improvements • Continuous improvement teams • Quality control circle (QCC) – Better housekeeping • 5 S – – – 整理/常組織(Seiri, Structurise) 整顿/常整頓(Seiton, Systematise) 清掃/常清潔(Seiso, Sanitise) 清潔/常規範(Seiketsu, Standardise) 身美/常自律(Seitsuke, Self-discipline)

Value Stream Mapping 現狀圖

• Mini cases – Case 7. 1 Sonora County Sheriff – Case 7. 2 Mega Bytes Restaurant – 本章不需要引用『本土個案』
- Slides: 49