Process Improvement CIS 376 Bruce R Maxim UMDearborn

Process Improvement CIS 376 Bruce R. Maxim UM-Dearborn

Process Improvement Goals • Understanding existing processes • Introduce process changes to improve quality, reduce costs, or accelerate schedules • Industry is demanding increased attention to quality in general • Most process improvement work focuses on defect reduction and prevention • There are other process attributes that deserve our attention

Process Improvement Attributes - part 1 • Understandability - degree to which a process is well defined and understood • Visibility - process activities have results that are externally recognizable • Supportability - process activities supported by CASE tools • Acceptability - defined processes are used and accepted by software engineers

Process Improvement Attributes - part 2 • Reliability - process is defined so that errors are avoided or trapped before product errors result • Robustness - process can continue despite unexpected problems • Maintainability - process can evolve to reflect changing organizational requirements or identified process improvements • Rapidity - the time required to complete a system from specification to delivery

Process Improvement Stages • Process analysis – modeling and quantitative analysis of existing processes • Improvement identification – quality, cost, and scheduling bottlenecks located • Process change introduction – modify process to remove bottlenecks • Process change training – train staff involved in process revision proposals • Change tuning – process improvements are revised and allowed to evolve

Process Improvement Activities

Process and Product Quality • Closely related to one another • Good processes are usually required to produce good products • In manufacturing applications, process is principle determinant of quality • For design-based activities, the capabilities of the designers are also important

Product Quality Factors • Development technology – for large projects with average capability this is the main determinant of product quality • Quality of people involved – for small projects the developer capability is the main determinant of product quality • Process quality – significant for both small and large projects • Cost, time, and schedule constraints – unrealistic schedules can doom the quality of most products

Process Analysis and Modeling • Process analysis – study of existing processes to understand relationships among process components – allows comparisons with other processes • Process modeling – documentation of process in which the tasks, roles, and entities used are recorded – best to represent models graphically – several different perspectives may be used (e. g. activities, deliverables, etc. ) – model should be examined for weaknesses, this involves discussion with stakeholders
 – has")
Process Model Elements - part 1 • Activity - (round edged rectangle) – has clearly defined objective, entry, and exit conditions • Process - (round edged rectangle with shadow) – set of coherent activities with agreed upon objective • Deliverable - (rectangle with shadow) – tangible output of an activity predicted by project plan • Condition - (parallelogram) – process or activity pre- or post-conditions
 – defined")
Process Model Elements - part 2 • Role - (circle with shadow) – defined and bounded area of responsibility • Exception - (double edged box)) – description of how to modify the process if anticipated or unanticipated events occur • Communication - (arrow) – exchange of information between people and/or machines

Process Model Example

Process Exceptions • Process models can’t represent how to handle exceptions – – key people are lost prior to a critical review failure of e-mail server for several days organizational reorganization request to respond to change requests • General procedure is to suspend the process model and follow RMMM plans augmented with the managers own initiatives

Process Measurement • Wherever possible quantitative process data should be collected • Organizations without process standards may have to be define processes before measurements can be made (since they won’t know what to measure) • Process measurements should be used to assess process improvements • Organization objectives drive process improvement, not measurements

Process Measurement Classes • Time taken to complete process activities – e. g. calendar time to complete a milestone • Resources required to complete processes or activities – e. g. person months • Number of event occurrences – e. g. number of defects found

Goal Question Metric Paradigm • Goals – What is the organization trying to achieve? – Process improvement deals with goal satisfaction. • Questions – Concerned with areas of uncertainty related to goals. – You need process knowledge to derive questions. • Metrics – Measurements collected to answer questions

SEI Process Maturity Model • Level 1 - Initial – essentially uncontrolled • Level 2 - Repeatable – project management procedures defined and used • Level 3 - Defined – process management strategies defined and used • Level 4 - Managed – quality management strategies defined and used • Level 5 - Optimizing – process improvement strategies defined and used

SEI Process Model Problems • Focuses on project management rather than project development • Ignores the use of strategies like rapid prototyping • Model is intended to represent organizational capability and not practices used on particular projects • There may be wide variation in the practices used in a single organization • Capability assessment is questionnaire-based

Capability Assessment Process

Process Classification • Informal – No detailed process model, developers created their own way of doing things • Managed – defined model drive development process • Methodical – processes supported by standard development method • Supported – processes supported by automated CASE tools

Process Tool Support

Defect Removal Effectiveness • Defect removal is central to software development • One of the top expense items • Affects project scheduling • Improves product quality

PSP - Defect Density • This is the primary defect measure used in PSP • Dd = 1000 * D/N • D = total number of defects found in all phases of the process • N = number of new and changed lines of code in the program

Defect Density Example • For a program with 96 new or changed lines of code and 14 defects • Dd = 1000 * (14/96) = 145. 83 defects/KLOC
/(#errors")
Defect Metrics - part 1 • Error Detection Efficiency 100%*(#errors found in 1 inspection)/(#errors in product before inspection) • Defect Removal Efficiency 100%*(#defects found now)/(#defects found now + #defects found later) • Error Detection Percentage 100%*(#inspection errors)/(#inspection errors + #valid discrepancy reports)
 (#prerelease defects)/(#prerelease defects")
Defect Metrics - part 2 • Total Defect Containment Effectiveness (TDCE) (#prerelease defects)/(#prerelease defects + #post-release defects) • Phase Containment Effectiveness (PCE) (#phase(i) defects)/(#phase(i) defects + #phase(i+x) defects) • Effectiveness (E) 100%*N/(N + S) N = #defects found by an activity S = #defects found in subsequent activities

Phase-based Defect Removal Model • Defects present at exit of each development phase are estimated • This allows us to set realistic targets and assess the costs of reducing error injection rates • This is a quality management tool and not a device for estimation of software reliability • How would this work in practice?

Assumptions • Suppose we decide to create two broad defect removal classes – activities that handle defects before code is integrated into the system library (design reviews, inspections, unit testing) – formal machine tests after code integration • Also assume the same defect removal effectiveness for each phase

Example - part 1 • MP = major problems found in before integration • PTR = errors found during formal machine tests • mu = MP/PTR – the higher the value of mu the better • Q = defects found after release to customer • TD = (MP + PTR + Q) – total defects for life of software

Example - part 2 • Phase 1 effectiveness E 1 = MP/TD MP = E 1 * TD • Phase 2 effectiveness E 2 = PTR/(TD - MP) PTR = E 2 * (TD - MP)

Example - part 3 • Some equations that can be useful in quality planning (assuming that E 1 = E 2) Q = PTR /(mu - 1) Q = MP / [mu * (mu - 1)] Q = TD / (mu * mu) • These equations work with either raw or normalized defect values
/ (defects")
PSP – Phase Yield Phase yield = 100 * (defects removed during phase)/ (defects in product at phase entry) Note: cannot be computed until project is completed

Phase Yield - Example • • 5 defects found during code review 3 defects found during compile 2 defects found during unit testing 2 defects found during integration testing • Phase yield for compile = 100 * 3 / (3 + 2) = 42. 9 % • Phase yield for code review = 100 * 5 /(5 + 3 + 2) = 41. 7 %
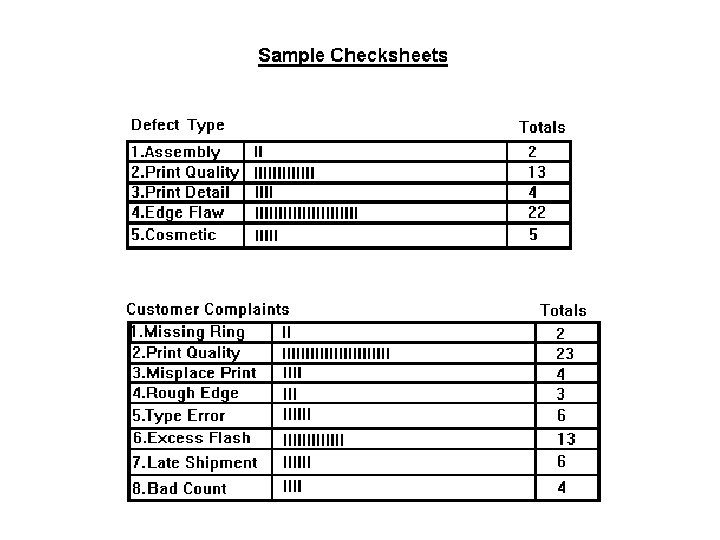
 – used to gather data")
Seven Basic Software Quality Tools • Checklists (paper forms) – used to gather data for later analysis – used to confirm that process tasks are complete – both simple yes/no and branching questions

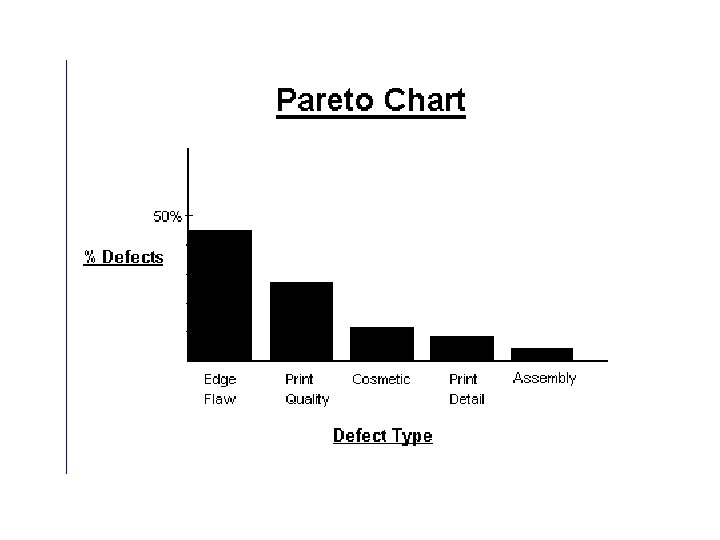
Seven Basic Software Quality Tools • Pareto Diagram – bar chart sorted in descending height order – vertical axis labeled with # defects – horizontal axis (nominal) labeled with defect cause types – software defects tends cluster near related causes

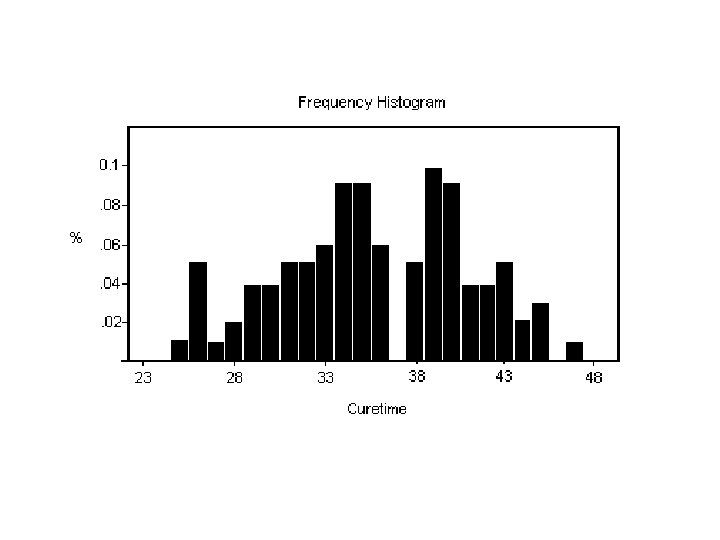
Seven Basic Software Quality Tools • Histogram – frequency bar graph – vertical axis is # defects – horizontal axis has ordinal or interval type labels

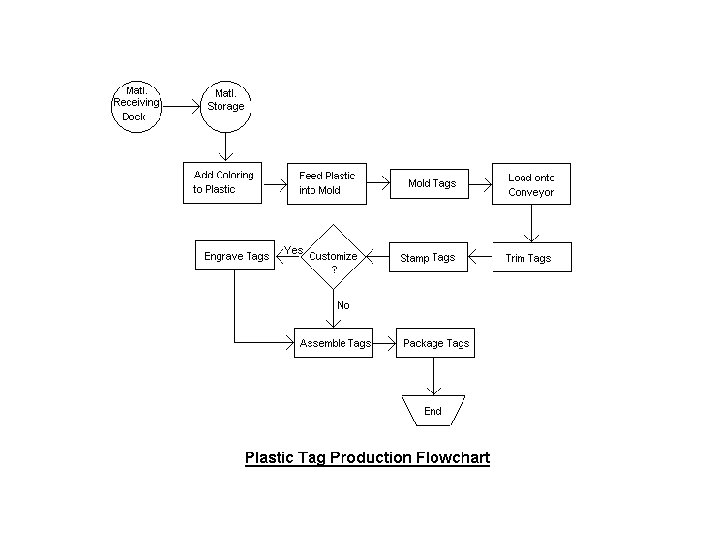
Seven Basic Software Quality Tools • Flowchart – pictorial representation of a process – breaks down process into its constituent steps – can be useful in identifying were errors are likely to be found in the system
 – used with correlation,")
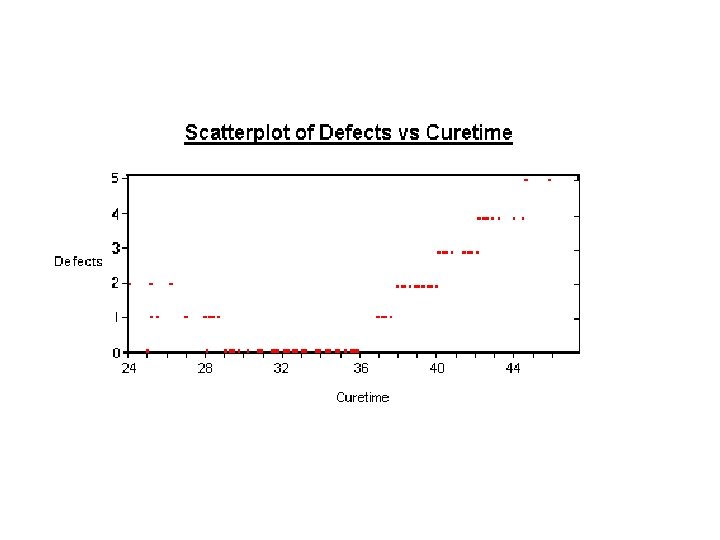
Seven Basic Software Quality Tools • Scatter diagram (point plots) – used with correlation, regression, or statistical modeling – vertical axis is # defects – horizontal axis some metric (e. g. Mc. Cabe’s index)

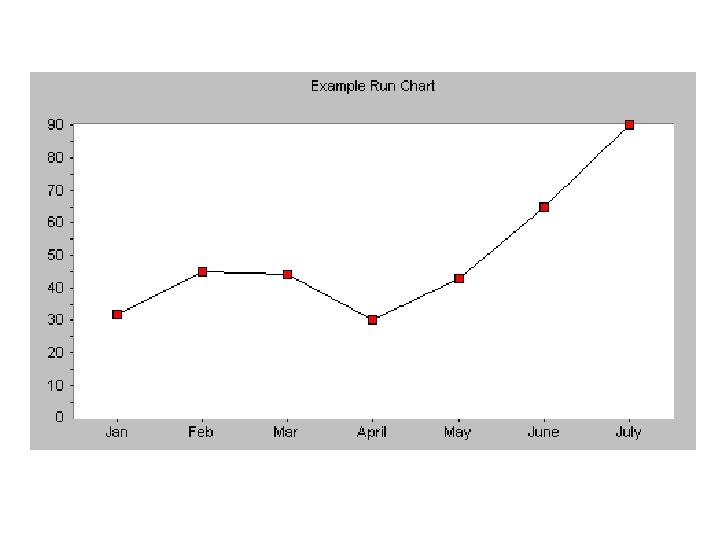
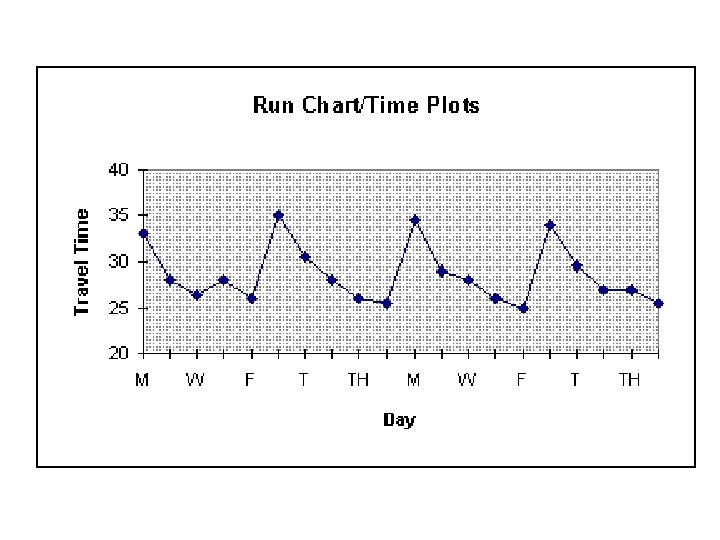
Seven Basic Software Quality Tools • Run chart – line graph showing performance of dependent variable (y) over time (x) – best used for trend analysis (e. g. arrival of defects during formal machine testing) – can plot cumulative dependent variables (S curves)

Seven Basic Software Quality Tools • Control chart – advanced form of run chart where capability is defined – upper and lower control limits (dashed lines) are drawn to alert the user when dependent measure is out of control – can plot cumulative dependent variables (S curves) – C chart based on # conforming or not – R chart based on subgroup ranges (max – min) – X bar chart based on subgroup means
")
Control Chart (C)
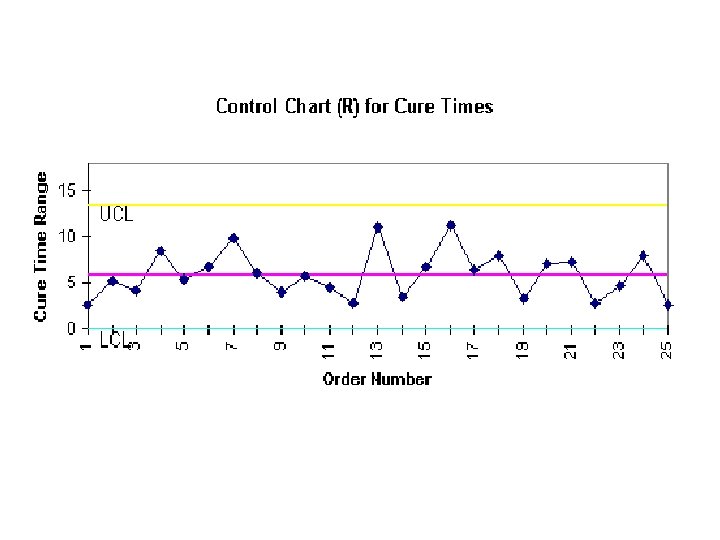
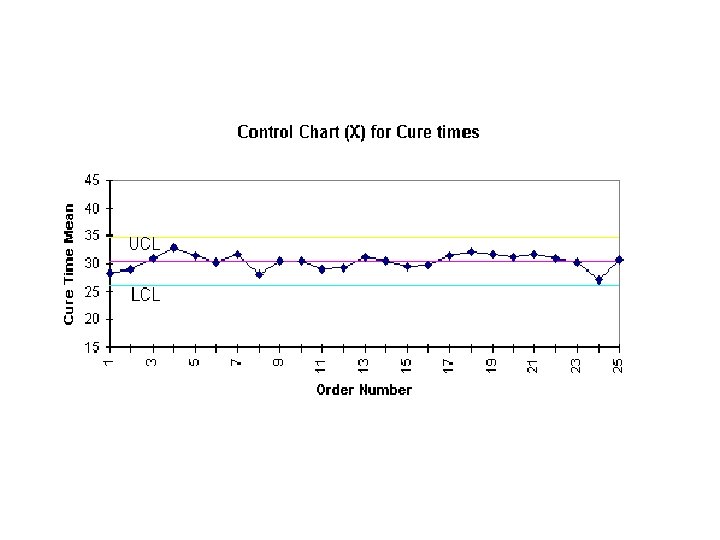
 diagram – not")
Seven Basic Software Quality Tools • Cause and effect (fish bone) diagram – not widely used in software development, but can be useful – shows effect between quality variable and the factors affecting it

Fishbone Diagram
- Slides: 52